Mga Batayang Estadistika
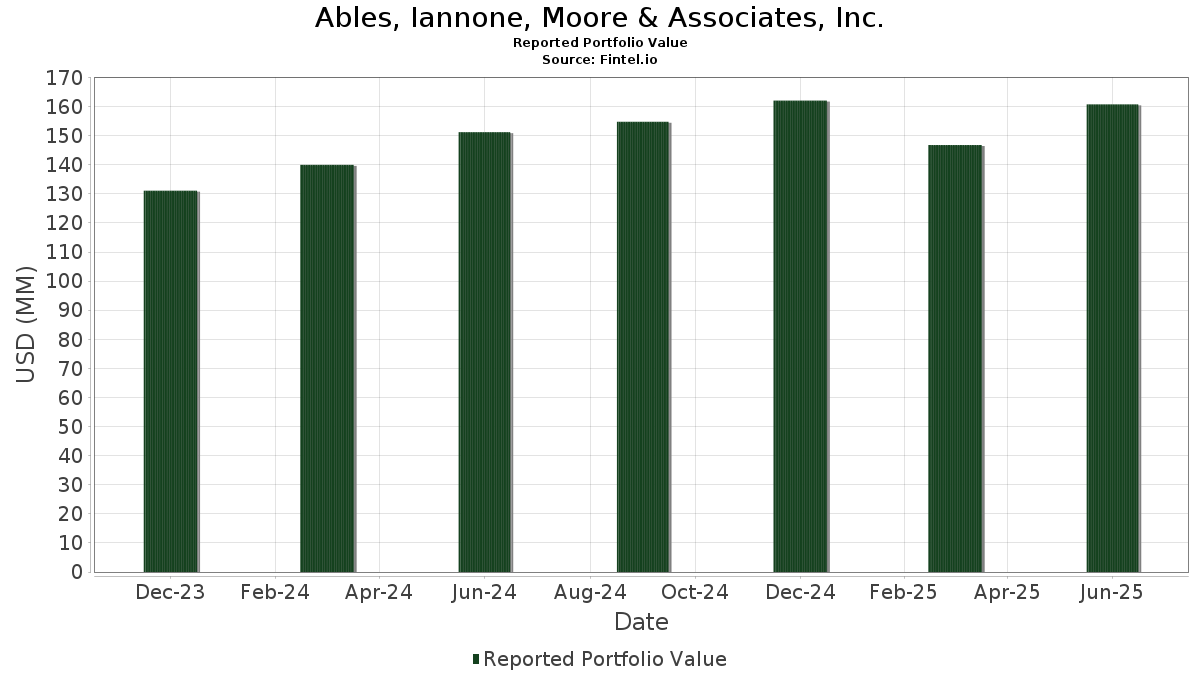
| Nilai Portofolio | $ 160,763,161 |
| Posisi Saat Ini | 56 |
Kepemilikan Terbaru, Kinerja, AUM (dari 13F, 13D)
Ables, Iannone, Moore & Associates, Inc. telah mengungkapkan total kepemilikan 56 dalam pengajuan SEC terbaru mereka. Nilai portofolio terbaru dihitung sebesar $ 160,763,161 USD. Aset yang Dikelola (AUM) sebenarnya adalah nilai ini ditambah kas (yang tidak diungkapkan). Aset-aset utama Ables, Iannone, Moore & Associates, Inc. adalah Apple Inc. (US:AAPL) , NVIDIA Corporation (US:NVDA) , Amazon.com, Inc. (US:AMZN) , Alphabet Inc. (US:GOOGL) , and Visa Inc. (US:V) .
Peningkatan Tertinggi Kuartal Ini
Kami menggunakan perubahan dalam alokasi portofolio karena ini adalah metrik yang paling bermakna. Perubahan dapat disebabkan oleh perdagangan atau perubahan harga saham.
| Keamanan | Saham (MM) |
Nilai (Juta Dolar AS) |
Portfolio % | ΔPorsyento ng Portfolio |
|---|---|---|---|---|
| 0.12 | 19.61 | 12.1957 | 2.7637 | |
| 0.02 | 7.70 | 4.7924 | 0.8255 | |
| 0.08 | 5.89 | 3.6641 | 0.5128 | |
| 0.07 | 16.09 | 10.0076 | 0.4840 | |
| 0.06 | 11.12 | 6.9166 | 0.3013 | |
| 0.00 | 0.66 | 0.4082 | 0.2704 | |
| 0.02 | 7.22 | 4.4906 | 0.2265 | |
| 0.02 | 2.08 | 1.2936 | 0.2220 | |
| 0.00 | 1.08 | 0.6699 | 0.1660 | |
| 0.00 | 0.62 | 0.3846 | 0.1619 |
Penurunan Tertinggi Kuartal Ini
Kami menggunakan perubahan dalam alokasi portofolio karena ini adalah metrik yang paling bermakna. Perubahan dapat disebabkan oleh perdagangan atau perubahan harga saham.
| Keamanan | Saham (MM) |
Nilai (Juta Dolar AS) |
Portfolio % | ΔPorsyento ng Portfolio |
|---|---|---|---|---|
| 0.10 | 20.67 | 12.8580 | -2.4222 | |
| 0.01 | 3.35 | 2.0864 | -0.5368 | |
| 0.02 | 8.52 | 5.2996 | -0.5029 | |
| 0.01 | 2.15 | 1.3357 | -0.4134 | |
| 0.01 | 2.46 | 1.5290 | -0.2720 | |
| 0.01 | 5.43 | 3.3762 | -0.2351 | |
| 0.02 | 3.74 | 2.3264 | -0.2284 | |
| 0.18 | 1.02 | 0.6348 | -0.2083 | |
| 0.01 | 1.16 | 0.7203 | -0.1970 | |
| 0.01 | 1.97 | 1.2235 | -0.1495 |
Pengajuan 13F dan Dana
Formulir ini diajukan pada 2025-07-07 untuk periode pelaporan 2025-06-30. Klik ikon tautan untuk melihat riwayat transaksi selengkapnya.
Tingkatkan ke versi premium untuk membuka data premium dan ekspor ke Excel. ![]() .
.
| Keamanan | Ketik | Harga Saham Rata-rata | Saham (MM) |
ΔSaham (%) |
ΔSaham (%) |
Nilai ($MM) |
Portpolyo (%) |
ΔPortofolio (%) |
|
|---|---|---|---|---|---|---|---|---|---|
| AAPL / Apple Inc. | 0.10 | -0.22 | 20.67 | -7.84 | 12.8580 | -2.4222 | |||
| NVDA / NVIDIA Corporation | 0.12 | -2.85 | 19.61 | 41.62 | 12.1957 | 2.7637 | |||
| AMZN / Amazon.com, Inc. | 0.07 | -0.19 | 16.09 | 15.09 | 10.0076 | 0.4840 | |||
| GOOGL / Alphabet Inc. | 0.06 | 0.48 | 11.12 | 14.51 | 6.9166 | 0.3013 | |||
| V / Visa Inc. | 0.02 | -1.26 | 8.52 | 0.02 | 5.2996 | -0.5029 | |||
| MSFT / Microsoft Corporation | 0.02 | -0.15 | 7.70 | 32.33 | 4.7924 | 0.8255 | |||
| JPM / JPMorgan Chase & Co. | 0.02 | -2.41 | 7.22 | 15.34 | 4.4906 | 0.2265 | |||
| TTD / The Trade Desk, Inc. | 0.08 | -3.21 | 5.89 | 27.35 | 3.6641 | 0.5128 | |||
| HD / The Home Depot, Inc. | 0.01 | 2.35 | 5.43 | 2.40 | 3.3762 | -0.2351 | |||
| BAC / Bank of America Corporation | 0.11 | -1.78 | 5.03 | 11.39 | 3.1257 | 0.0521 | |||
| AMT / American Tower Corporation | 0.02 | -1.81 | 3.74 | -0.27 | 2.3264 | -0.2284 | |||
| BRK.B / Berkshire Hathaway Inc. | 0.01 | -4.50 | 3.35 | -12.88 | 2.0864 | -0.5368 | |||
| VMC / Vulcan Materials Company | 0.01 | -1.49 | 2.98 | 10.13 | 1.8542 | 0.0102 | |||
| GOOG / Alphabet Inc. | 0.01 | -0.71 | 2.65 | 12.75 | 1.6454 | 0.0468 | |||
| MCD / McDonald's Corporation | 0.01 | -0.59 | 2.46 | -7.00 | 1.5290 | -0.2720 | |||
| DE / Deere & Company | 0.00 | -3.22 | 2.20 | 4.82 | 1.3671 | -0.0610 | |||
| JNJ / Johnson & Johnson | 0.01 | -9.20 | 2.15 | -16.36 | 1.3357 | -0.4134 | |||
| UPS / United Parcel Service, Inc. | 0.02 | 44.06 | 2.08 | 32.17 | 1.2936 | 0.2220 | |||
| COST / Costco Wholesale Corporation | 0.00 | 0.00 | 1.99 | 4.67 | 1.2408 | -0.0575 | |||
| STZ / Constellation Brands, Inc. | 0.01 | 21.61 | 1.99 | 7.75 | 1.2365 | -0.0198 | |||
| UNH / UnitedHealth Group Incorporated | 0.01 | 63.85 | 1.97 | -2.43 | 1.2235 | -0.1495 | |||
| CSX / CSX Corporation | 0.05 | -2.62 | 1.48 | 7.96 | 0.9205 | -0.0133 | |||
| PEP / PepsiCo, Inc. | 0.01 | 20.61 | 1.33 | 6.24 | 0.8271 | -0.0258 | |||
| WM / Waste Management, Inc. | 0.01 | -1.12 | 1.21 | -2.34 | 0.7545 | -0.0910 | |||
| TSLA / Tesla, Inc. | 0.00 | -7.25 | 1.21 | 13.67 | 0.7503 | 0.0274 | |||
| IBIT / iShares Bitcoin Trust ETF | 0.02 | -1.74 | 1.18 | 28.49 | 0.7325 | 0.1081 | |||
| CVX / Chevron Corporation | 0.01 | 0.47 | 1.16 | -14.04 | 0.7203 | -0.1970 | |||
| ABNB / Airbnb, Inc. | 0.01 | -7.12 | 1.11 | 2.88 | 0.6881 | -0.0443 | |||
| LLY / Eli Lilly and Company | 0.00 | 10.19 | 1.10 | 3.95 | 0.6871 | -0.0365 | |||
| QQQ / Invesco QQQ Trust, Series 1 | 0.00 | 23.78 | 1.08 | 45.60 | 0.6699 | 0.1660 | |||
| ALIT / Alight, Inc. | 0.18 | -13.61 | 1.02 | -17.54 | 0.6348 | -0.2083 | |||
| WTS / Watts Water Technologies, Inc. | 0.00 | 2.28 | 0.99 | 23.33 | 0.6187 | 0.0692 | |||
| SO / The Southern Company | 0.01 | -4.42 | 0.98 | -4.56 | 0.6125 | -0.0903 | |||
| VLO / Valero Energy Corporation | 0.01 | -1.43 | 0.95 | 0.32 | 0.5898 | -0.0541 | |||
| AMGN / Amgen Inc. | 0.00 | -0.48 | 0.93 | -10.80 | 0.5808 | -0.1324 | |||
| XOM / Exxon Mobil Corporation | 0.01 | -1.60 | 0.83 | -10.86 | 0.5161 | -0.1176 | |||
| DUK / Duke Energy Corporation | 0.01 | 8.41 | 0.77 | 4.91 | 0.4786 | -0.0211 | |||
| D / Dominion Energy, Inc. | 0.01 | -3.37 | 0.76 | -2.57 | 0.4722 | -0.0588 | |||
| CRM / Salesforce, Inc. | 0.00 | -1.01 | 0.67 | 0.61 | 0.4137 | -0.0368 | |||
| NEE / NextEra Energy, Inc. | 0.01 | 0.60 | 0.66 | -1.34 | 0.4112 | -0.0459 | |||
| IVV / iShares Trust - iShares Core S&P 500 ETF | 0.00 | 193.61 | 0.66 | 224.75 | 0.4082 | 0.2704 | |||
| TSM / Taiwan Semiconductor Manufacturing Company Limited - Depositary Receipt (Common Stock) | 0.00 | 38.65 | 0.62 | 89.57 | 0.3846 | 0.1619 | |||
| LIN / Linde plc | 0.00 | -3.70 | 0.61 | -3.02 | 0.3803 | -0.0489 | |||
| UBER / Uber Technologies, Inc. | 0.01 | 0.48 | 0.55 | 28.77 | 0.3400 | 0.0506 | |||
| ONB / Old National Bancorp | 0.02 | 0.00 | 0.52 | 0.77 | 0.3251 | -0.0285 | |||
| PG / The Procter & Gamble Company | 0.00 | -1.26 | 0.49 | -7.77 | 0.3036 | -0.0566 | |||
| MAA / Mid-America Apartment Communities, Inc. | 0.00 | 2.68 | 0.40 | -9.15 | 0.2470 | -0.0513 | |||
| GS / The Goldman Sachs Group, Inc. | 0.00 | 0.00 | 0.39 | 29.43 | 0.2413 | 0.0373 | |||
| LH / Labcorp Holdings Inc. | 0.00 | -4.84 | 0.39 | 7.50 | 0.2409 | -0.0049 | |||
| MAR / Marriott International, Inc. | 0.00 | -6.77 | 0.38 | 7.12 | 0.2340 | -0.0057 | |||
| WMT / Walmart Inc. | 0.00 | -1.28 | 0.36 | 9.73 | 0.2252 | 0.0009 | |||
| CAT / Caterpillar Inc. | 0.00 | 0.44 | 0.27 | 18.06 | 0.1671 | 0.0122 | |||
| MA / Mastercard Incorporated | 0.00 | 0.00 | 0.23 | 2.67 | 0.1440 | -0.0098 | |||
| PLD / Prologis, Inc. | 0.00 | 7.71 | 0.23 | 1.34 | 0.1416 | -0.0115 | |||
| AVGO / Broadcom Inc. | 0.00 | 0.22 | 0.1392 | 0.1392 | |||||
| MTBA / Simplify Exchange Traded Funds - Simplify MBS ETF | 0.00 | 1.18 | 0.22 | 0.94 | 0.1340 | -0.0112 | |||
| FSLY / Fastly, Inc. | 0.00 | -100.00 | 0.00 | -100.00 | -0.0440 | ||||
| DIS / The Walt Disney Company | 0.00 | -100.00 | 0.00 | 0.0000 |