Mga Batayang Estadistika
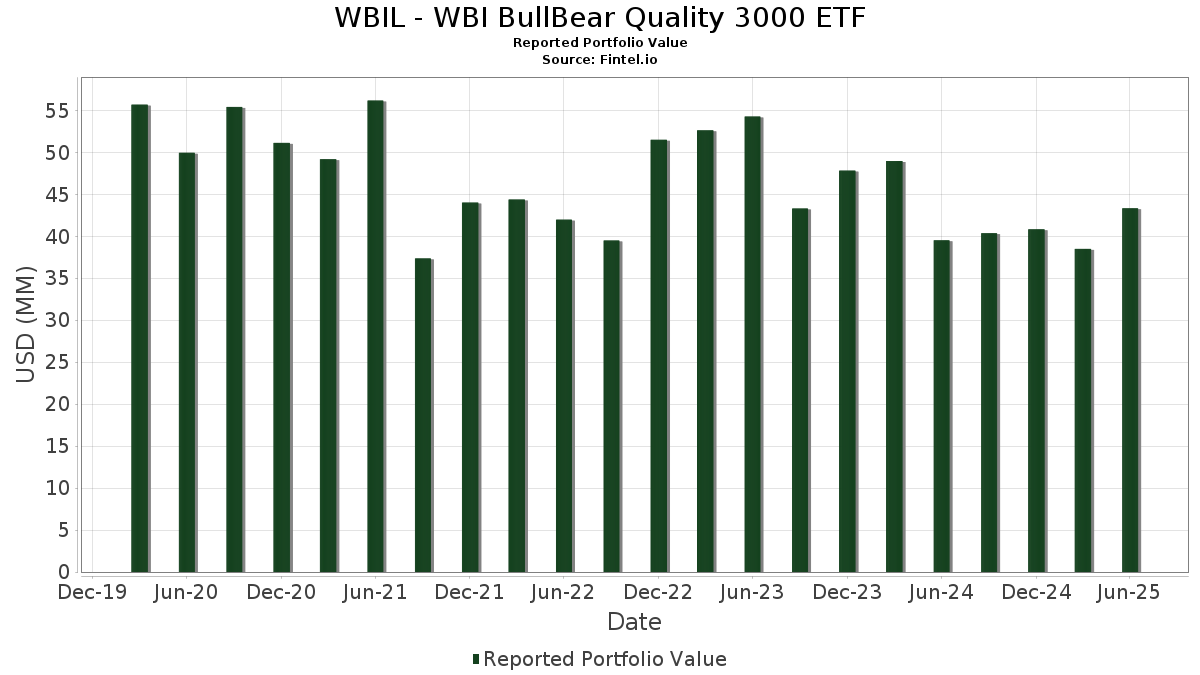
| Nilai Portofolio | $ 43,329,134 |
| Posisi Saat Ini | 71 |
Kepemilikan Terbaru, Kinerja, AUM (dari 13F, 13D)
WBIL - WBI BullBear Quality 3000 ETF telah mengungkapkan total kepemilikan 71 dalam pengajuan SEC terbaru mereka. Nilai portofolio terbaru dihitung sebesar $ 43,329,134 USD. Aset yang Dikelola (AUM) sebenarnya adalah nilai ini ditambah kas (yang tidak diungkapkan). Aset-aset utama WBIL - WBI BullBear Quality 3000 ETF adalah Microsoft Corporation (US:MSFT) , NVIDIA Corporation (US:NVDA) , Amazon.com, Inc. (US:AMZN) , Alphabet Inc. (US:GOOGL) , and Roblox Corporation (US:RBLX) . Posisi baru WBIL - WBI BullBear Quality 3000 ETF meliputi: Cardinal Health, Inc. (US:CAH) , VeriSign, Inc. (US:VRSN) , McKesson Corporation (US:MCK) , Vertiv Holdings Co (US:VRT) , and TKO Group Holdings, Inc. (US:TKO) .
Peningkatan Tertinggi Kuartal Ini
Kami menggunakan perubahan dalam alokasi portofolio karena ini adalah metrik yang paling bermakna. Perubahan dapat disebabkan oleh perdagangan atau perubahan harga saham.
| Keamanan | Saham (MM) |
Nilai (Juta Dolar AS) |
Portfolio % | ΔPorsyento ng Portfolio |
|---|---|---|---|---|
| 4.34 | 4.34 | 12.9781 | 12.9781 | |
| 4.34 | 4.34 | 12.9781 | 12.9781 | |
| 1.21 | 1.21 | 3.6120 | 3.6120 | |
| 1.21 | 1.21 | 3.6120 | 3.6120 | |
| 0.01 | 0.94 | 2.8066 | 2.8066 | |
| 0.00 | 0.85 | 2.5353 | 2.5353 | |
| 0.00 | 0.76 | 2.2651 | 2.2651 | |
| 0.00 | 0.75 | 2.2453 | 2.2453 | |
| 0.00 | 0.74 | 2.2211 | 2.2211 | |
| 0.01 | 0.95 | 2.8309 | 2.1721 |
Penurunan Tertinggi Kuartal Ini
Kami menggunakan perubahan dalam alokasi portofolio karena ini adalah metrik yang paling bermakna. Perubahan dapat disebabkan oleh perdagangan atau perubahan harga saham.
| Keamanan | Saham (MM) |
Nilai (Juta Dolar AS) |
Portfolio % | ΔPorsyento ng Portfolio |
|---|---|---|---|---|
| 0.00 | 0.29 | 0.8761 | -3.9366 | |
| 0.00 | 0.33 | 0.9966 | -3.8115 | |
| 0.01 | 0.45 | 1.3401 | -3.6010 | |
| 0.00 | 0.46 | 1.3777 | -3.0979 | |
| 0.00 | 0.46 | 1.3835 | -2.9588 | |
| 0.00 | 0.39 | 1.1645 | -2.8642 | |
| 0.01 | 0.72 | 2.1634 | -2.7497 | |
| 0.01 | 0.65 | 1.9483 | -2.7350 | |
| 0.00 | 0.40 | 1.1921 | -2.5741 | |
| 0.00 | 0.39 | 1.1710 | -2.3158 |
Pengajuan 13F dan Dana
Formulir ini diajukan pada 2025-08-28 untuk periode pelaporan 2025-06-30. Klik ikon tautan untuk melihat riwayat transaksi selengkapnya.
Tingkatkan ke versi premium untuk membuka data premium dan ekspor ke Excel. ![]() .
.
| Keamanan | Ketik | Harga Saham Rata-rata | Saham (MM) |
ΔSaham (%) |
ΔSaham (%) |
Nilai ($MM) |
Portpolyo (%) |
ΔPortofolio (%) |
|
|---|---|---|---|---|---|---|---|---|---|
| Mount Vernon Liquid Assets Portfolio, LLC / STIV (N/A) | 4.34 | 4.34 | 12.9781 | 12.9781 | |||||
| Mount Vernon Liquid Assets Portfolio, LLC / STIV (N/A) | 4.34 | 4.34 | 12.9781 | 12.9781 | |||||
| US BANK MMDA - USBFS 2 / STIV (N/A) | 1.21 | 1.21 | 3.6120 | 3.6120 | |||||
| US BANK MMDA - USBFS 2 / STIV (N/A) | 1.21 | 1.21 | 3.6120 | 3.6120 | |||||
| MSFT / Microsoft Corporation | 0.00 | 20.63 | 1.08 | 59.88 | 3.2465 | 1.1662 | |||
| NVDA / NVIDIA Corporation | 0.01 | 9.38 | 1.02 | 59.31 | 3.0490 | 1.0904 | |||
| AMZN / Amazon.com, Inc. | 0.00 | 78.25 | 0.98 | 105.89 | 2.9268 | 1.4683 | |||
| GOOGL / Alphabet Inc. | 0.01 | 286.19 | 0.95 | 342.06 | 2.8309 | 2.1721 | |||
| RBLX / Roblox Corporation | 0.01 | 0.94 | 2.8066 | 2.8066 | |||||
| AAPL / Apple Inc. | 0.00 | 19.07 | 0.88 | 9.89 | 2.6303 | 0.1806 | |||
| HEI / HEICO Corporation | 0.00 | 0.85 | 2.5353 | 2.5353 | |||||
| ZS / Zscaler, Inc. | 0.00 | -70.63 | 0.80 | -58.41 | 2.3994 | -2.2954 | |||
| HWM / Howmet Aerospace Inc. | 0.00 | -21.90 | 0.77 | 12.10 | 2.3026 | 0.1980 | |||
| INTU / Intuit Inc. | 0.00 | 0.76 | 2.2651 | 2.2651 | |||||
| CAH / Cardinal Health, Inc. | 0.00 | 0.75 | 2.2453 | 2.2453 | |||||
| VRSN / VeriSign, Inc. | 0.00 | 0.74 | 2.2211 | 2.2211 | |||||
| MELI / MercadoLibre, Inc. | 0.00 | -56.75 | 0.74 | -42.01 | 2.2056 | -1.6931 | |||
| MNST / Monster Beverage Corporation | 0.01 | -57.87 | 0.72 | -54.93 | 2.1634 | -2.7497 | |||
| COR / Cencora, Inc. | 0.00 | 34.56 | 0.70 | 66.04 | 2.1069 | 1.1481 | |||
| MCK / McKesson Corporation | 0.00 | 0.69 | 2.0745 | 2.0745 | |||||
| WRB / W. R. Berkley Corporation | 0.01 | 0.68 | 2.0467 | 2.0467 | |||||
| PM / Philip Morris International Inc. | 0.00 | 0.68 | 2.0313 | 2.0313 | |||||
| CHTR / Charter Communications, Inc. | 0.00 | 99.15 | 0.67 | 121.12 | 2.0076 | 1.0768 | |||
| UBER / Uber Technologies, Inc. | 0.01 | -77.65 | 0.65 | -66.11 | 1.9483 | -2.7350 | |||
| TW / Tradeweb Markets Inc. | 0.00 | 0.65 | 1.9413 | 1.9413 | |||||
| HIG / The Hartford Insurance Group, Inc. | 0.00 | 85.33 | 0.62 | 89.91 | 1.8603 | 0.8576 | |||
| VRT / Vertiv Holdings Co | 0.00 | 0.53 | 1.5728 | 1.5728 | |||||
| META / Meta Platforms, Inc. | 0.00 | 36.73 | 0.51 | 75.35 | 1.5130 | 0.6279 | |||
| EA / Electronic Arts Inc. | 0.00 | -70.47 | 0.46 | -67.37 | 1.3835 | -2.9588 | |||
| EMR / Emerson Electric Co. | 0.00 | -74.07 | 0.46 | -68.49 | 1.3777 | -3.0979 | |||
| CSCO / Cisco Systems, Inc. | 0.01 | 180.87 | 0.45 | 217.73 | 1.3412 | 0.9062 | |||
| EBAY / eBay Inc. | 0.01 | -74.73 | 0.45 | -72.27 | 1.3401 | -3.6010 | |||
| AMP / Ameriprise Financial, Inc. | 0.00 | -38.96 | 0.45 | -38.87 | 1.3337 | -0.5943 | |||
| NOW / ServiceNow, Inc. | 0.00 | 0.44 | 1.3075 | 1.3075 | |||||
| GILD / Gilead Sciences, Inc. | 0.00 | -45.11 | 0.43 | -45.72 | 1.2906 | -1.1433 | |||
| TKO / TKO Group Holdings, Inc. | 0.00 | 0.43 | 1.2855 | 1.2855 | |||||
| WTY / Willis Towers Watson Public Limited Company | 0.00 | -40.06 | 0.43 | -45.65 | 1.2722 | -1.1248 | |||
| ARES / Ares Management Corporation | 0.00 | 0.42 | 1.2688 | 1.2688 | |||||
| ROK / Rockwell Automation, Inc. | 0.00 | -52.06 | 0.42 | -45.35 | 1.2485 | -0.4774 | |||
| V / Visa Inc. | 0.00 | -75.08 | 0.40 | -72.01 | 1.1921 | -2.5741 | |||
| BX / Blackstone Inc. | 0.00 | -52.19 | 0.40 | -53.29 | 1.1911 | -0.9236 | |||
| ANSS / ANSYS, Inc. | 0.00 | -55.40 | 0.39 | -53.60 | 1.1772 | -1.0650 | |||
| CRM / Salesforce, Inc. | 0.00 | -63.58 | 0.39 | -70.31 | 1.1710 | -2.3158 | |||
| SPGI / S&P Global Inc. | 0.00 | -75.85 | 0.39 | -74.42 | 1.1645 | -2.8642 | |||
| VRSK / Verisk Analytics, Inc. | 0.00 | -40.65 | 0.38 | -37.93 | 1.1475 | -0.7445 | |||
| KLAC / KLA Corporation | 0.00 | 0.36 | 1.0749 | 1.0749 | |||||
| TDG / TransDigm Group Incorporated | 0.00 | -80.69 | 0.33 | -78.76 | 0.9966 | -3.8115 | |||
| ICE / Intercontinental Exchange, Inc. | 0.00 | 0.33 | 0.9844 | 0.9844 | |||||
| SCHW / The Charles Schwab Corporation | 0.00 | -75.03 | 0.32 | -64.85 | 0.9674 | -1.3139 | |||
| RMD / ResMed Inc. | 0.00 | -3.71 | 0.32 | 11.07 | 0.9628 | 0.0743 | |||
| WAB / Westinghouse Air Brake Technologies Corporation | 0.00 | 0.32 | 0.9560 | 0.9560 | |||||
| CTAS / Cintas Corporation | 0.00 | 0.32 | 0.9457 | 0.9457 | |||||
| RSG / Republic Services, Inc. | 0.00 | 0.31 | 0.9254 | 0.9254 | |||||
| ALL / The Allstate Corporation | 0.00 | 19.92 | 0.30 | 16.60 | 0.9067 | 0.1101 | |||
| NEE / NextEra Energy, Inc. | 0.00 | 0.30 | 0.8854 | 0.8854 | |||||
| PGR / The Progressive Corporation | 0.00 | -80.23 | 0.29 | -81.40 | 0.8761 | -3.9366 | |||
| EFX / Equifax Inc. | 0.00 | -56.52 | 0.29 | -61.63 | 0.8747 | -1.0151 | |||
| WDAY / Workday, Inc. | 0.00 | 0.28 | 0.8302 | 0.8302 | |||||
| COIN / Coinbase Global, Inc. | 0.00 | 0.25 | 0.7562 | 0.7562 | |||||
| NRG / NRG Energy, Inc. | 0.00 | 0.25 | 0.7468 | 0.7468 | |||||
| VST / Vistra Corp. | 0.00 | 0.23 | 0.7012 | 0.7012 | |||||
| PH / Parker-Hannifin Corporation | 0.00 | -54.91 | 0.20 | -50.26 | 0.5853 | -0.3882 | |||
| FI / Fiserv, Inc. | 0.00 | 0.19 | 0.5804 | 0.5804 | |||||
| 2IS / Trane Technologies plc | 0.00 | -50.78 | 0.19 | -44.83 | 0.5773 | -0.2869 | |||
| BKR / Baker Hughes Company | 0.01 | 0.19 | 0.5761 | 0.5761 | |||||
| BR / Broadridge Financial Solutions, Inc. | 0.00 | -78.90 | 0.19 | -77.35 | 0.5702 | -1.6531 | |||
| ABBV / AbbVie Inc. | 0.00 | -75.16 | 0.19 | -76.66 | 0.5688 | -1.4509 | |||
| AME / AMETEK, Inc. | 0.00 | 0.19 | 0.5664 | 0.5664 | |||||
| ROL / Rollins, Inc. | 0.00 | 0.19 | 0.5597 | 0.5597 | |||||
| TMUS / T-Mobile US, Inc. | 0.00 | 28.55 | 0.19 | 14.91 | 0.5554 | 0.0600 | |||
| SHW / The Sherwin-Williams Company | 0.00 | -38.20 | 0.18 | -39.18 | 0.5302 | -0.3635 |