Mga Batayang Estadistika
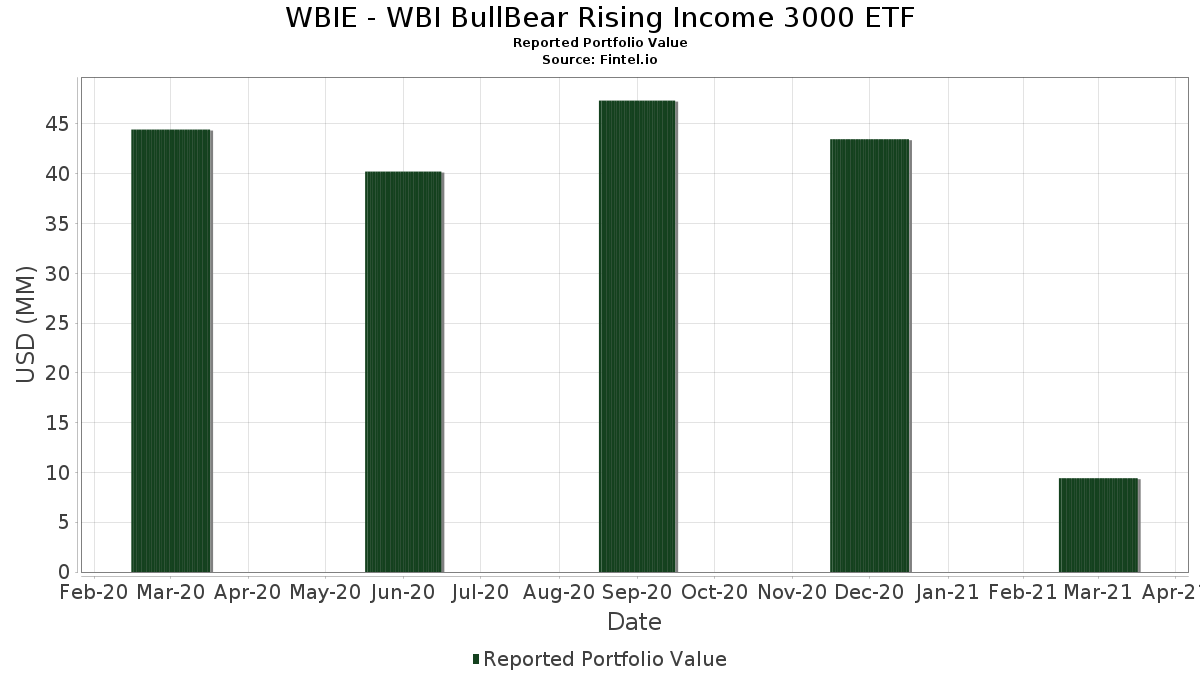
| Nilai Portofolio | $ 9,421,131 |
| Posisi Saat Ini | 35 |
Kepemilikan Terbaru, Kinerja, AUM (dari 13F, 13D)
WBIE - WBI BullBear Rising Income 3000 ETF telah mengungkapkan total kepemilikan 35 dalam pengajuan SEC terbaru mereka. Nilai portofolio terbaru dihitung sebesar $ 9,421,131 USD. Aset yang Dikelola (AUM) sebenarnya adalah nilai ini ditambah kas (yang tidak diungkapkan). Aset-aset utama WBIE - WBI BullBear Rising Income 3000 ETF adalah Applied Materials, Inc. (US:AMAT) , Valmont Industries, Inc. (US:VMI) , PulteGroup, Inc. (US:PHM) , Broadridge Financial Solutions, Inc. (US:BR) , and Newmont Corporation (US:NEM) . Posisi baru WBIE - WBI BullBear Rising Income 3000 ETF meliputi: Valmont Industries, Inc. (US:VMI) , A. O. Smith Corporation (US:AOS) , Amdocs Limited (US:DOX) , AbbVie Inc. (US:ABBV) , and CDW Corporation (US:CDW) .
Peningkatan Tertinggi Kuartal Ini
Kami menggunakan perubahan dalam alokasi portofolio karena ini adalah metrik yang paling bermakna. Perubahan dapat disebabkan oleh perdagangan atau perubahan harga saham.
| Keamanan | Saham (MM) |
Nilai (Juta Dolar AS) |
Portfolio % | ΔPorsyento ng Portfolio |
|---|---|---|---|---|
| 0.73 | 0.73 | 8.4338 | 8.4338 | |
| 0.00 | 0.48 | 5.4924 | 5.4924 | |
| 0.01 | 0.34 | 3.9523 | 3.9523 | |
| 0.00 | 0.34 | 3.9338 | 3.9338 | |
| 0.00 | 0.34 | 3.9088 | 3.9088 | |
| 0.00 | 0.34 | 3.8952 | 3.8952 | |
| 0.00 | 0.32 | 3.6527 | 3.6527 | |
| 0.00 | 0.32 | 3.6523 | 3.6523 | |
| 0.01 | 0.32 | 3.6261 | 3.6261 | |
| 0.00 | 0.50 | 5.7383 | 3.6214 |
Penurunan Tertinggi Kuartal Ini
Kami menggunakan perubahan dalam alokasi portofolio karena ini adalah metrik yang paling bermakna. Perubahan dapat disebabkan oleh perdagangan atau perubahan harga saham.
| Keamanan | Saham (MM) |
Nilai (Juta Dolar AS) |
Portfolio % | ΔPorsyento ng Portfolio |
|---|---|---|---|---|
| 0.00 | 0.00 | -5.0172 | ||
| 0.00 | 0.00 | -4.3879 | ||
| 0.00 | 0.00 | -4.3856 | ||
| 0.00 | 0.00 | -4.1917 | ||
| 0.00 | 0.00 | -4.1844 | ||
| 0.00 | 0.00 | -4.1386 | ||
| 0.00 | 0.00 | -3.9332 | ||
| 0.00 | 0.00 | -3.8435 | ||
| 0.00 | 0.00 | -3.6888 | ||
| 0.00 | 0.00 | -3.4634 |
Pengajuan 13F dan Dana
Formulir ini diajukan pada 2021-05-17 untuk periode pelaporan 2021-03-31. Klik ikon tautan untuk melihat riwayat transaksi selengkapnya.
Tingkatkan ke versi premium untuk membuka data premium dan ekspor ke Excel. ![]() .
.
| Keamanan | Ketik | Harga Saham Rata-rata | Saham (MM) |
ΔSaham (%) |
ΔSaham (%) |
Nilai ($MM) |
Portpolyo (%) |
ΔPortofolio (%) |
|
|---|---|---|---|---|---|---|---|---|---|
| Mount Vernon Liquid Assets Portfolio, LLC / STIV (N/A) | 0.73 | -98.12 | 0.73 | -98.12 | 8.4338 | 8.4338 | |||
| AMAT / Applied Materials, Inc. | 0.00 | -74.25 | 0.50 | -42.23 | 5.7383 | 3.6214 | |||
| VMI / Valmont Industries, Inc. | 0.00 | 0.48 | 5.4924 | 5.4924 | |||||
| PHM / PulteGroup, Inc. | 0.01 | -78.93 | 0.39 | -76.13 | 4.5102 | 0.4768 | |||
| BR / Broadridge Financial Solutions, Inc. | 0.00 | -76.52 | 0.38 | -76.59 | 4.3692 | 0.1271 | |||
| NEM / Newmont Corporation | 0.01 | -64.21 | 0.35 | -64.02 | 4.0231 | 1.4789 | |||
| AOS / A. O. Smith Corporation | 0.01 | 0.34 | 3.9523 | 3.9523 | |||||
| DOX / Amdocs Limited | 0.00 | 0.34 | 3.9338 | 3.9338 | |||||
| ABBV / AbbVie Inc. | 0.00 | 0.34 | 3.9088 | 3.9088 | |||||
| CDW / CDW Corporation | 0.00 | 0.34 | 3.8952 | 3.8952 | |||||
| TXN / Texas Instruments Incorporated | 0.00 | -53.59 | 0.32 | -38.64 | 3.7348 | 2.4367 | |||
| JPM / JPMorgan Chase & Co. | 0.00 | 0.32 | 3.6527 | 3.6527 | |||||
| GS / The Goldman Sachs Group, Inc. | 0.00 | 0.32 | 3.6523 | 3.6523 | |||||
| SCI / Service Corporation International | 0.01 | 0.32 | 3.6261 | 3.6261 | |||||
| MSFT / Microsoft Corporation | 0.00 | -62.14 | 0.29 | -59.97 | 3.3575 | 1.4518 | |||
| PGR / The Progressive Corporation | 0.00 | 0.28 | 3.2279 | 3.2279 | |||||
| PAYX / Paychex, Inc. | 0.00 | 0.26 | 3.0251 | 3.0251 | |||||
| PH / Parker-Hannifin Corporation | 0.00 | 0.23 | 2.6741 | 2.6741 | |||||
| CMI / Cummins Inc. | 0.00 | 0.22 | 2.4917 | 2.4917 | |||||
| XOM / Exxon Mobil Corporation | 0.00 | 0.21 | 2.4667 | 2.4667 | |||||
| GILD / Gilead Sciences, Inc. | 0.00 | 0.21 | 2.4422 | 2.4422 | |||||
| PFG / Principal Financial Group, Inc. | 0.00 | 0.21 | 2.4278 | 2.4278 | |||||
| RS / Reliance, Inc. | 0.00 | 0.21 | 2.3912 | 2.3912 | |||||
| FAST / Fastenal Company | 0.00 | 0.20 | 2.3482 | 2.3482 | |||||
| IRM / Iron Mountain Incorporated | 0.01 | -80.76 | 0.19 | -75.89 | 2.1788 | 0.1241 | |||
| STLD / Steel Dynamics, Inc. | 0.00 | 0.18 | 2.1172 | 2.1172 | |||||
| SHOP / Shopify Inc. | 0.00 | -79.85 | 0.18 | -80.31 | 2.0492 | -0.3206 | |||
| US BANK MMDA - USBFS 2 / STIV (N/A) | 0.18 | -99.55 | 0.18 | -99.55 | 2.0245 | 2.0245 | |||
| TROW / T. Rowe Price Group, Inc. | 0.00 | 0.17 | 1.9423 | 1.9423 | |||||
| STZ / Constellation Brands, Inc. | 0.00 | 0.17 | 1.9276 | 1.9276 | |||||
| EMR / Emerson Electric Co. | 0.00 | 0.14 | 1.6252 | 1.6252 | |||||
| FAF / First American Financial Corporation | 0.00 | 0.14 | 1.5613 | 1.5613 | |||||
| FANG / Diamondback Energy, Inc. | 0.00 | 0.12 | 1.4244 | 1.4244 | |||||
| KR / The Kroger Co. | 0.00 | 0.09 | 1.0660 | 1.0660 | |||||
| MMM / 3M Company | 0.00 | 0.06 | 0.6782 | 0.6782 | |||||
| UPS / United Parcel Service, Inc. | 0.00 | -100.00 | 0.00 | -100.00 | -3.9332 | ||||
| FBHS / Fortune Brands Home & Security Inc | 0.00 | -100.00 | 0.00 | -100.00 | -2.4044 | ||||
| AZN / AstraZeneca PLC - Depositary Receipt (Common Stock) | 0.00 | -100.00 | 0.00 | -100.00 | -3.8435 | ||||
| PNC / The PNC Financial Services Group, Inc. | 0.00 | -100.00 | 0.00 | -100.00 | -5.0172 | ||||
| MAS / Masco Corporation | 0.00 | -100.00 | 0.00 | -100.00 | -4.1917 | ||||
| JNJ / Johnson & Johnson | 0.00 | -100.00 | 0.00 | -100.00 | -1.0631 | ||||
| AAPL / Apple Inc. | 0.00 | -100.00 | 0.00 | -100.00 | -2.1375 | ||||
| NVAX / Novavax, Inc. | 0.00 | -100.00 | 0.00 | -100.00 | -3.6888 | ||||
| IOVA / Iovance Biotherapeutics, Inc. | 0.00 | -100.00 | 0.00 | -100.00 | -0.9954 | ||||
| SHW / The Sherwin-Williams Company | 0.00 | -100.00 | 0.00 | -100.00 | -4.1844 | ||||
| PFE / Pfizer Inc. | 0.00 | -100.00 | 0.00 | -100.00 | -2.8794 | ||||
| CRSP / CRISPR Therapeutics AG | 0.00 | -100.00 | 0.00 | -100.00 | -2.3862 | ||||
| YUM / Yum! Brands, Inc. | 0.00 | -100.00 | 0.00 | -100.00 | -4.3856 | ||||
| C / Citigroup Inc. | 0.00 | -100.00 | 0.00 | -100.00 | -2.7879 | ||||
| HII / Huntington Ingalls Industries, Inc. | 0.00 | -100.00 | 0.00 | -100.00 | -4.3879 | ||||
| TJX / The TJX Companies, Inc. | 0.00 | -100.00 | 0.00 | -100.00 | -2.0046 | ||||
| LEN / Lennar Corporation | 0.00 | -100.00 | 0.00 | -100.00 | -4.1386 | ||||
| LOW / Lowe's Companies, Inc. | 0.00 | -100.00 | 0.00 | -100.00 | -3.4634 | ||||
| AAP / Advance Auto Parts, Inc. | 0.00 | -100.00 | 0.00 | -100.00 | -1.4742 |