Mga Batayang Estadistika
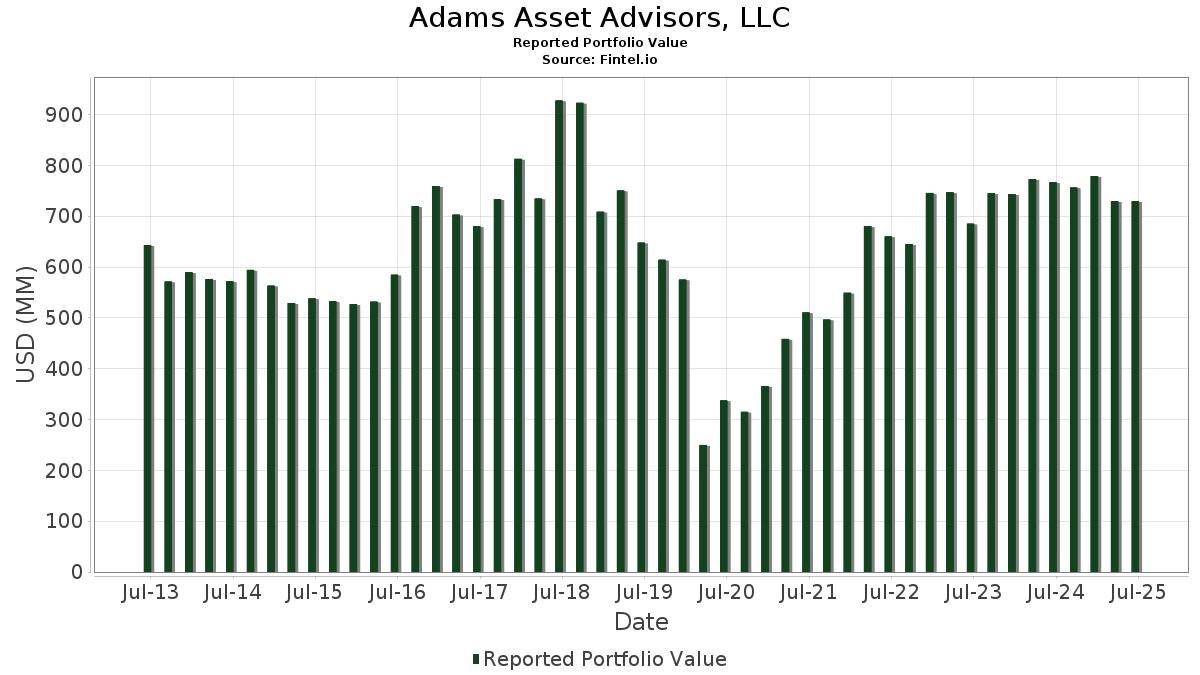
| Nilai Portofolio | $ 710,732,017 |
| Posisi Saat Ini | 80 |
Kepemilikan Terbaru, Kinerja, AUM (dari 13F, 13D)
Adams Asset Advisors, LLC telah mengungkapkan total kepemilikan 80 dalam pengajuan SEC terbaru mereka. Nilai portofolio terbaru dihitung sebesar $ 710,732,017 USD. Aset yang Dikelola (AUM) sebenarnya adalah nilai ini ditambah kas (yang tidak diungkapkan). Aset-aset utama Adams Asset Advisors, LLC adalah Occidental Petroleum Corporation (US:OXY) , Calumet, Inc. (US:CLMT) , Sunoco LP - Limited Partnership (US:SUN) , Energy Transfer LP - Limited Partnership (US:ET) , and Apple Inc. (US:AAPL) . Posisi baru Adams Asset Advisors, LLC meliputi: Schwab Strategic Trust - Schwab U.S. Dividend Equity ETF (US:SCHD) , Schwab Strategic Trust - Schwab U.S. Large-Cap Growth ETF (US:SCHG) , VanEck ETF Trust - VanEck BDC Income ETF (US:BIZD) , Global X Funds - Global X U.S. Preferred ETF (US:PFFD) , and . Industri unggulan Adams Asset Advisors, LLC adalah "Printing, Publishing, And Allied Industries" (sic 27) , "Primary Metal Industries" (sic 33) , and "Miscellaneous Retail " (sic 59) .
Peningkatan Tertinggi Kuartal Ini
Kami menggunakan perubahan dalam alokasi portofolio karena ini adalah metrik yang paling bermakna. Perubahan dapat disebabkan oleh perdagangan atau perubahan harga saham.
| Keamanan | Saham (MM) |
Nilai (Juta Dolar AS) |
Portfolio % | ΔPorsyento ng Portfolio |
|---|---|---|---|---|
| 5.41 | 85.18 | 11.9842 | 2.6738 | |
| 0.23 | 6.14 | 0.8642 | 0.8642 | |
| 0.01 | 10.59 | 1.4904 | 0.3837 | |
| 0.22 | 12.72 | 1.7891 | 0.3352 | |
| 0.05 | 1.36 | 0.1914 | 0.1914 | |
| 0.08 | 1.24 | 0.1750 | 0.1750 | |
| 0.01 | 7.08 | 0.9964 | 0.1635 | |
| 0.15 | 12.98 | 1.8256 | 0.1591 | |
| 0.24 | 10.06 | 1.4156 | 0.1561 | |
| 0.25 | 11.80 | 1.6604 | 0.1480 |
Penurunan Tertinggi Kuartal Ini
Kami menggunakan perubahan dalam alokasi portofolio karena ini adalah metrik yang paling bermakna. Perubahan dapat disebabkan oleh perdagangan atau perubahan harga saham.
| Keamanan | Saham (MM) |
Nilai (Juta Dolar AS) |
Portfolio % | ΔPorsyento ng Portfolio |
|---|---|---|---|---|
| 3.53 | 148.41 | 20.8814 | -3.0228 | |
| 0.12 | 5.76 | 0.8107 | -0.4248 | |
| 0.47 | 9.70 | 1.3646 | -0.4117 | |
| 0.07 | 9.88 | 1.3897 | -0.3926 | |
| 0.06 | 11.77 | 1.6566 | -0.3699 | |
| 0.09 | 17.54 | 2.4672 | -0.3418 | |
| 0.04 | 10.10 | 1.4214 | -0.2785 | |
| 0.24 | 13.97 | 1.9662 | -0.2755 | |
| 0.30 | 7.69 | 1.0821 | -0.2724 | |
| 0.19 | 3.96 | 0.5577 | -0.2400 |
Pengajuan 13D/G
Ini adalah daftar pengajuan 13D dan 13G yang dibuat dalam setahun terakhir (jika ada). Klik ikon tautan untuk melihat riwayat transaksi lengkap. Baris berwarna hijau menunjukkan posisi baru. Baris berwarna merah menunjukkan posisi yang sudah ditutup.
| Tanggal File | Formulir | Keamanan | Sebelumnya Saham |
Saat ini Saham |
ΔPersentase Saham | % Kepemilikan |
% ΔKepemilikan | |
|---|---|---|---|---|---|---|---|---|
| 2025-02-13 | CLMT / Calumet, Inc. | 5,446,477 | 5,251,160 | -3.59 | 6.10 | -10.43 |
Pengajuan 13F dan Dana
Formulir ini diajukan pada 2025-07-08 untuk periode pelaporan 2025-06-30. Klik ikon tautan untuk melihat riwayat transaksi selengkapnya.
Tingkatkan ke versi premium untuk membuka data premium dan ekspor ke Excel. ![]() .
.
| Keamanan | Ketik | Harga Saham Rata-rata | Saham (MM) |
ΔSaham (%) |
ΔSaham (%) |
Nilai ($MM) |
Portpolyo (%) |
ΔPortofolio (%) |
|
|---|---|---|---|---|---|---|---|---|---|
| OXY / Occidental Petroleum Corporation | 3.53 | 0.00 | 148.41 | -14.89 | 20.8814 | -3.0228 | |||
| CLMT / Calumet, Inc. | 5.41 | 0.93 | 85.18 | 25.41 | 11.9842 | 2.6738 | |||
| SUN / Sunoco LP - Limited Partnership | 0.57 | 0.40 | 30.63 | -7.33 | 4.3095 | -0.2214 | |||
| ET / Energy Transfer LP - Limited Partnership | 1.42 | 0.56 | 25.81 | -1.93 | 3.6317 | 0.0238 | |||
| AAPL / Apple Inc. | 0.09 | -7.35 | 17.54 | -14.43 | 2.4672 | -0.3418 | |||
| DMLP / Dorchester Minerals, L.P. - Limited Partnership | 0.62 | 10.29 | 17.19 | 2.15 | 2.4190 | 0.1119 | |||
| BTI / British American Tobacco p.l.c. - Depositary Receipt (Common Stock) | 0.35 | -10.11 | 16.40 | 2.85 | 2.3078 | 0.1215 | |||
| PAA / Plains All American Pipeline, L.P. - Limited Partnership | 0.79 | 3.24 | 14.43 | -5.43 | 2.0310 | -0.0614 | |||
| MO / Altria Group, Inc. | 0.24 | -12.52 | 13.97 | -14.54 | 1.9662 | -0.2755 | |||
| C / Citigroup Inc. | 0.15 | -10.98 | 12.98 | 6.74 | 1.8256 | 0.1591 | |||
| WFC / Wells Fargo & Company | 0.16 | -8.19 | 12.94 | 2.46 | 1.8203 | 0.0894 | |||
| NEM / Newmont Corporation | 0.22 | -0.64 | 12.72 | 19.90 | 1.7891 | 0.3352 | |||
| WES / Western Midstream Partners, LP - Limited Partnership | 0.33 | 1.03 | 12.66 | -4.55 | 1.7811 | -0.0369 | |||
| T / AT&T Inc. | 0.44 | 1.15 | 12.65 | 3.51 | 1.7804 | 0.1046 | |||
| BAC / Bank of America Corporation | 0.25 | -5.67 | 11.80 | 6.96 | 1.6604 | 0.1480 | |||
| ABBV / AbbVie Inc. | 0.06 | -10.10 | 11.77 | -20.36 | 1.6566 | -0.3699 | |||
| CSCO / Cisco Systems, Inc. | 0.16 | -11.11 | 10.98 | -0.06 | 1.5442 | 0.0387 | |||
| MPLX / MPLX LP - Limited Partnership | 0.21 | 7.06 | 10.80 | 3.04 | 1.5190 | 0.0828 | |||
| GSCE / GS Connect S&P GSCI Enhanced Commodity Total Return ETN | 0.01 | 1.28 | 10.59 | 31.20 | 1.4904 | 0.3837 | |||
| VZ / Verizon Communications Inc. | 0.24 | -8.57 | 10.18 | -12.78 | 1.4318 | -0.1677 | |||
| AMGN / Amgen Inc. | 0.04 | -9.10 | 10.10 | -18.53 | 1.4214 | -0.2785 | |||
| DINO / HF Sinclair Corporation | 0.24 | -12.36 | 10.06 | 9.50 | 1.4156 | 0.1561 | |||
| CVX / Chevron Corporation | 0.07 | -11.24 | 9.88 | -24.04 | 1.3897 | -0.3926 | |||
| OXY.WS / Occidental Petroleum Corporation - Equity Warrant | 0.47 | 0.00 | 9.70 | -25.16 | 1.3646 | -0.4117 | |||
| CMI / Cummins Inc. | 0.03 | 2.95 | 9.68 | 7.57 | 1.3617 | 0.1283 | |||
| KMB / Kimberly-Clark Corporation | 0.07 | 2.31 | 9.17 | -7.25 | 1.2901 | -0.0652 | |||
| VLO / Valero Energy Corporation | 0.07 | -7.05 | 8.87 | -5.40 | 1.2475 | -0.0372 | |||
| ARLP / Alliance Resource Partners, L.P. - Limited Partnership | 0.33 | 1.45 | 8.75 | -2.80 | 1.2315 | -0.0028 | |||
| UVV / Universal Corporation | 0.15 | -1.12 | 8.70 | 2.75 | 1.2244 | 0.0634 | |||
| EPD / Enterprise Products Partners L.P. - Limited Partnership | 0.25 | 1.64 | 7.70 | -7.68 | 1.0831 | -0.0599 | |||
| KHC / The Kraft Heinz Company | 0.30 | -8.27 | 7.69 | -22.17 | 1.0821 | -0.2724 | |||
| PFE / Pfizer Inc. | 0.30 | -14.95 | 7.17 | -18.65 | 1.0093 | -0.1994 | |||
| MSFT / Microsoft Corporation | 0.01 | -12.04 | 7.08 | 16.54 | 0.9964 | 0.1635 | |||
| SCHD / Schwab Strategic Trust - Schwab U.S. Dividend Equity ETF | 0.23 | 6.14 | 0.8642 | 0.8642 | |||||
| HPQ / HP Inc. | 0.24 | 3.67 | 5.82 | -8.42 | 0.8184 | -0.0523 | |||
| BMY / Bristol-Myers Squibb Company | 0.12 | -15.76 | 5.76 | -36.07 | 0.8107 | -0.4248 | |||
| UPS / United Parcel Service, Inc. | 0.05 | 26.27 | 5.20 | 15.88 | 0.7311 | 0.1164 | |||
| WPC / W. P. Carey Inc. | 0.07 | 19.55 | 4.49 | 18.16 | 0.6317 | 0.1109 | |||
| KMI / Kinder Morgan, Inc. | 0.14 | -0.69 | 4.02 | 2.34 | 0.5654 | 0.0271 | |||
| CAG / Conagra Brands, Inc. | 0.19 | -11.25 | 3.96 | -31.88 | 0.5577 | -0.2400 | |||
| PEP / PepsiCo, Inc. | 0.03 | -16.62 | 3.77 | -26.57 | 0.5305 | -0.1734 | |||
| GSBD / Goldman Sachs BDC, Inc. | 0.33 | 21.29 | 3.67 | 17.36 | 0.5157 | 0.0875 | |||
| WTTR / Select Water Solutions, Inc. | 0.41 | 0.00 | 3.54 | -17.71 | 0.4974 | -0.0915 | |||
| DKL / Delek Logistics Partners, LP - Limited Partnership | 0.07 | 4.45 | 3.02 | 3.68 | 0.4248 | 0.0257 | |||
| FSK / FS KKR Capital Corp. | 0.14 | 7.55 | 2.96 | 6.52 | 0.4164 | 0.0355 | |||
| SUI / Sun Communities, Inc. | 0.02 | 0.00 | 2.82 | -1.68 | 0.3963 | 0.0036 | |||
| O / Realty Income Corporation | 0.04 | 58.74 | 2.44 | 57.70 | 0.3431 | 0.1310 | |||
| RLJ.PRA / RLJ Lodging Trust - Preferred Stock | 0.10 | 14.87 | 2.32 | 11.39 | 0.3261 | 0.0409 | |||
| WMB / The Williams Companies, Inc. | 0.03 | 0.00 | 2.19 | 5.13 | 0.3083 | 0.0225 | |||
| EBGEF / Enbridge Inc. - Preferred Stock | 0.05 | -3.52 | 2.10 | -1.36 | 0.2962 | 0.0037 | |||
| GBDC / Golub Capital BDC, Inc. | 0.14 | 71.75 | 2.02 | 66.14 | 0.2839 | 0.1175 | |||
| NNN / NNN REIT, Inc. | 0.04 | 119.04 | 1.76 | 121.94 | 0.2477 | 0.1389 | |||
| MSDL / Morgan Stanley Direct Lending Fund | 0.09 | 43.69 | 1.69 | 34.77 | 0.2384 | 0.0661 | |||
| STWD / Starwood Property Trust, Inc. | 0.08 | 0.00 | 1.68 | 1.51 | 0.2363 | 0.0095 | |||
| BXSL / Blackstone Secured Lending Fund | 0.05 | 0.00 | 1.55 | -4.97 | 0.2178 | -0.0055 | |||
| OKE / ONEOK, Inc. | 0.02 | 0.00 | 1.55 | -17.72 | 0.2175 | -0.0401 | |||
| AHH / Armada Hoffler Properties, Inc. | 0.22 | 0.00 | 1.51 | -8.52 | 0.2129 | -0.0139 | |||
| NCDL / Nuveen Churchill Direct Lending Corp. | 0.09 | 9.41 | 1.46 | 4.29 | 0.2054 | 0.0136 | |||
| OBDC / Blue Owl Capital Corporation | 0.10 | 44.39 | 1.44 | 41.32 | 0.2026 | 0.0629 | |||
| SCHG / Schwab Strategic Trust - Schwab U.S. Large-Cap Growth ETF | 0.05 | 1.36 | 0.1914 | 0.1914 | |||||
| BTU / Peabody Energy Corporation | 0.10 | 0.00 | 1.34 | -0.96 | 0.1888 | 0.0031 | |||
| MLPA / Global X Funds - Global X MLP ETF | 0.03 | 293.62 | 1.30 | 271.23 | 0.1835 | 0.1353 | |||
| PLYM / Plymouth Industrial REIT, Inc. | 0.08 | 0.00 | 1.25 | -1.50 | 0.1756 | 0.0020 | |||
| BIZD / VanEck ETF Trust - VanEck BDC Income ETF | 0.08 | 1.24 | 0.1750 | 0.1750 | |||||
| LQD / iShares Trust - iShares iBoxx $ Investment Grade Corporate Bond ETF | 0.01 | 246.24 | 1.23 | 250.00 | 0.1724 | 0.1243 | |||
| WY / Weyerhaeuser Company | 0.05 | -7.82 | 1.20 | -19.13 | 0.1684 | -0.0345 | |||
| MPW / Medical Properties Trust, Inc. | 0.27 | 0.00 | 1.17 | -28.56 | 0.1645 | -0.0597 | |||
| GOOGL / Alphabet Inc. | 0.01 | 3.06 | 1.10 | 17.47 | 0.1552 | 0.0265 | |||
| XOM / Exxon Mobil Corporation | 0.01 | 17.04 | 1.08 | 6.08 | 0.1523 | 0.0124 | |||
| PFFD / Global X Funds - Global X U.S. Preferred ETF | 0.05 | 0.94 | 0.1320 | 0.1320 | |||||
| SPG / Simon Property Group, Inc. | 0.01 | 0.00 | 0.93 | -3.23 | 0.1309 | -0.0009 | |||
| GJR / Strats Trust For Procter & Gambel Security - Preferred Security | 0.00 | 0.00 | 0.58 | -6.45 | 0.0816 | -0.0034 | |||
| TRINITY PETROLEUM TR / (896556107) | 0.01 | 0.54 | 0.0000 | ||||||
| GLP / Global Partners LP - Limited Partnership | 0.01 | 0.00 | 0.52 | -1.33 | 0.0732 | 0.0010 | |||
| PAGP / Plains GP Holdings, L.P. - Limited Partnership | 0.02 | 31.62 | 0.41 | 19.76 | 0.0572 | 0.0106 | |||
| BRK.A / Berkshire Hathaway Inc. | 0.00 | 0.00 | 0.36 | -8.84 | 0.0509 | -0.0035 | |||
| JNJ / Johnson & Johnson | 0.00 | -59.27 | 0.36 | -62.51 | 0.0504 | -0.0806 | |||
| FFIN / First Financial Bankshares, Inc. | 0.01 | 0.00 | 0.32 | 0.32 | 0.0443 | 0.0012 | |||
| NXDT / NexPoint Diversified Real Estate Trust | 0.06 | 0.00 | 0.24 | 9.30 | 0.0332 | 0.0036 | |||
| SLV / iShares Silver Trust | 0.01 | 0.00 | 0.23 | 6.02 | 0.0323 | 0.0026 |