Mga Batayang Estadistika
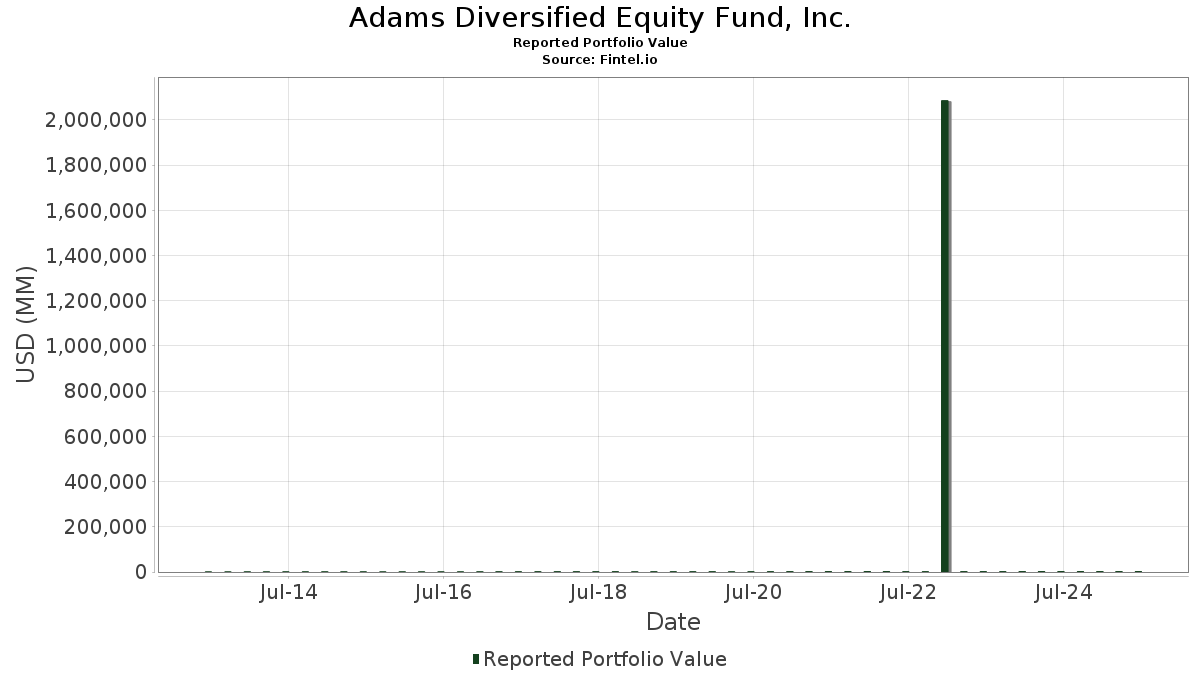
| Nilai Portofolio | $ 2,805,764,119 |
| Posisi Saat Ini | 100 |
Kepemilikan Terbaru, Kinerja, AUM (dari 13F, 13D)
Adams Diversified Equity Fund, Inc. telah mengungkapkan total kepemilikan 100 dalam pengajuan SEC terbaru mereka. Nilai portofolio terbaru dihitung sebesar $ 2,805,764,119 USD. Aset yang Dikelola (AUM) sebenarnya adalah nilai ini ditambah kas (yang tidak diungkapkan). Aset-aset utama Adams Diversified Equity Fund, Inc. adalah Microsoft Corporation (US:MSFT) , NVIDIA Corporation (US:NVDA) , Apple Inc. (US:AAPL) , Amazon.com, Inc. (US:AMZN) , and Alphabet Inc. (US:GOOGL) . Posisi baru Adams Diversified Equity Fund, Inc. meliputi: American Financial Group, Inc. (US:AFA) , .
Peningkatan Tertinggi Kuartal Ini
Kami menggunakan perubahan dalam alokasi portofolio karena ini adalah metrik yang paling bermakna. Perubahan dapat disebabkan oleh perdagangan atau perubahan harga saham.
| Keamanan | Saham (MM) |
Nilai (Juta Dolar AS) |
Portfolio % | ΔPorsyento ng Portfolio |
|---|
Penurunan Tertinggi Kuartal Ini
Kami menggunakan perubahan dalam alokasi portofolio karena ini adalah metrik yang paling bermakna. Perubahan dapat disebabkan oleh perdagangan atau perubahan harga saham.
| Keamanan | Saham (MM) |
Nilai (Juta Dolar AS) |
Portfolio % | ΔPorsyento ng Portfolio |
|---|---|---|---|---|
| 0.43 | 216.07 | 0.0770 | -7.6686 | |
| 1.33 | 209.81 | 0.0748 | -7.4463 | |
| 0.83 | 170.50 | 0.0608 | -6.0510 | |
| 0.52 | 114.68 | 0.0409 | -4.0699 | |
| 0.54 | 95.25 | 0.0340 | -3.3806 | |
| 0.13 | 92.63 | 0.0330 | -3.2875 | |
| 0.27 | 73.65 | 0.0263 | -2.6140 | |
| 0.24 | 69.02 | 0.0246 | -2.4495 | |
| 2.46 | 52.49 | 0.0187 | -1.8629 | |
| 0.03 | 46.63 | 0.0166 | -1.6550 |
Pengajuan 13F dan Dana
Formulir ini diajukan pada 2025-08-26 untuk periode pelaporan 2025-06-30. Klik ikon tautan untuk melihat riwayat transaksi selengkapnya.
Tingkatkan ke versi premium untuk membuka data premium dan ekspor ke Excel. ![]() .
.
| Keamanan | Ketik | Harga Saham Rata-rata | Saham (MM) |
ΔSaham (%) |
ΔSaham (%) |
Nilai ($MM) |
Portpolyo (%) |
ΔPortofolio (%) |
|
|---|---|---|---|---|---|---|---|---|---|
| MSFT / Microsoft Corporation | 0.43 | 0.00 | 216.07 | 0.00 | 0.0770 | -7.6686 | |||
| NVDA / NVIDIA Corporation | 1.33 | 0.00 | 209.81 | 0.00 | 0.0748 | -7.4463 | |||
| AAPL / Apple Inc. | 0.83 | 0.00 | 170.50 | 0.00 | 0.0608 | -6.0510 | |||
| AMZN / Amazon.com, Inc. | 0.52 | 0.00 | 114.68 | 0.00 | 0.0409 | -4.0699 | |||
| GOOGL / Alphabet Inc. | 0.54 | 0.00 | 95.25 | 0.00 | 0.0340 | -3.3806 | |||
| META / Meta Platforms, Inc. | 0.13 | 0.00 | 92.63 | 0.00 | 0.0330 | -3.2875 | |||
| AVGO / Broadcom Inc. | 0.27 | 0.00 | 73.65 | 0.00 | 0.0263 | -2.6140 | |||
| JPM / JPMorgan Chase & Co. | 0.24 | 0.00 | 69.02 | 0.00 | 0.0246 | -2.4495 | |||
| PEO / Adams Natural Resources Fund, Inc. | 2.46 | 0.00 | 52.49 | 0.00 | 0.0187 | -1.8629 | |||
| NFLX / Netflix, Inc. | 0.03 | 0.00 | 46.63 | 0.00 | 0.0166 | -1.6550 | |||
| BRK.B / Berkshire Hathaway Inc. | 0.10 | 0.00 | 46.36 | 0.00 | 0.0165 | -1.6455 | |||
| BAC / Bank of America Corporation | 0.93 | 0.00 | 44.05 | 0.00 | 0.0157 | -1.5633 | |||
| V / Visa Inc. | 0.12 | 0.00 | 41.49 | 0.00 | 0.0148 | -1.4726 | |||
| GE / General Electric Company | 0.16 | 0.00 | 41.36 | 0.00 | 0.0147 | -1.4680 | |||
| TSLA / Tesla, Inc. | 0.12 | 0.00 | 38.69 | 0.00 | 0.0138 | -1.3732 | |||
| IBM / International Business Machines Corporation | 0.13 | 0.00 | 38.23 | 0.00 | 0.0136 | -1.3569 | |||
| GS / The Goldman Sachs Group, Inc. | 0.05 | 0.00 | 35.25 | 0.00 | 0.0126 | -1.2509 | |||
| ABBV / AbbVie Inc. | 0.19 | 0.00 | 34.84 | 0.00 | 0.0124 | -1.2365 | |||
| WMT / Walmart Inc. | 0.35 | 0.00 | 34.54 | 0.00 | 0.0123 | -1.2259 | |||
| PM / Philip Morris International Inc. | 0.19 | 0.00 | 34.30 | 0.00 | 0.0122 | -1.2174 | |||
| COF / Capital One Financial Corporation | 0.16 | 0.00 | 33.55 | 0.00 | 0.0120 | -1.1906 | |||
| LLY / Eli Lilly and Company | 0.04 | 0.00 | 32.72 | 0.00 | 0.0117 | -1.1611 | |||
| BKNG / Booking Holdings Inc. | 0.01 | 0.00 | 32.42 | 0.00 | 0.0116 | -1.1506 | |||
| MA / Mastercard Incorporated | 0.06 | 0.00 | 31.00 | 0.00 | 0.0111 | -1.1001 | |||
| UBER / Uber Technologies, Inc. | 0.31 | 0.00 | 28.86 | 0.00 | 0.0103 | -1.0242 | |||
| LRCX / Lam Research Corporation | 0.28 | 0.00 | 27.63 | 0.00 | 0.0099 | -0.9808 | |||
| CSCO / Cisco Systems, Inc. | 0.37 | 0.00 | 26.00 | 0.00 | 0.0093 | -0.9229 | |||
| CRM / Salesforce, Inc. | 0.09 | 0.00 | 25.63 | 0.00 | 0.0091 | -0.9097 | |||
| BA / The Boeing Company | 0.12 | 0.00 | 25.27 | 0.00 | 0.0090 | -0.8968 | |||
| CME / CME Group Inc. | 0.09 | 0.00 | 24.01 | 0.00 | 0.0086 | -0.8520 | |||
| GEV / GE Vernova Inc. | 0.05 | 0.00 | 23.92 | 0.00 | 0.0085 | -0.8489 | |||
| DE / Deere & Company | 0.05 | 0.00 | 23.39 | 0.00 | 0.0083 | -0.8301 | |||
| COR / Cencora, Inc. | 0.08 | 0.00 | 23.12 | 0.00 | 0.0082 | -0.8205 | |||
| TMUS / T-Mobile US, Inc. | 0.10 | 0.00 | 23.09 | 0.00 | 0.0082 | -0.8194 | |||
| BSX / Boston Scientific Corporation | 0.21 | 0.00 | 22.95 | 0.00 | 0.0082 | -0.8146 | |||
| ORLY / O'Reilly Automotive, Inc. | 0.25 | 0.00 | 22.31 | 0.00 | 0.0080 | -0.7917 | |||
| PANW / Palo Alto Networks, Inc. | 0.11 | 0.00 | 22.06 | 0.00 | 0.0079 | -0.7829 | |||
| ANET / Arista Networks Inc | 0.21 | 0.00 | 21.86 | 0.00 | 0.0078 | -0.7758 | |||
| MMM / 3M Company | 0.14 | 0.00 | 21.01 | 0.00 | 0.0075 | -0.7456 | |||
| CARR / Carrier Global Corporation | 0.28 | 0.00 | 20.29 | 0.00 | 0.0072 | -0.7200 | |||
| PGR / The Progressive Corporation | 0.08 | 0.00 | 20.17 | 0.00 | 0.0072 | -0.7160 | |||
| AMT / American Tower Corporation | 0.09 | 0.00 | 20.16 | 0.00 | 0.0072 | -0.7154 | |||
| MCD / McDonald's Corporation | 0.07 | 0.00 | 19.14 | 0.00 | 0.0068 | -0.6792 | |||
| CVX / Chevron Corporation | 0.13 | 0.00 | 19.12 | 0.00 | 0.0068 | -0.6784 | |||
| ADI / Analog Devices, Inc. | 0.08 | 0.00 | 18.80 | 0.00 | 0.0067 | -0.6674 | |||
| ETR / Entergy Corporation | 0.22 | 0.00 | 18.24 | 0.00 | 0.0065 | -0.6475 | |||
| AMD / Advanced Micro Devices, Inc. | 0.13 | 0.00 | 18.16 | 0.00 | 0.0065 | -0.6446 | |||
| XLV / The Select Sector SPDR Trust - The Health Care Select Sector SPDR Fund | 0.13 | 0.00 | 18.06 | 0.00 | 0.0064 | -0.6410 | |||
| AIG / American International Group, Inc. | 0.21 | 0.00 | 17.93 | 0.00 | 0.0064 | -0.6364 | |||
| DUK / Duke Energy Corporation | 0.15 | 0.00 | 17.70 | 0.00 | 0.0063 | -0.6282 | |||
| RSG / Republic Services, Inc. | 0.07 | 0.00 | 16.89 | 0.00 | 0.0060 | -0.5995 | |||
| MDT / Medtronic plc | 0.19 | 0.00 | 16.82 | 0.00 | 0.0060 | -0.5968 | |||
| TMO / Thermo Fisher Scientific Inc. | 0.04 | 0.00 | 16.34 | 0.00 | 0.0058 | -0.5799 | |||
| PH / Parker-Hannifin Corporation | 0.02 | 0.00 | 15.86 | 0.00 | 0.0057 | -0.5627 | |||
| UNH / UnitedHealth Group Incorporated | 0.05 | 0.00 | 15.85 | 0.00 | 0.0056 | -0.5625 | |||
| KVUE / Kenvue Inc. | 0.75 | 0.00 | 15.75 | 0.00 | 0.0056 | -0.5590 | |||
| JNJ / Johnson & Johnson | 0.10 | 0.00 | 15.70 | 0.00 | 0.0056 | -0.5573 | |||
| VRTX / Vertex Pharmaceuticals Incorporated | 0.04 | 0.00 | 15.63 | 0.00 | 0.0056 | -0.5546 | |||
| ECL / Ecolab Inc. | 0.06 | 0.00 | 15.47 | 0.00 | 0.0055 | -0.5489 | |||
| RTX / RTX Corporation | 0.10 | 0.00 | 15.11 | 0.00 | 0.0054 | -0.5364 | |||
| SYY / Sysco Corporation | 0.20 | 0.00 | 14.90 | 0.00 | 0.0053 | -0.5287 | |||
| SHW / The Sherwin-Williams Company | 0.04 | 0.00 | 14.52 | 0.00 | 0.0052 | -0.5155 | |||
| US61747C7157 / Morgan Stanley Institutional Liquidity Funds - Prime Portfolio | 14.50 | -18.54 | 14.50 | -18.55 | 0.0052 | -0.6984 | |||
| HD / The Home Depot, Inc. | 0.04 | 0.00 | 13.90 | 0.00 | 0.0050 | -0.4932 | |||
| TT / Trane Technologies plc | 0.03 | 0.00 | 13.82 | 0.00 | 0.0049 | -0.4906 | |||
| CBRE / CBRE Group, Inc. | 0.10 | 0.00 | 13.76 | 0.00 | 0.0049 | -0.4883 | |||
| VICI / VICI Properties Inc. | 0.42 | 0.00 | 13.74 | 0.00 | 0.0049 | -0.4878 | |||
| ES / Eversource Energy | 0.21 | 0.00 | 13.68 | 0.00 | 0.0049 | -0.4855 | |||
| COST / Costco Wholesale Corporation | 0.01 | 0.00 | 13.56 | 0.00 | 0.0048 | -0.4813 | |||
| CI / The Cigna Group | 0.04 | 0.00 | 13.29 | 0.00 | 0.0047 | -0.4716 | |||
| APO / Apollo Global Management, Inc. | 0.09 | 0.00 | 13.09 | 0.00 | 0.0047 | -0.4647 | |||
| PODD / Insulet Corporation | 0.04 | 0.00 | 12.79 | 0.00 | 0.0046 | -0.4538 | |||
| TEAM / Atlassian Corporation | 0.06 | 0.00 | 12.69 | 0.00 | 0.0045 | -0.4505 | |||
| POST / Post Holdings, Inc. | 0.12 | 0.00 | 12.69 | 0.00 | 0.0045 | -0.4504 | |||
| 1ADSK / Autodesk, Inc. | 0.04 | 0.00 | 12.60 | 0.00 | 0.0045 | -0.4472 | |||
| BKR / Baker Hughes Company | 0.31 | 0.00 | 11.86 | 0.00 | 0.0042 | -0.4210 | |||
| AVB / AvalonBay Communities, Inc. | 0.06 | 0.00 | 11.72 | 0.00 | 0.0042 | -0.4160 | |||
| DPZ / Domino's Pizza, Inc. | 0.03 | 0.00 | 11.67 | 0.00 | 0.0042 | -0.4142 | |||
| FI / Fiserv, Inc. | 0.07 | 0.00 | 11.43 | 0.00 | 0.0041 | -0.4057 | |||
| SKX / Skechers U.S.A., Inc. | 0.18 | 0.00 | 11.43 | 0.00 | 0.0041 | -0.4056 | |||
| PG / The Procter & Gamble Company | 0.07 | 0.00 | 11.19 | 0.00 | 0.0040 | -0.3972 | |||
| CCK / Crown Holdings, Inc. | 0.10 | 0.00 | 10.78 | 0.00 | 0.0038 | -0.3827 | |||
| ORCL / Oracle Corporation | 0.05 | 0.00 | 10.67 | 0.00 | 0.0038 | -0.3787 | |||
| REGN / Regeneron Pharmaceuticals, Inc. | 0.02 | 0.00 | 10.34 | 0.00 | 0.0037 | -0.3671 | |||
| KO / The Coca-Cola Company | 0.14 | 0.00 | 10.19 | 0.00 | 0.0036 | -0.3616 | |||
| TKO / TKO Group Holdings, Inc. | 0.05 | 0.00 | 9.88 | 0.00 | 0.0035 | -0.3506 | |||
| PAYC / Paycom Software, Inc. | 0.04 | 0.00 | 9.60 | 0.00 | 0.0034 | -0.3408 | |||
| CEG / Constellation Energy Corporation | 0.03 | 0.00 | 9.46 | 0.00 | 0.0034 | -0.3356 | |||
| DGX / Quest Diagnostics Incorporated | 0.05 | 0.00 | 9.36 | 0.00 | 0.0033 | -0.3321 | |||
| FCX / Freeport-McMoRan Inc. | 0.19 | 0.00 | 8.12 | 0.00 | 0.0029 | -0.2880 | |||
| CL / Colgate-Palmolive Company | 0.09 | 0.00 | 8.11 | 0.00 | 0.0029 | -0.2878 | |||
| ACN / Accenture plc | 0.02 | 0.00 | 7.36 | 0.00 | 0.0026 | -0.2612 | |||
| VST / Vistra Corp. | 0.04 | 0.00 | 7.25 | 0.00 | 0.0026 | -0.2573 | |||
| SPOT / Spotify Technology S.A. | 0.01 | 0.00 | 6.98 | 0.00 | 0.0025 | -0.2478 | |||
| XLY / The Select Sector SPDR Trust - The Consumer Discretionary Select Sector SPDR Fund | 0.03 | 0.00 | 6.89 | 0.00 | 0.0025 | -0.2445 | |||
| HES / Hess Corporation | 0.05 | 0.00 | 6.80 | 0.00 | 0.0024 | -0.2414 | |||
| PEP / PepsiCo, Inc. | 0.05 | 0.00 | 6.31 | 0.00 | 0.0022 | -0.2240 | |||
| PLTR / Palantir Technologies Inc. | 0.04 | 0.00 | 5.36 | 0.00 | 0.0019 | -0.1901 | |||
| NITXX / Northern Institutional Funds - Northern Institutional Treasury Portfolio | 1.18 | 137.02 | 1.18 | 137.22 | 0.0004 | -0.0193 | |||
| AFA / American Financial Group, Inc. | 0.47 | 0.00 | 0.0002 | -0.0182 |