Mga Batayang Estadistika
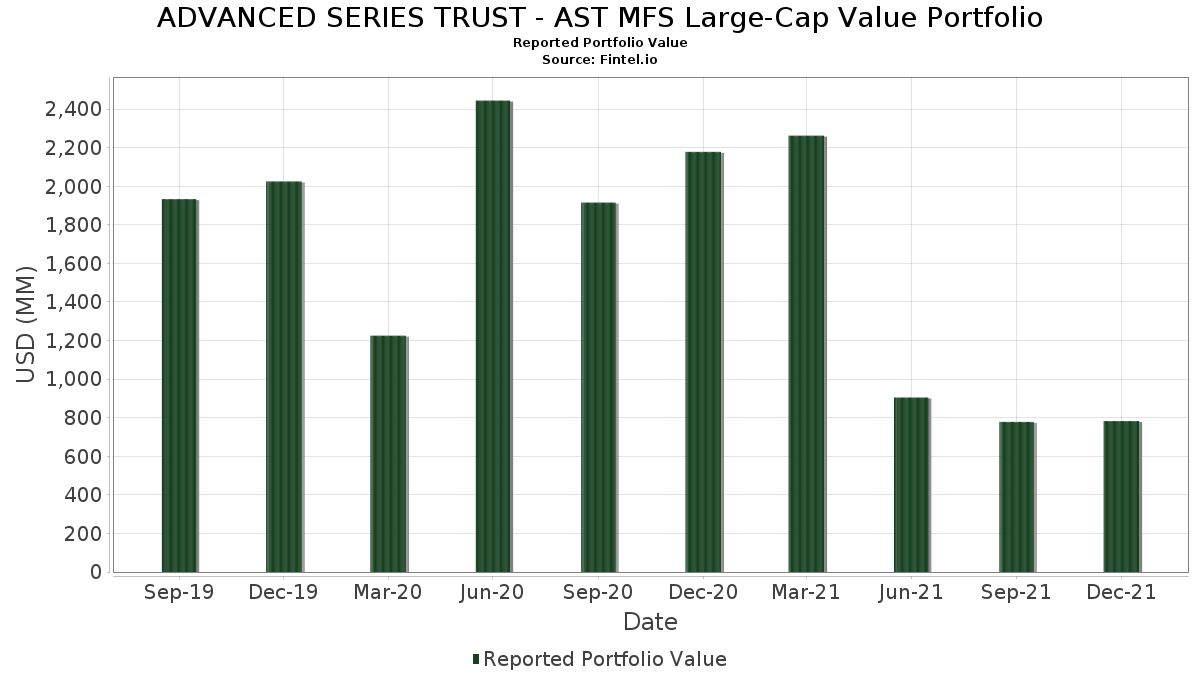
| Nilai Portofolio | $ 782,635,022 |
| Posisi Saat Ini | 76 |
Kepemilikan Terbaru, Kinerja, AUM (dari 13F, 13D)
ADVANCED SERIES TRUST - AST MFS Large-Cap Value Portfolio telah mengungkapkan total kepemilikan 76 dalam pengajuan SEC terbaru mereka. Nilai portofolio terbaru dihitung sebesar $ 782,635,022 USD. Aset yang Dikelola (AUM) sebenarnya adalah nilai ini ditambah kas (yang tidak diungkapkan). Aset-aset utama ADVANCED SERIES TRUST - AST MFS Large-Cap Value Portfolio adalah JPMorgan Chase & Co. (US:JPM) , Johnson & Johnson (US:JNJ) , Accenture plc (US:ACN) , Aon plc (US:AON) , and Comcast Corporation (US:CMCSA) . Posisi baru ADVANCED SERIES TRUST - AST MFS Large-Cap Value Portfolio meliputi: Liberty Broadband Corporation (US:LBRDA) , .
Peningkatan Tertinggi Kuartal Ini
Kami menggunakan perubahan dalam alokasi portofolio karena ini adalah metrik yang paling bermakna. Perubahan dapat disebabkan oleh perdagangan atau perubahan harga saham.
| Keamanan | Saham (MM) |
Nilai (Juta Dolar AS) |
Portfolio % | ΔPorsyento ng Portfolio |
|---|---|---|---|---|
| 0.06 | 14.58 | 1.8602 | 0.4363 | |
| 0.27 | 15.86 | 2.0230 | 0.4169 | |
| 0.05 | 8.65 | 1.1036 | 0.3411 | |
| 0.10 | 8.17 | 1.0428 | 0.3346 | |
| 0.00 | 2.40 | 0.3056 | 0.3056 | |
| 0.05 | 14.20 | 1.8114 | 0.2618 | |
| 0.06 | 4.73 | 0.6038 | 0.2276 | |
| 0.08 | 13.47 | 1.7189 | 0.1651 | |
| 0.14 | 10.88 | 1.3881 | 0.1613 | |
| 0.11 | 7.58 | 0.9667 | 0.1530 |
Penurunan Tertinggi Kuartal Ini
Kami menggunakan perubahan dalam alokasi portofolio karena ini adalah metrik yang paling bermakna. Perubahan dapat disebabkan oleh perdagangan atau perubahan harga saham.
| Keamanan | Saham (MM) |
Nilai (Juta Dolar AS) |
Portfolio % | ΔPorsyento ng Portfolio |
|---|---|---|---|---|
| 9.75 | 9.75 | 1.2445 | -1.0782 | |
| 0.14 | 14.82 | 1.8910 | -0.6065 | |
| 0.40 | 20.19 | 2.5764 | -0.5443 | |
| 0.00 | 0.00 | -0.5263 | ||
| 0.20 | 32.00 | 4.0832 | -0.5175 | |
| 0.21 | 12.48 | 1.5928 | -0.4248 | |
| 0.10 | 18.47 | 2.3569 | -0.2631 | |
| 0.08 | 17.48 | 2.2306 | -0.2447 | |
| 0.00 | 0.00 | -0.2417 | ||
| 0.06 | 6.32 | 0.8067 | -0.1735 |
Pengajuan 13F dan Dana
Formulir ini diajukan pada 2022-02-22 untuk periode pelaporan 2021-12-31. Klik ikon tautan untuk melihat riwayat transaksi selengkapnya.
Tingkatkan ke versi premium untuk membuka data premium dan ekspor ke Excel. ![]() .
.
| Keamanan | Ketik | Harga Saham Rata-rata | Saham (MM) |
ΔSaham (%) |
ΔSaham (%) |
Nilai ($MM) |
Portpolyo (%) |
ΔPortofolio (%) |
|
|---|---|---|---|---|---|---|---|---|---|
| JPM / JPMorgan Chase & Co. | 0.20 | -7.78 | 32.00 | -10.79 | 4.0832 | -0.5175 | |||
| JNJ / Johnson & Johnson | 0.15 | -7.78 | 26.25 | -2.32 | 3.3491 | -0.0972 | |||
| ACN / Accenture plc | 0.05 | -18.28 | 22.23 | 5.89 | 2.8368 | 0.1441 | |||
| AON / Aon plc | 0.07 | -6.36 | 21.06 | -1.51 | 2.6876 | -0.0554 | |||
| CMCSA / Comcast Corporation | 0.40 | -7.79 | 20.19 | -17.02 | 2.5764 | -0.5443 | |||
| TXN / Texas Instruments Incorporated | 0.10 | -7.78 | 18.47 | -9.58 | 2.3569 | -0.2631 | |||
| HON / Honeywell International Inc. | 0.08 | -7.78 | 17.48 | -9.42 | 2.2306 | -0.2447 | |||
| MMC / Marsh & McLennan Companies, Inc. | 0.10 | -7.78 | 17.38 | 5.85 | 2.2170 | 0.1118 | |||
| TMO / Thermo Fisher Scientific Inc. | 0.03 | -7.78 | 17.18 | 7.70 | 2.1925 | 0.1462 | |||
| CB / Chubb Limited | 0.09 | -7.79 | 16.80 | 2.76 | 2.1432 | 0.0468 | |||
| NOC / Northrop Grumman Corporation | 0.04 | -7.78 | 16.29 | -0.89 | 2.0783 | -0.0294 | |||
| PFE / Pfizer Inc. | 0.27 | -7.78 | 15.86 | 26.61 | 2.0230 | 0.4169 | |||
| DUK / Duke Energy Corporation | 0.15 | -7.79 | 15.75 | -0.88 | 2.0093 | -0.0282 | |||
| CI / The Cigna Group | 0.07 | -7.79 | 15.12 | 5.79 | 1.9291 | 0.0962 | |||
| MDT / Medtronic plc | 0.14 | -7.79 | 14.82 | -23.89 | 1.8910 | -0.6065 | |||
| UNP / Union Pacific Corporation | 0.06 | 2.17 | 14.58 | 31.32 | 1.8602 | 0.4363 | |||
| LOW / Lowe's Companies, Inc. | 0.05 | -7.79 | 14.20 | 17.50 | 1.8114 | 0.2618 | |||
| ABT / Abbott Laboratories | 0.10 | -7.79 | 13.66 | 9.87 | 1.7428 | 0.1483 | |||
| PPG / PPG Industries, Inc. | 0.08 | -7.78 | 13.47 | 11.19 | 1.7189 | 0.1651 | |||
| PGR / The Progressive Corporation | 0.13 | -6.36 | 13.46 | 6.35 | 1.7170 | 0.0941 | |||
| MS / Morgan Stanley | 0.14 | -6.36 | 13.43 | -5.54 | 1.7132 | -0.1099 | |||
| DHR / Danaher Corporation | 0.04 | -7.79 | 13.42 | -0.34 | 1.7124 | -0.0147 | |||
| ETN / Eaton Corporation plc | 0.08 | -7.78 | 13.37 | 6.73 | 1.7054 | 0.0994 | |||
| NDAQ / Nasdaq, Inc. | 0.06 | -13.58 | 13.26 | -5.98 | 1.6918 | -0.1167 | |||
| NSRGY / Nestlé S.A. - Depositary Receipt (Common Stock) | 0.09 | -7.79 | 13.22 | 7.03 | 1.6872 | 0.1026 | |||
| ITW / Illinois Tool Works Inc. | 0.05 | -7.78 | 13.01 | 10.14 | 1.6596 | 0.1451 | |||
| SO / The Southern Company | 0.19 | -7.78 | 12.74 | 2.05 | 1.6258 | 0.0245 | |||
| C / Citigroup Inc. | 0.21 | -7.78 | 12.48 | -20.65 | 1.5928 | -0.4248 | |||
| AXP / American Express Company | 0.08 | -6.36 | 12.30 | -8.56 | 1.5697 | -0.1557 | |||
| DEO / Diageo plc - Depositary Receipt (Common Stock) | 0.22 | -7.79 | 12.25 | 4.24 | 1.5634 | 0.0559 | |||
| JCI / Johnson Controls International plc | 0.14 | -7.78 | 11.77 | 10.14 | 1.5023 | 0.1313 | |||
| C.WSA / Citigroup, Inc. | 0.01 | -7.78 | 11.57 | 0.67 | 1.4762 | 0.0024 | |||
| D / Dominion Energy, Inc. | 0.14 | -1.35 | 11.31 | 6.14 | 1.4427 | 0.0765 | |||
| MRK / Merck & Co., Inc. | 0.14 | 11.46 | 10.88 | 13.73 | 1.3881 | 0.1613 | |||
| SHW / The Sherwin-Williams Company | 0.03 | -16.13 | 9.95 | 5.59 | 1.2697 | 0.0610 | |||
| PNC / The PNC Financial Services Group, Inc. | 0.05 | -7.78 | 9.84 | -5.49 | 1.2554 | -0.0797 | |||
| PGIM Core Ultra Short Bond Fund / STIV (000000000) | 9.75 | 4,312.39 | 9.75 | -77.21 | 1.2445 | -1.0782 | |||
| EFX / Equifax Inc. | 0.03 | -6.36 | 9.74 | 8.19 | 1.2427 | 0.0881 | |||
| IR / Ingersoll Rand Inc. | 0.05 | -7.79 | 9.58 | 7.90 | 1.2228 | 0.0838 | |||
| TRV / The Travelers Companies, Inc. | 0.06 | -7.79 | 9.21 | -5.11 | 1.1750 | -0.0696 | |||
| GS / The Goldman Sachs Group, Inc. | 0.02 | -7.78 | 9.05 | -6.68 | 1.1543 | -0.0890 | |||
| USB / U.S. Bancorp | 0.16 | -7.79 | 8.72 | -12.86 | 1.1123 | -0.1707 | |||
| PEP / PepsiCo, Inc. | 0.05 | 25.96 | 8.65 | 45.46 | 1.1036 | 0.3411 | |||
| MCK / McKesson Corporation | 0.03 | -7.79 | 8.28 | 14.96 | 1.0569 | 0.1328 | |||
| DOW / Dow Inc. | 0.10 | 24.58 | 8.17 | 48.02 | 1.0428 | 0.3346 | |||
| SWK / Stanley Black & Decker, Inc. | 0.04 | -7.79 | 7.90 | -0.78 | 1.0082 | -0.0132 | |||
| MAS / Masco Corporation | 0.11 | -5.53 | 7.58 | 19.42 | 0.9667 | 0.1530 | |||
| COP / ConocoPhillips | 0.10 | -7.79 | 7.16 | -1.78 | 0.9141 | -0.0214 | |||
| BSX / Boston Scientific Corporation | 0.16 | -7.78 | 7.00 | -9.72 | 0.8925 | -0.1012 | |||
| NXPI / NXP Semiconductors N.V. | 0.03 | -7.78 | 6.95 | 7.24 | 0.8867 | 0.0556 | |||
| KMB / Kimberly-Clark Corporation | 0.05 | -7.79 | 6.50 | -0.47 | 0.8293 | -0.0084 | |||
| FIS / Fidelity National Information Services, Inc. | 0.06 | -7.78 | 6.32 | -17.28 | 0.8067 | -0.1735 | |||
| LMT / Lockheed Martin Corporation | 0.02 | -7.79 | 6.04 | -5.03 | 0.7702 | -0.0450 | |||
| CL / Colgate-Palmolive Company | 0.07 | -6.36 | 5.88 | 5.72 | 0.7501 | 0.0370 | |||
| TFC / Truist Financial Corporation | 0.10 | -7.79 | 5.87 | -7.94 | 0.7487 | -0.0688 | |||
| RTX / RTX Corporation | 0.07 | -7.79 | 5.83 | -7.68 | 0.7434 | -0.0660 | |||
| MAR / Marriott International, Inc. | 0.03 | 5.23 | 5.77 | 17.42 | 0.7364 | 0.1060 | |||
| ADI / Analog Devices, Inc. | 0.03 | -7.79 | 5.77 | -3.22 | 0.7360 | -0.0284 | |||
| INTC / Intel Corporation | 0.10 | -7.78 | 5.41 | -10.88 | 0.6899 | -0.0881 | |||
| AEP / American Electric Power Company, Inc. | 0.06 | -7.78 | 5.31 | 1.07 | 0.6780 | 0.0037 | |||
| KKR / KKR & Co. Inc. | 0.06 | 31.84 | 4.73 | 61.34 | 0.6038 | 0.2276 | |||
| EOG / EOG Resources, Inc. | 0.05 | -7.78 | 4.63 | 2.05 | 0.5909 | 0.0089 | |||
| CNI / Canadian National Railway Company | 0.04 | -7.79 | 4.56 | -2.02 | 0.5813 | -0.0151 | |||
| RKT / Reckitt Benckiser Group plc | 0.05 | -5.53 | 4.28 | 3.01 | 0.5461 | 0.0132 | |||
| FISV / Fiserv, Inc. | 0.04 | -7.78 | 4.20 | -11.79 | 0.5364 | -0.0748 | |||
| PXD / Pioneer Natural Resources Company | 0.02 | -7.79 | 4.00 | 0.70 | 0.5107 | 0.0011 | |||
| MCO / Moody's Corporation | 0.01 | -7.78 | 3.81 | 1.41 | 0.4865 | 0.0044 | |||
| PSA / Public Storage | 0.01 | -7.78 | 3.59 | 16.26 | 0.4581 | 0.0620 | |||
| XEL / Xcel Energy Inc. | 0.05 | -7.78 | 3.54 | -0.11 | 0.4515 | -0.0028 | |||
| PCAR / PACCAR Inc | 0.03 | -5.53 | 2.87 | 5.63 | 0.3663 | 0.0178 | |||
| ADM / Archer-Daniels-Midland Company | 0.04 | -7.79 | 2.85 | 3.86 | 0.3637 | 0.0117 | |||
| IFF / International Flavors & Fragrances Inc. | 0.02 | 39.83 | 2.84 | 57.56 | 0.3629 | 0.1314 | |||
| RHHBY / Roche Holding AG - Depositary Receipt (Common Stock) | 0.01 | -7.78 | 2.68 | 4.85 | 0.3421 | 0.0141 | |||
| OTIS / Otis Worldwide Corporation | 0.03 | -7.79 | 2.52 | -2.40 | 0.3221 | -0.0097 | |||
| LBRDA / Liberty Broadband Corporation | 0.00 | 2.40 | 0.3056 | 0.3056 | |||||
| PM / Philip Morris International Inc. | 0.02 | -44.94 | 1.63 | -44.83 | 0.2077 | -0.1706 | |||
| SJM / The J. M. Smucker Company | 0.00 | -100.00 | 0.00 | -100.00 | -0.2417 | ||||
| CVX / Chevron Corporation | 0.00 | -100.00 | 0.00 | -100.00 | -0.5263 |