Mga Batayang Estadistika
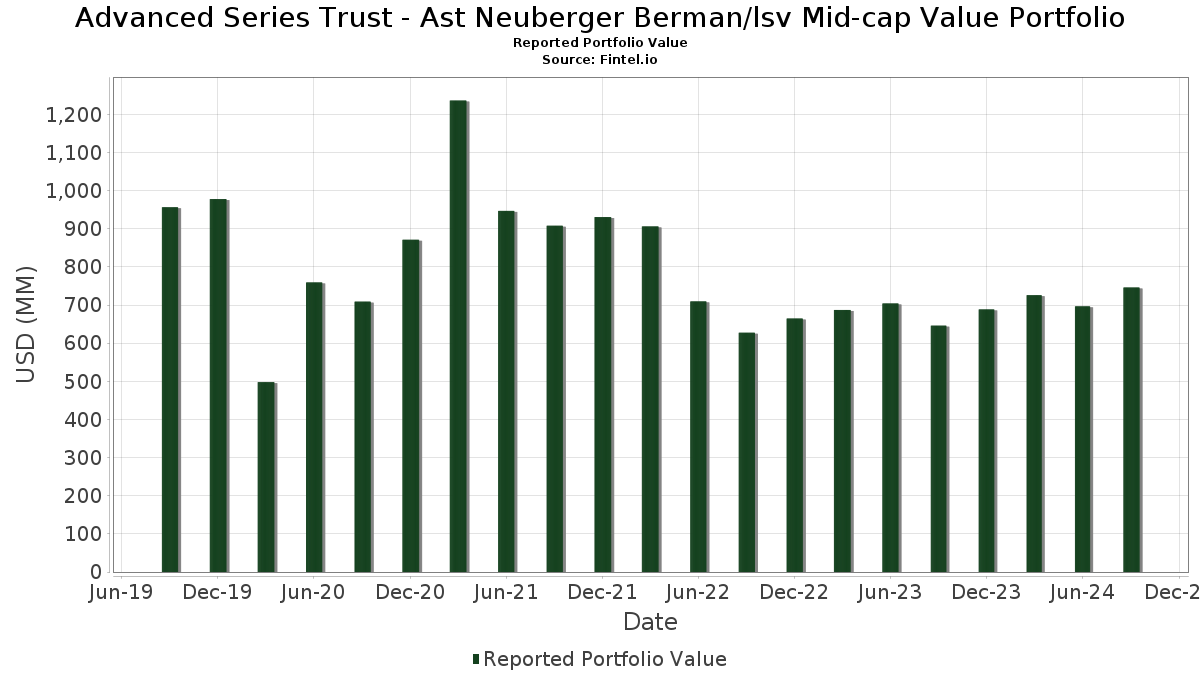
| Nilai Portofolio | $ 745,962,075 |
| Posisi Saat Ini | 228 |
Kepemilikan Terbaru, Kinerja, AUM (dari 13F, 13D)
Advanced Series Trust - Ast Neuberger Berman/lsv Mid-cap Value Portfolio telah mengungkapkan total kepemilikan 228 dalam pengajuan SEC terbaru mereka. Nilai portofolio terbaru dihitung sebesar $ 745,962,075 USD. Aset yang Dikelola (AUM) sebenarnya adalah nilai ini ditambah kas (yang tidak diungkapkan). Aset-aset utama Advanced Series Trust - Ast Neuberger Berman/lsv Mid-cap Value Portfolio adalah Vanguard Index Funds - Vanguard Mid-Cap Value ETF (US:VOE) , US Foods Holding Corp. (US:USFD) , The Hartford Insurance Group, Inc. (US:HIG) , TransUnion (US:TRU) , and Flex Ltd. (US:FLEX) . Posisi baru Advanced Series Trust - Ast Neuberger Berman/lsv Mid-cap Value Portfolio meliputi: Somnigroup International Inc. (US:SGI) , American Healthcare REIT, Inc. (US:AHR) , Perrigo Company plc (US:PRGO) , Synovus Financial Corp. (US:SNV) , and Federal Home Loan Bank (FHLB) (US:US313384H937) .
Peningkatan Tertinggi Kuartal Ini
Kami menggunakan perubahan dalam alokasi portofolio karena ini adalah metrik yang paling bermakna. Perubahan dapat disebabkan oleh perdagangan atau perubahan harga saham.
| Keamanan | Saham (MM) |
Nilai (Juta Dolar AS) |
Portfolio % | ΔPorsyento ng Portfolio |
|---|---|---|---|---|
| 98.95 | 98.91 | 15.2671 | 15.2671 | |
| 0.07 | 7.78 | 1.2013 | 0.6056 | |
| 0.06 | 7.65 | 1.1807 | 0.5845 | |
| 3.62 | 3.62 | 0.5594 | 0.5594 | |
| 0.06 | 3.50 | 0.5405 | 0.5405 | |
| 0.12 | 3.23 | 0.4988 | 0.4988 | |
| 0.12 | 3.11 | 0.4801 | 0.4801 | |
| 0.06 | 2.62 | 0.4044 | 0.4044 | |
| 0.06 | 4.09 | 0.6310 | 0.3908 | |
| 2.39 | 0.3686 | 0.3686 |
Penurunan Tertinggi Kuartal Ini
Kami menggunakan perubahan dalam alokasi portofolio karena ini adalah metrik yang paling bermakna. Perubahan dapat disebabkan oleh perdagangan atau perubahan harga saham.
| Keamanan | Saham (MM) |
Nilai (Juta Dolar AS) |
Portfolio % | ΔPorsyento ng Portfolio |
|---|---|---|---|---|
| 0.02 | 2.58 | 0.3977 | -0.5690 | |
| 0.01 | 1.25 | 0.1937 | -0.4643 | |
| 0.02 | 3.17 | 0.4891 | -0.3083 | |
| 0.05 | 0.84 | 0.1296 | -0.2839 | |
| 0.01 | 1.78 | 0.2751 | -0.2663 | |
| 0.00 | 0.00 | -0.2129 | ||
| 0.13 | 1.13 | 0.1746 | -0.2095 | |
| 0.01 | 3.66 | 0.5649 | -0.2014 | |
| 0.08 | 2.31 | 0.3561 | -0.1930 | |
| 0.01 | 2.54 | 0.3917 | -0.1850 |
Pengajuan 13F dan Dana
Formulir ini diajukan pada 2024-11-25 untuk periode pelaporan 2024-09-30. Klik ikon tautan untuk melihat riwayat transaksi selengkapnya.
Tingkatkan ke versi premium untuk membuka data premium dan ekspor ke Excel. ![]() .
.
| Keamanan | Ketik | Harga Saham Rata-rata | Saham (MM) |
ΔSaham (%) |
ΔSaham (%) |
Nilai ($MM) |
Portpolyo (%) |
ΔPortofolio (%) |
|
|---|---|---|---|---|---|---|---|---|---|
| PGIM Institutional Money Market Fund - D / STIV (000000000) | 98.95 | 98.91 | 15.2671 | 15.2671 | |||||
| VOE / Vanguard Index Funds - Vanguard Mid-Cap Value ETF | 0.07 | -3.61 | 12.23 | 7.44 | 1.8885 | 0.0029 | |||
| USFD / US Foods Holding Corp. | 0.18 | -2.35 | 11.36 | 13.35 | 1.7537 | 0.0941 | |||
| HIG / The Hartford Insurance Group, Inc. | 0.07 | -15.54 | 7.98 | -1.20 | 1.2313 | -0.1056 | |||
| TRU / TransUnion | 0.07 | 53.22 | 7.78 | 116.35 | 1.2013 | 0.6056 | |||
| FLEX / Flex Ltd. | 0.23 | -7.07 | 7.75 | 5.34 | 1.1963 | -0.0219 | |||
| LNT / Alliant Energy Corporation | 0.13 | 1.99 | 7.72 | 21.61 | 1.1917 | 0.1405 | |||
| WTW / Willis Towers Watson Public Limited Company | 0.03 | 2.84 | 7.66 | 15.55 | 1.1828 | 0.0847 | |||
| CPT / Camden Property Trust | 0.06 | 87.64 | 7.65 | 112.44 | 1.1807 | 0.5845 | |||
| KNX / Knight-Swift Transportation Holdings Inc. | 0.14 | -6.51 | 7.46 | 1.03 | 1.1522 | -0.0711 | |||
| IWS / iShares Trust - iShares Russell Mid-Cap Value ETF | 0.05 | 0.57 | 6.36 | 10.16 | 0.9810 | 0.0257 | |||
| MIDD / The Middleby Corporation | 0.05 | -4.01 | 6.34 | 8.91 | 0.9792 | 0.0149 | |||
| CCK / Crown Holdings, Inc. | 0.07 | 7.74 | 6.33 | 38.86 | 0.9768 | 0.2222 | |||
| LDOS / Leidos Holdings, Inc. | 0.04 | -7.70 | 6.12 | 3.12 | 0.9441 | -0.0379 | |||
| TPG / TPG Inc. | 0.11 | -6.02 | 6.09 | 30.52 | 0.9407 | 0.1675 | |||
| BJ / BJ's Wholesale Club Holdings, Inc. | 0.07 | 9.41 | 6.07 | 2.73 | 0.9364 | -0.0413 | |||
| VOYA / Voya Financial, Inc. | 0.07 | 5.67 | 5.83 | 17.65 | 0.8992 | 0.0793 | |||
| BRX / Brixmor Property Group Inc. | 0.20 | -18.81 | 5.58 | -2.05 | 0.8615 | -0.0819 | |||
| ROST / Ross Stores, Inc. | 0.04 | 3.75 | 5.49 | 7.46 | 0.8470 | 0.0014 | |||
| MTB / M&T Bank Corporation | 0.03 | -23.93 | 5.48 | -10.49 | 0.8460 | -0.1678 | |||
| DAL / Delta Air Lines, Inc. | 0.11 | 13.91 | 5.37 | 21.97 | 0.8288 | 0.0998 | |||
| A / Agilent Technologies, Inc. | 0.03 | -1.00 | 5.18 | 13.38 | 0.7991 | 0.0432 | |||
| EG / Everest Group, Ltd. | 0.01 | -0.67 | 4.98 | 2.15 | 0.7687 | -0.0386 | |||
| NNN / NNN REIT, Inc. | 0.10 | -2.31 | 4.92 | 11.20 | 0.7590 | 0.0268 | |||
| ZBRA / Zebra Technologies Corporation | 0.01 | -9.87 | 4.87 | 8.04 | 0.7513 | 0.0053 | |||
| ICLR / ICON Public Limited Company | 0.02 | 16.66 | 4.76 | 6.93 | 0.7340 | -0.0024 | |||
| US7587501039 / Regal-Beloit Corp. | 0.03 | -1.36 | 4.68 | 21.01 | 0.7230 | 0.0821 | |||
| JBHT / J.B. Hunt Transport Services, Inc. | 0.03 | -1.92 | 4.54 | 5.63 | 0.7006 | -0.0108 | |||
| KMPR / Kemper Corporation | 0.07 | 2.71 | 4.53 | 6.04 | 0.6998 | -0.0082 | |||
| DGX / Quest Diagnostics Incorporated | 0.03 | -7.52 | 4.39 | 4.89 | 0.6782 | -0.0154 | |||
| EQT / EQT Corporation | 0.12 | 27.09 | 4.35 | 25.93 | 0.6709 | 0.0994 | |||
| PB / Prosperity Bancshares, Inc. | 0.06 | -2.54 | 4.30 | 14.87 | 0.6643 | 0.0440 | |||
| GPN / Global Payments Inc. | 0.04 | 4.00 | 4.27 | 10.13 | 0.6594 | 0.0172 | |||
| AVY / Avery Dennison Corporation | 0.02 | 3.68 | 4.22 | 4.68 | 0.6521 | -0.0161 | |||
| AGCO / AGCO Corporation | 0.04 | -1.92 | 4.17 | -1.93 | 0.6430 | -0.0604 | |||
| TGT / Target Corporation | 0.03 | 5.14 | 4.15 | 10.68 | 0.6400 | 0.0198 | |||
| ZBH / Zimmer Biomet Holdings, Inc. | 0.04 | -1.98 | 4.13 | -2.51 | 0.6369 | -0.0638 | |||
| ON / ON Semiconductor Corporation | 0.06 | 166.00 | 4.09 | 181.86 | 0.6310 | 0.3908 | |||
| FBHS / Fortune Brands Home & Security Inc | 0.05 | 9.84 | 4.06 | 51.47 | 0.6269 | 0.1828 | |||
| RS / Reliance, Inc. | 0.01 | 11.56 | 4.01 | 12.97 | 0.6197 | 0.0313 | |||
| BKR / Baker Hughes Company | 0.11 | 0.55 | 3.96 | 3.34 | 0.6110 | -0.0232 | |||
| PCG / PG&E Corporation | 0.20 | -1.39 | 3.87 | 11.64 | 0.5969 | 0.0234 | |||
| LAMR / Lamar Advertising Company | 0.03 | -10.60 | 3.86 | -0.08 | 0.5955 | -0.0438 | |||
| APTV / Aptiv PLC | 0.05 | -2.26 | 3.84 | -0.05 | 0.5934 | -0.0435 | |||
| TXT / Textron Inc. | 0.04 | -5.83 | 3.72 | -2.85 | 0.5743 | -0.0598 | |||
| BWA / BorgWarner Inc. | 0.10 | -3.67 | 3.72 | 8.43 | 0.5742 | 0.0062 | |||
| FCN / FTI Consulting, Inc. | 0.02 | -4.85 | 3.68 | 0.44 | 0.5682 | -0.0385 | |||
| FNV / Franco-Nevada Corporation | 0.03 | 17.06 | 3.67 | 22.74 | 0.5658 | 0.0712 | |||
| MSI / Motorola Solutions, Inc. | 0.01 | -32.11 | 3.66 | -20.92 | 0.5649 | -0.2014 | |||
| FNF / Fidelity National Financial, Inc. | 0.06 | 2.04 | 3.64 | 28.13 | 0.5618 | 0.0915 | |||
| (PIPA070) PGIM Core Government Money Market Fund / STIV (000000000) | 3.62 | 3.62 | 0.5594 | 0.5594 | |||||
| COO / The Cooper Companies, Inc. | 0.03 | 26.95 | 3.59 | 60.52 | 0.5535 | 0.1835 | |||
| SHOO / Steven Madden, Ltd. | 0.07 | 4.19 | 3.58 | 20.68 | 0.5522 | 0.0613 | |||
| FMC / FMC Corporation | 0.05 | 6.67 | 3.58 | 22.26 | 0.5520 | 0.0675 | |||
| BDC / Belden Inc. | 0.03 | -6.20 | 3.56 | 17.16 | 0.5491 | 0.0462 | |||
| BK / The Bank of New York Mellon Corporation | 0.05 | -12.72 | 3.55 | 4.72 | 0.5480 | -0.0133 | |||
| SGI / Somnigroup International Inc. | 0.06 | 3.50 | 0.5405 | 0.5405 | |||||
| AFG / American Financial Group, Inc. | 0.03 | -7.99 | 3.49 | 0.66 | 0.5381 | -0.0353 | |||
| CADE / Cadence Bank | 0.11 | -17.10 | 3.47 | -6.64 | 0.5361 | -0.0798 | |||
| PKG / Packaging Corporation of America | 0.02 | -24.15 | 3.38 | -10.51 | 0.5220 | -0.1037 | |||
| WH / Wyndham Hotels & Resorts, Inc. | 0.04 | -10.95 | 3.34 | -5.96 | 0.5161 | -0.0727 | |||
| NI / NiSource Inc. | 0.10 | -17.26 | 3.34 | -0.51 | 0.5154 | -0.0402 | |||
| BCC / Boise Cascade Company | 0.02 | 19.94 | 3.30 | 41.81 | 0.5095 | 0.1242 | |||
| WLK / Westlake Corporation | 0.02 | 5.85 | 3.26 | 9.87 | 0.5034 | 0.0118 | |||
| COR / Cencora, Inc. | 0.01 | -1.40 | 3.26 | -1.48 | 0.5030 | -0.0447 | |||
| HUN / Huntsman Corporation | 0.13 | 11.03 | 3.25 | 18.00 | 0.5020 | 0.0456 | |||
| TOL / Toll Brothers, Inc. | 0.02 | -1.39 | 3.25 | 32.26 | 0.5012 | 0.0947 | |||
| SSB / SouthState Corporation | 0.03 | -18.80 | 3.24 | 3.25 | 0.5005 | -0.0194 | |||
| AHR / American Healthcare REIT, Inc. | 0.12 | 3.23 | 0.4988 | 0.4988 | |||||
| HOLX / Hologic, Inc. | 0.04 | -11.46 | 3.21 | -2.88 | 0.4954 | -0.0517 | |||
| ORI / Old Republic International Corporation | 0.09 | -2.80 | 3.19 | 11.42 | 0.4926 | 0.0183 | |||
| DRI / Darden Restaurants, Inc. | 0.02 | -39.33 | 3.17 | -34.21 | 0.4891 | -0.3083 | |||
| ARE / Alexandria Real Estate Equities, Inc. | 0.03 | -9.93 | 3.12 | -8.55 | 0.4821 | -0.0835 | |||
| EXR / Extra Space Storage Inc. | 0.02 | -1.39 | 3.11 | 14.32 | 0.4806 | 0.0297 | |||
| PRGO / Perrigo Company plc | 0.12 | 3.11 | 0.4801 | 0.4801 | |||||
| EBAY / eBay Inc. | 0.05 | -16.90 | 3.11 | 0.71 | 0.4794 | -0.0312 | |||
| COG / Cabot Oil & Gas Corp. | 0.13 | -0.84 | 3.10 | -10.95 | 0.4784 | -0.0979 | |||
| PEG / Public Service Enterprise Group Incorporated | 0.03 | -1.39 | 3.10 | 19.35 | 0.4779 | 0.0484 | |||
| AXTA / Axalta Coating Systems Ltd. | 0.08 | 2.05 | 3.07 | 8.07 | 0.4732 | 0.0036 | |||
| GPK / Graphic Packaging Holding Company | 0.10 | -1.39 | 3.03 | 11.30 | 0.4683 | 0.0170 | |||
| EMN / Eastman Chemical Company | 0.03 | -1.39 | 3.03 | 12.69 | 0.4674 | 0.0224 | |||
| WAB / Westinghouse Air Brake Technologies Corporation | 0.02 | -1.39 | 2.95 | 13.38 | 0.4552 | 0.0246 | |||
| RJF / Raymond James Financial, Inc. | 0.02 | -1.39 | 2.91 | -2.32 | 0.4485 | -0.0440 | |||
| RPM / RPM International Inc. | 0.02 | -3.23 | 2.90 | 8.76 | 0.4483 | 0.0061 | |||
| EVR / Evercore Inc. | 0.01 | -14.17 | 2.83 | 4.35 | 0.4373 | -0.0123 | |||
| ATR / AptarGroup, Inc. | 0.02 | 34.35 | 2.82 | 52.87 | 0.4352 | 0.1298 | |||
| DD / DuPont de Nemours, Inc. | 0.03 | -1.39 | 2.82 | 9.18 | 0.4350 | 0.0076 | |||
| STEP / StepStone Group Inc. | 0.05 | -24.08 | 2.78 | -6.01 | 0.4297 | -0.0606 | |||
| COHR / Coherent Corp. | 0.03 | -29.63 | 2.78 | -13.65 | 0.4286 | -0.1039 | |||
| AKAM / Akamai Technologies, Inc. | 0.03 | 27.46 | 2.78 | 42.87 | 0.4285 | 0.1067 | |||
| G / Genpact Limited | 0.07 | -6.73 | 2.72 | 13.63 | 0.4194 | 0.0234 | |||
| TRGP / Targa Resources Corp. | 0.02 | -25.35 | 2.68 | -14.19 | 0.4134 | -0.1035 | |||
| AIZ / Assurant, Inc. | 0.01 | -1.39 | 2.67 | 17.96 | 0.4127 | 0.0374 | |||
| TRMB / Trimble Inc. | 0.04 | 51.68 | 2.67 | 68.39 | 0.4121 | 0.1496 | |||
| LKQ / LKQ Corporation | 0.07 | -1.39 | 2.65 | -5.35 | 0.4094 | -0.0546 | |||
| CTVA / Corteva, Inc. | 0.04 | -1.39 | 2.64 | 7.49 | 0.4074 | 0.0008 | |||
| SNV / Synovus Financial Corp. | 0.06 | 2.62 | 0.4044 | 0.4044 | |||||
| UHS / Universal Health Services, Inc. | 0.01 | -25.97 | 2.61 | -8.35 | 0.4035 | -0.0686 | |||
| CMS / CMS Energy Corporation | 0.04 | -1.39 | 2.59 | 17.03 | 0.4000 | 0.0332 | |||
| MKSI / MKS Inc. | 0.02 | -46.99 | 2.58 | -55.88 | 0.3977 | -0.5690 | |||
| XEL / Xcel Energy Inc. | 0.04 | -28.59 | 2.56 | -12.70 | 0.3959 | -0.0905 | |||
| HWM / Howmet Aerospace Inc. | 0.03 | -1.39 | 2.55 | 27.31 | 0.3937 | 0.0621 | |||
| CARR / Carrier Global Corporation | 0.03 | -3.95 | 2.54 | 22.55 | 0.3926 | 0.0490 | |||
| JBT / JBT Marel Corporation | 0.03 | -9.76 | 2.54 | -6.38 | 0.3921 | -0.0572 | |||
| FANG / Diamondback Energy, Inc. | 0.01 | -15.39 | 2.54 | -27.14 | 0.3917 | -0.1850 | |||
| DVN / Devon Energy Corporation | 0.06 | -3.18 | 2.50 | -20.11 | 0.3865 | -0.1323 | |||
| VICI / VICI Properties Inc. | 0.08 | -1.39 | 2.50 | 14.67 | 0.3862 | 0.0250 | |||
| INGR / Ingredion Incorporated | 0.02 | -1.39 | 2.46 | 18.13 | 0.3803 | 0.0350 | |||
| NTRS / Northern Trust Corporation | 0.03 | -1.39 | 2.46 | 5.72 | 0.3794 | -0.0056 | |||
| LSTR / Landstar System, Inc. | 0.01 | -2.99 | 2.46 | -0.69 | 0.3790 | -0.0303 | |||
| ELS / Equity LifeStyle Properties, Inc. | 0.03 | 3.61 | 2.45 | 13.51 | 0.3788 | 0.0208 | |||
| CF / CF Industries Holdings, Inc. | 0.03 | 28.40 | 2.45 | 48.58 | 0.3788 | 0.1054 | |||
| GLW / Corning Incorporated | 0.05 | -1.39 | 2.44 | 14.59 | 0.3772 | 0.0241 | |||
| KBR / KBR, Inc. | 0.04 | -1.39 | 2.42 | 0.12 | 0.3729 | -0.0266 | |||
| TROW / T. Rowe Price Group, Inc. | 0.02 | -6.75 | 2.41 | -11.90 | 0.3716 | -0.0809 | |||
| US313384H937 / Federal Home Loan Bank (FHLB) | 2.39 | 0.3686 | 0.3686 | ||||||
| GLOB / Globant S.A. | 0.01 | 2.38 | 0.3670 | 0.3670 | |||||
| LHX / L3Harris Technologies, Inc. | 0.01 | 10.34 | 2.37 | 16.84 | 0.3653 | 0.0300 | |||
| CHRD / Chord Energy Corporation | 0.02 | 49.59 | 2.36 | 16.22 | 0.3638 | 0.0279 | |||
| SBAC / SBA Communications Corporation | 0.01 | 2.35 | 0.3623 | 0.3623 | |||||
| GNTX / Gentex Corporation | 0.08 | -21.01 | 2.31 | -30.46 | 0.3561 | -0.1930 | |||
| KVUE / Kenvue Inc. | 0.10 | -1.39 | 2.29 | 25.44 | 0.3541 | 0.0513 | |||
| HBAN / Huntington Bancshares Incorporated | 0.16 | 18.84 | 2.28 | 32.54 | 0.3522 | 0.0671 | |||
| SWK / Stanley Black & Decker, Inc. | 0.02 | 14.04 | 2.28 | 57.24 | 0.3521 | 0.1118 | |||
| AIG / American International Group, Inc. | 0.03 | -1.39 | 2.26 | -2.75 | 0.3496 | -0.0360 | |||
| SLM / SLM Corporation | 0.10 | -1.39 | 2.26 | 8.49 | 0.3493 | 0.0039 | |||
| ALGM / Allegro MicroSystems, Inc. | 0.10 | 2.24 | 0.3453 | 0.3453 | |||||
| RF / Regions Financial Corporation | 0.10 | -1.39 | 2.23 | 14.80 | 0.3449 | 0.0226 | |||
| JCI / Johnson Controls International plc | 0.03 | -1.39 | 2.22 | 15.17 | 0.3423 | 0.0234 | |||
| PNR / Pentair plc | 0.02 | -1.39 | 2.22 | 25.77 | 0.3421 | 0.0503 | |||
| FIS / Fidelity National Information Services, Inc. | 0.03 | -1.39 | 2.21 | 9.58 | 0.3407 | 0.0072 | |||
| ASH / Ashland Inc. | 0.03 | 13.21 | 2.19 | 4.20 | 0.3374 | -0.0099 | |||
| NGVT / Ingevity Corporation | 0.06 | 7.95 | 2.18 | -3.66 | 0.3371 | -0.0383 | |||
| BC / Brunswick Corporation | 0.03 | 14.47 | 2.18 | 31.84 | 0.3363 | 0.0627 | |||
| MAN / ManpowerGroup Inc. | 0.03 | 0.68 | 2.16 | 6.04 | 0.3336 | -0.0038 | |||
| SKX / Skechers U.S.A., Inc. | 0.03 | -1.39 | 2.14 | -4.51 | 0.3298 | -0.0408 | |||
| PWR / Quanta Services, Inc. | 0.01 | -1.39 | 2.13 | 15.72 | 0.3286 | 0.0240 | |||
| SUI / Sun Communities, Inc. | 0.02 | -1.39 | 2.11 | 10.74 | 0.3262 | 0.0102 | |||
| US21871X1090 / Corebridge Financial, Inc. | 0.07 | -1.39 | 2.09 | -1.23 | 0.3233 | -0.0279 | |||
| CCEP / COCA COLA EUROPACIFIC COMPANY GUAR REGS 11/27 1.5 | 0.03 | -1.39 | 2.08 | 6.55 | 0.3215 | -0.0021 | |||
| ESS / Essex Property Trust, Inc. | 0.01 | -1.40 | 2.08 | 7.05 | 0.3213 | -0.0008 | |||
| ALLE / Allegion plc | 0.01 | -1.39 | 2.07 | 21.59 | 0.3192 | 0.0377 | |||
| SRE / Sempra | 0.02 | -1.39 | 2.06 | 8.42 | 0.3181 | 0.0034 | |||
| EWBC / East West Bancorp, Inc. | 0.02 | -7.86 | 2.06 | 4.09 | 0.3181 | -0.0097 | |||
| MAA / Mid-America Apartment Communities, Inc. | 0.01 | -1.40 | 2.06 | 9.89 | 0.3172 | 0.0075 | |||
| PNW / Pinnacle West Capital Corporation | 0.02 | -1.39 | 2.05 | 14.37 | 0.3171 | 0.0197 | |||
| WPC / W. P. Carey Inc. | 0.03 | -1.39 | 2.04 | 11.62 | 0.3145 | 0.0122 | |||
| ARMK / Aramark | 0.05 | -14.34 | 2.03 | -2.45 | 0.3138 | -0.0314 | |||
| EA / Electronic Arts Inc. | 0.01 | -1.39 | 2.00 | 1.52 | 0.3089 | -0.0175 | |||
| IFF / International Flavors & Fragrances Inc. | 0.02 | -1.39 | 2.00 | 8.65 | 0.3085 | 0.0040 | |||
| VNOM / Viper Energy, Inc. | 0.04 | 2.00 | 0.3085 | 0.3085 | |||||
| CHK / Chesapeake Energy Corporation | 0.02 | -1.39 | 1.99 | -1.34 | 0.3065 | -0.0267 | |||
| JLL / Jones Lang LaSalle Incorporated | 0.01 | -1.39 | 1.97 | 29.62 | 0.3041 | 0.0524 | |||
| BLDR / Builders FirstSource, Inc. | 0.01 | 21.75 | 1.97 | 70.57 | 0.3033 | 0.1125 | |||
| NXPI / NXP Semiconductors N.V. | 0.01 | -13.87 | 1.96 | -23.18 | 0.3029 | -0.1201 | |||
| ITT / ITT Inc. | 0.01 | -1.39 | 1.96 | 14.13 | 0.3018 | 0.0181 | |||
| PR / Permian Resources Corporation | 0.14 | 15.62 | 1.94 | -2.56 | 0.2997 | -0.0303 | |||
| TE CONNECTIVITY PLC / EC (IE000IVNQZ81) | 0.01 | 1.91 | 0.2943 | 0.2943 | |||||
| RL / Ralph Lauren Corporation | 0.01 | -2.97 | 1.90 | 7.41 | 0.2933 | 0.0005 | |||
| EQH / Equitable Holdings, Inc. | 0.05 | -1.39 | 1.89 | 1.45 | 0.2920 | -0.0168 | |||
| BERY / Berry Global Group, Inc. | 0.03 | -14.24 | 1.89 | -0.89 | 0.2916 | -0.0242 | |||
| VLO / Valero Energy Corporation | 0.01 | -1.39 | 1.86 | -15.09 | 0.2875 | -0.0756 | |||
| STE / STERIS plc | 0.01 | -1.39 | 1.86 | 8.96 | 0.2873 | 0.0044 | |||
| DFS / Discover Financial Services | 0.01 | -1.39 | 1.82 | 5.74 | 0.2816 | -0.0040 | |||
| NSC / Norfolk Southern Corporation | 0.01 | -1.40 | 1.82 | 14.09 | 0.2814 | 0.0169 | |||
| AES / The AES Corporation | 0.09 | -1.39 | 1.80 | 12.58 | 0.2778 | 0.0131 | |||
| GFL / GFL Environmental Inc. | 0.04 | -1.39 | 1.79 | 1.02 | 0.2764 | -0.0171 | |||
| THG / The Hanover Insurance Group, Inc. | 0.01 | -53.83 | 1.78 | -45.50 | 0.2751 | -0.2663 | |||
| H / Hyatt Hotels Corporation | 0.01 | -1.39 | 1.78 | -1.22 | 0.2745 | -0.0236 | |||
| OTIS / Otis Worldwide Corporation | 0.02 | 19.50 | 1.76 | 29.01 | 0.2720 | 0.0459 | |||
| PVH / PVH Corp. | 0.02 | -1.39 | 1.74 | -6.09 | 0.2693 | -0.0383 | |||
| XYL / Xylem Inc. | 0.01 | 10.43 | 1.71 | 9.94 | 0.2647 | 0.0064 | |||
| EIX / Edison International | 0.02 | -1.39 | 1.71 | 19.61 | 0.2637 | 0.0272 | |||
| CNP / CenterPoint Energy, Inc. | 0.06 | -1.39 | 1.71 | -6.36 | 0.2635 | -0.0384 | |||
| CHKP / Check Point Software Technologies Ltd. | 0.01 | -1.39 | 1.68 | 15.21 | 0.2597 | 0.0179 | |||
| SYY / Sysco Corporation | 0.02 | -17.65 | 1.67 | -12.13 | 0.2585 | -0.0435 | |||
| X / United States Steel Corporation | 0.05 | 24.73 | 1.67 | 16.61 | 0.2580 | 0.0206 | |||
| LECO / Lincoln Electric Holdings, Inc. | 0.01 | 94.92 | 1.66 | 98.56 | 0.2556 | 0.1174 | |||
| PAGP / Plains GP Holdings, L.P. - Limited Partnership | 0.09 | -1.39 | 1.65 | -3.05 | 0.2549 | -0.0272 | |||
| CDW / CDW Corporation | 0.01 | 1.63 | 0.2515 | 0.2515 | |||||
| J / Jacobs Solutions Inc. | 0.01 | -1.39 | 1.61 | -7.61 | 0.2493 | -0.0401 | |||
| LH / Labcorp Holdings Inc. | 0.01 | 19.93 | 1.58 | 31.69 | 0.2433 | 0.0451 | |||
| ATO / Atmos Energy Corporation | 0.01 | -1.39 | 1.57 | 17.23 | 0.2428 | 0.0207 | |||
| CARG / CarGurus, Inc. | 0.05 | -41.19 | 1.55 | -32.59 | 0.2392 | -0.1414 | |||
| YUM / Yum! Brands, Inc. | 0.01 | -32.19 | 1.52 | -28.51 | 0.2351 | -0.1175 | |||
| VTR / Ventas, Inc. | 0.02 | 1.52 | 0.2347 | 0.2347 | |||||
| HUM / Humana Inc. | 0.00 | 39.41 | 1.50 | 18.20 | 0.2316 | 0.0214 | |||
| HLT / Hilton Worldwide Holdings Inc. | 0.01 | -15.58 | 1.50 | -10.83 | 0.2313 | -0.0469 | |||
| PCAR / PACCAR Inc | 0.02 | 21.94 | 1.50 | 16.86 | 0.2312 | 0.0190 | |||
| LINE / Lineage, Inc. | 0.02 | 1.49 | 0.2299 | 0.2299 | |||||
| AWK / American Water Works Company, Inc. | 0.01 | 1.48 | 0.2291 | 0.2291 | |||||
| MHK / Mohawk Industries, Inc. | 0.01 | -1.39 | 1.48 | 39.42 | 0.2289 | 0.0529 | |||
| MAT / Mattel, Inc. | 0.08 | -1.39 | 1.47 | 15.58 | 0.2268 | 0.0162 | |||
| ACI / Albertsons Companies, Inc. | 0.08 | 21.29 | 1.46 | 13.54 | 0.2253 | 0.0123 | |||
| IP / International Paper Company | 0.03 | 11.27 | 1.46 | 25.99 | 0.2252 | 0.0334 | |||
| PKI / Revvity Inc. | 0.01 | -1.39 | 1.42 | 20.14 | 0.2192 | 0.0235 | |||
| LNC / Lincoln National Corporation | 0.05 | -1.39 | 1.42 | -0.07 | 0.2189 | -0.0161 | |||
| BIIB / Biogen Inc. | 0.01 | 34.82 | 1.38 | 12.73 | 0.2133 | 0.0103 | |||
| IGT / International Game Technology PLC | 0.06 | -1.39 | 1.38 | 2.68 | 0.2133 | -0.0096 | |||
| STAG / STAG Industrial, Inc. | 0.04 | -1.39 | 1.38 | 6.91 | 0.2126 | -0.0008 | |||
| RSG / Republic Services, Inc. | 0.01 | -9.33 | 1.37 | -6.31 | 0.2108 | -0.0305 | |||
| DNB / Dun & Bradstreet Holdings, Inc. | 0.12 | -1.39 | 1.36 | 22.55 | 0.2107 | 0.0263 | |||
| HSY / The Hershey Company | 0.01 | 28.53 | 1.36 | 34.12 | 0.2101 | 0.0420 | |||
| XPO / XPO, Inc. | 0.01 | -1.39 | 1.35 | -0.07 | 0.2081 | -0.0154 | |||
| TFX / Teleflex Incorporated | 0.01 | -1.39 | 1.30 | 15.94 | 0.2000 | 0.0150 | |||
| EXPE / Expedia Group, Inc. | 0.01 | 1.29 | 0.1994 | 0.1994 | |||||
| CBOE / Cboe Global Markets, Inc. | 0.01 | -1.40 | 1.29 | 18.82 | 0.1989 | 0.0193 | |||
| GIS / General Mills, Inc. | 0.02 | -1.39 | 1.26 | 15.12 | 0.1939 | 0.0132 | |||
| SWKS / Skyworks Solutions, Inc. | 0.01 | -65.93 | 1.25 | -68.44 | 0.1937 | -0.4643 | |||
| COLB / Columbia Banking System, Inc. | 0.05 | -12.21 | 1.24 | 15.31 | 0.1907 | 0.0132 | |||
| DOW / Dow Inc. | 0.02 | -1.40 | 1.22 | 1.50 | 0.1883 | -0.0106 | |||
| FTI / TechnipFMC plc | 0.05 | -1.39 | 1.22 | -1.06 | 0.1878 | -0.0159 | |||
| Viking Holdings Ltd / EC (BMG93A5A1010) | 0.03 | 33.33 | 1.18 | 37.12 | 0.1825 | 0.0397 | |||
| ST / Sensata Technologies Holding plc | 0.03 | -1.39 | 1.18 | -5.46 | 0.1818 | -0.0244 | |||
| GEHC / GE HealthCare Technologies Inc. | 0.01 | 1.14 | 0.1755 | 0.1755 | |||||
| GT / The Goodyear Tire & Rubber Company | 0.13 | -37.47 | 1.13 | -51.23 | 0.1746 | -0.2095 | |||
| MRVL / Marvell Technology, Inc. | 0.02 | -28.26 | 1.09 | -25.98 | 0.1685 | -0.0757 | |||
| HAL / Halliburton Company | 0.04 | -1.39 | 1.08 | -15.20 | 0.1671 | -0.0443 | |||
| LW / Lamb Weston Holdings, Inc. | 0.02 | 1.06 | 0.1638 | 0.1638 | |||||
| HUBB / Hubbell Incorporated | 0.00 | -2.00 | 1.05 | 14.90 | 0.1620 | 0.0107 | |||
| NWL / Newell Brands Inc. | 0.12 | 16.17 | 0.95 | 39.33 | 0.1472 | 0.0337 | |||
| OGN / Organon & Co. | 0.05 | -1.39 | 0.90 | -8.88 | 0.1395 | -0.0247 | |||
| ALK / Alaska Air Group, Inc. | 0.02 | -1.39 | 0.87 | 10.25 | 0.1346 | 0.0038 | |||
| EL / The Estée Lauder Companies Inc. | 0.01 | 0.86 | 0.1320 | 0.1320 | |||||
| IART / Integra LifeSciences Holdings Corporation | 0.05 | -46.07 | 0.84 | -66.40 | 0.1296 | -0.2839 | |||
| CAR / Avis Budget Group, Inc. | 0.01 | -1.39 | 0.63 | -17.31 | 0.0967 | -0.0288 | |||
| AMTM / Amentum Holdings, Inc. | 0.01 | 0.40 | 0.0614 | 0.0614 | |||||
| US61747C7074 / Morgan Stanley Institutional Liquidity Funds Government Portfolio, Institutional Class | 0.39 | -57.18 | 0.39 | -57.22 | 0.0604 | -0.0909 | |||
| DENN / Denny's Corporation | 0.00 | -100.00 | 0.00 | -100.00 | -0.2129 |