Mga Batayang Estadistika
| Nilai Portofolio | $ 1,706,891,808 |
| Posisi Saat Ini | 83 |
Kepemilikan Terbaru, Kinerja, AUM (dari 13F, 13D)
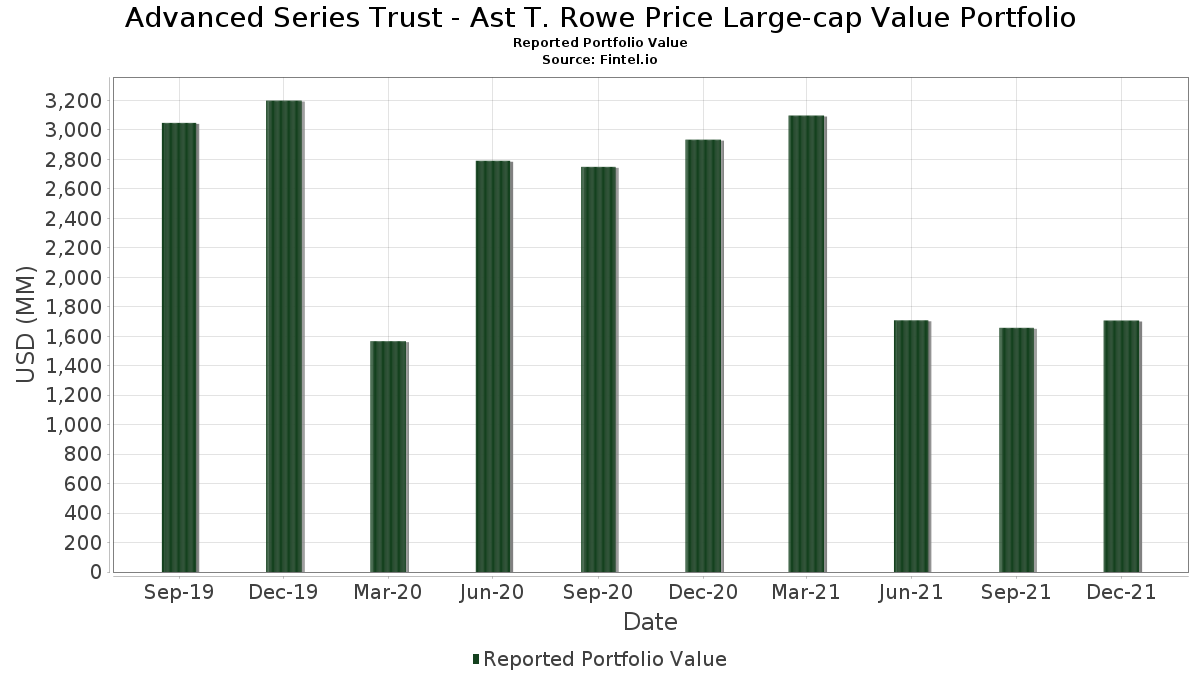
Advanced Series Trust - Ast T. Rowe Price Large-cap Value Portfolio telah mengungkapkan total kepemilikan 83 dalam pengajuan SEC terbaru mereka. Nilai portofolio terbaru dihitung sebesar $ 1,706,891,808 USD. Aset yang Dikelola (AUM) sebenarnya adalah nilai ini ditambah kas (yang tidak diungkapkan). Aset-aset utama Advanced Series Trust - Ast T. Rowe Price Large-cap Value Portfolio adalah Wells Fargo & Company (US:WFC) , General Electric Company (US:GE) , American International Group, Inc. (US:AIG) , United Parcel Service, Inc. (US:UPS) , and Microsoft Corporation (US:MSFT) .
Peningkatan Tertinggi Kuartal Ini
Kami menggunakan perubahan dalam alokasi portofolio karena ini adalah metrik yang paling bermakna. Perubahan dapat disebabkan oleh perdagangan atau perubahan harga saham.
| Keamanan | Saham (MM) |
Nilai (Juta Dolar AS) |
Portfolio % | ΔPorsyento ng Portfolio |
|---|---|---|---|---|
| 0.21 | 38.44 | 2.2755 | 0.5705 | |
| 23.83 | 23.81 | 1.4096 | 0.5095 | |
| 0.19 | 16.52 | 0.9782 | 0.4822 | |
| 0.07 | 32.96 | 1.9513 | 0.4308 | |
| 0.14 | 45.60 | 2.6994 | 0.2776 | |
| 0.35 | 20.85 | 1.2344 | 0.2767 | |
| 0.22 | 47.88 | 2.8343 | 0.2569 | |
| 0.09 | 20.73 | 1.2269 | 0.2502 | |
| 0.15 | 22.25 | 1.3170 | 0.2424 | |
| 0.43 | 36.22 | 2.1444 | 0.2369 |
Penurunan Tertinggi Kuartal Ini
Kami menggunakan perubahan dalam alokasi portofolio karena ini adalah metrik yang paling bermakna. Perubahan dapat disebabkan oleh perdagangan atau perubahan harga saham.
| Keamanan | Saham (MM) |
Nilai (Juta Dolar AS) |
Portfolio % | ΔPorsyento ng Portfolio |
|---|---|---|---|---|
| 0.18 | 17.79 | 1.0532 | -0.9239 | |
| 0.02 | 6.94 | 0.4106 | -0.3995 | |
| 0.08 | 3.02 | 0.1788 | -0.3894 | |
| 0.23 | 23.30 | 1.3796 | -0.3472 | |
| 0.67 | 31.69 | 1.8760 | -0.3356 | |
| 0.16 | 5.38 | 0.3187 | -0.3029 | |
| 0.34 | 9.69 | 0.5738 | -0.2848 | |
| 0.26 | 18.59 | 1.1006 | -0.2283 | |
| 0.12 | 22.20 | 1.3142 | -0.2064 | |
| 0.57 | 53.65 | 3.1761 | -0.2057 |
Pengajuan 13F dan Dana
Formulir ini diajukan pada 2022-02-22 untuk periode pelaporan 2021-12-31. Klik ikon tautan untuk melihat riwayat transaksi selengkapnya.
Tingkatkan ke versi premium untuk membuka data premium dan ekspor ke Excel. ![]() .
.
| Keamanan | Ketik | Harga Saham Rata-rata | Saham (MM) |
ΔSaham (%) |
ΔSaham (%) |
Nilai ($MM) |
Portpolyo (%) |
ΔPortofolio (%) |
|
|---|---|---|---|---|---|---|---|---|---|
| WFC / Wells Fargo & Company | 1.25 | -4.08 | 60.20 | -0.83 | 3.5635 | -0.1271 | |||
| GE / General Electric Company | 0.57 | 5.20 | 53.65 | -3.54 | 3.1761 | -0.2057 | |||
| AIG / American International Group, Inc. | 0.85 | 0.35 | 48.32 | 3.96 | 2.8603 | 0.0345 | |||
| UPS / United Parcel Service, Inc. | 0.22 | -4.05 | 47.88 | 12.94 | 2.8343 | 0.2569 | |||
| MSFT / Microsoft Corporation | 0.14 | -4.04 | 45.60 | 14.48 | 2.6994 | 0.2776 | |||
| SO / The Southern Company | 0.61 | -2.10 | 41.92 | 8.35 | 2.4815 | 0.1292 | |||
| TTA / Time to Act Plc | 0.82 | -3.02 | 40.64 | 0.08 | 2.4057 | -0.0632 | |||
| CB / Chubb Limited | 0.20 | -3.02 | 39.05 | 8.07 | 2.3119 | 0.1147 | |||
| QCOM / QUALCOMM Incorporated | 0.21 | -3.32 | 38.44 | 37.07 | 2.2755 | 0.5705 | |||
| SCHW / The Charles Schwab Corporation | 0.43 | 0.00 | 36.22 | 15.46 | 2.1444 | 0.2369 | |||
| WY / Weyerhaeuser Company | 0.81 | -1.40 | 33.40 | 14.15 | 1.9772 | 0.1982 | |||
| ANTM / Anthem Inc | 0.07 | 6.00 | 32.96 | 31.80 | 1.9513 | 0.4308 | |||
| BAC / Bank of America Corporation | 0.74 | 0.87 | 32.82 | 5.72 | 1.9429 | 0.0553 | |||
| IP / International Paper Company | 0.67 | 3.70 | 31.69 | -12.88 | 1.8760 | -0.3356 | |||
| MET / MetLife, Inc. | 0.48 | -8.85 | 30.07 | -7.72 | 1.7800 | -0.2011 | |||
| FITB / Fifth Third Bancorp | 0.68 | -3.87 | 29.79 | -1.36 | 1.7636 | -0.0727 | |||
| BDX / Becton, Dickinson and Company | 0.12 | 3.92 | 29.32 | 6.32 | 1.7357 | 0.0589 | |||
| JNJ / Johnson & Johnson | 0.16 | 3.29 | 27.07 | 9.41 | 1.6025 | 0.0982 | |||
| TJX / The TJX Companies, Inc. | 0.35 | -1.22 | 26.86 | 13.66 | 1.5902 | 0.1533 | |||
| SRE / Sempra | 0.20 | -0.20 | 26.36 | 4.36 | 1.5605 | 0.0248 | |||
| ABBV / AbbVie Inc. | 0.19 | -5.59 | 25.53 | 18.50 | 1.5111 | 0.2014 | |||
| PGIM Institutional Money Market Fund - D / STIV (000000000) | 23.83 | 3,827.14 | 23.81 | -10.59 | 1.4096 | 0.5095 | |||
| MDT / Medtronic plc | 0.23 | -0.57 | 23.30 | -17.94 | 1.3796 | -0.3472 | |||
| AMAT / Applied Materials, Inc. | 0.15 | -23.88 | 23.15 | -6.95 | 1.3706 | -0.1421 | |||
| TSN / Tyson Foods, Inc. | 0.26 | -3.15 | 22.35 | 6.94 | 1.3229 | 0.0524 | |||
| IFF / International Flavors & Fragrances Inc. | 0.15 | 11.73 | 22.25 | 25.87 | 1.3170 | 0.2424 | |||
| TXN / Texas Instruments Incorporated | 0.12 | -9.48 | 22.20 | -11.24 | 1.3142 | -0.2064 | |||
| COP / ConocoPhillips | 0.30 | -8.32 | 21.98 | -2.35 | 1.3011 | -0.0674 | |||
| IJGXX / JPMorgan Trust II - JPMorgan US Government Money Market Fund Institutional Class | 21.90 | 18.81 | 21.90 | 18.82 | 1.2964 | 0.1758 | |||
| DIS / The Walt Disney Company | 0.14 | 27.90 | 21.66 | 17.11 | 1.2820 | 0.1577 | |||
| CMCSA / Comcast Corporation | 0.43 | 2.51 | 21.61 | -7.76 | 1.2794 | -0.1451 | |||
| PFE / Pfizer Inc. | 0.35 | -3.59 | 20.85 | 32.38 | 1.2344 | 0.2767 | |||
| CI / The Cigna Group | 0.09 | 12.46 | 20.73 | 29.02 | 1.2269 | 0.2502 | |||
| WMT / Walmart Inc. | 0.14 | 20.48 | 20.68 | 25.07 | 1.2245 | 0.2190 | |||
| ZBH / Zimmer Biomet Holdings, Inc. | 0.16 | 8.70 | 19.84 | -5.65 | 1.1744 | -0.1040 | |||
| GS / The Goldman Sachs Group, Inc. | 0.05 | 2.59 | 19.73 | 3.81 | 1.1679 | 0.0125 | |||
| KMB / Kimberly-Clark Corporation | 0.14 | 7.93 | 19.64 | 16.48 | 1.1626 | 0.1374 | |||
| NEE / NextEra Energy, Inc. | 0.21 | -3.06 | 19.57 | 15.26 | 1.1588 | 0.1262 | |||
| FISV / Fiserv, Inc. | 0.19 | 24.38 | 19.33 | 18.98 | 1.1441 | 0.1565 | |||
| EQH / Equitable Holdings, Inc. | 0.59 | 5.30 | 19.22 | 16.49 | 1.1379 | 0.1347 | |||
| PM / Philip Morris International Inc. | 0.20 | -10.74 | 18.89 | -10.54 | 1.1185 | -0.1655 | |||
| CF / CF Industries Holdings, Inc. | 0.26 | -32.92 | 18.59 | -14.93 | 1.1006 | -0.2283 | |||
| XOM / Exxon Mobil Corporation | 0.30 | -3.50 | 18.43 | 0.39 | 1.0912 | -0.0252 | |||
| MRK / Merck & Co., Inc. | 0.23 | 4.08 | 18.00 | 6.19 | 1.0659 | 0.0350 | |||
| ITW / Illinois Tool Works Inc. | 0.07 | 0.71 | 17.97 | 20.29 | 1.0638 | 0.1555 | |||
| MS / Morgan Stanley | 0.18 | -45.76 | 17.79 | -45.29 | 1.0532 | -0.9239 | |||
| MMC / Marsh & McLennan Companies, Inc. | 0.10 | -15.15 | 17.66 | -2.60 | 1.0454 | -0.0570 | |||
| AVB / AvalonBay Communities, Inc. | 0.07 | 10.09 | 17.64 | 25.46 | 1.0442 | 0.1894 | |||
| SIEGY / Siemens Aktiengesellschaft - Depositary Receipt (Common Stock) | 0.19 | 92.15 | 16.52 | 102.59 | 0.9782 | 0.4822 | |||
| CSCO / Cisco Systems, Inc. | 0.26 | -6.87 | 16.51 | 8.43 | 0.9777 | 0.0516 | |||
| AEE / Ameren Corporation | 0.18 | -2.88 | 16.12 | 6.73 | 0.9544 | 0.0359 | |||
| TMO / Thermo Fisher Scientific Inc. | 0.02 | -3.33 | 15.63 | 12.91 | 0.9255 | 0.0836 | |||
| CVS / CVS Health Corporation | 0.15 | -3.70 | 15.60 | 17.07 | 0.9232 | 0.1133 | |||
| HBAN / Huntington Bancshares Incorporated | 1.01 | 18.35 | 15.52 | 18.04 | 0.9185 | 0.1194 | |||
| KO / The Coca-Cola Company | 0.25 | 0.62 | 14.93 | 13.55 | 0.8838 | 0.0844 | |||
| GOOG / Alphabet Inc. | 0.01 | -3.81 | 14.75 | 4.43 | 0.8731 | 0.0144 | |||
| NWSA / News Corporation | 0.64 | 15.58 | 14.37 | 9.59 | 0.8510 | 0.0535 | |||
| HOLX / Hologic, Inc. | 0.18 | -6.14 | 14.07 | -2.64 | 0.8327 | -0.0457 | |||
| CMI / Cummins Inc. | 0.06 | 11.51 | 13.74 | 8.32 | 0.8133 | 0.0422 | |||
| TEL / TE Connectivity plc | 0.08 | -8.05 | 13.39 | 8.12 | 0.7926 | 0.0396 | |||
| MG / Magna International Inc. | 0.16 | -17.34 | 13.08 | -11.08 | 0.7741 | -0.1200 | |||
| CAG / Conagra Brands, Inc. | 0.38 | -10.59 | 12.88 | -9.86 | 0.7624 | -0.1062 | |||
| CTXS / Citrix Systems, Inc. | 0.13 | 0.00 | 12.57 | -11.91 | 0.7443 | -0.1234 | |||
| WELL / Welltower Inc. | 0.14 | -18.31 | 12.14 | -14.98 | 0.7187 | -0.1494 | |||
| TRP / TC Energy Corporation | 0.25 | -1.19 | 11.82 | -4.38 | 0.6995 | -0.0518 | |||
| ETR / Entergy Corporation | 0.10 | -1.01 | 11.64 | 12.29 | 0.6893 | 0.0588 | |||
| SRCL / Stericycle, Inc. | 0.18 | 12.54 | 10.81 | -1.25 | 0.6402 | -0.0257 | |||
| LUV / Southwest Airlines Co. | 0.25 | 0.00 | 10.74 | -16.70 | 0.6357 | -0.1481 | |||
| NXPI / NXP Semiconductors N.V. | 0.05 | -13.33 | 10.67 | 0.78 | 0.6317 | -0.0120 | |||
| ROK / Rockwell Automation, Inc. | 0.03 | -5.49 | 10.63 | 12.13 | 0.6295 | 0.0529 | |||
| BG / Bunge Global SA | 0.11 | -27.73 | 10.16 | -17.02 | 0.6016 | -0.1431 | |||
| LVS / Las Vegas Sands Corp. | 0.26 | -0.92 | 9.87 | 1.90 | 0.5845 | -0.0046 | |||
| ELAN / Elanco Animal Health Incorporated | 0.34 | -22.88 | 9.69 | -31.36 | 0.5738 | -0.2848 | |||
| BA / The Boeing Company | 0.05 | -4.12 | 9.63 | -12.24 | 0.5704 | -0.0971 | |||
| KSS / Kohl's Corporation | 0.16 | -3.56 | 7.66 | 1.15 | 0.4532 | -0.0070 | |||
| SBNY / Signature Bank | 0.02 | -56.18 | 6.94 | -47.95 | 0.4106 | -0.3995 | |||
| SOLN / Southern Company - Unit - Series A (2019) | 0.12 | 0.00 | 6.47 | 5.38 | 0.3828 | 0.0097 | |||
| NLSN / Nielsen Holdings plc | 0.30 | -15.76 | 6.15 | -9.97 | 0.3642 | -0.0512 | |||
| FOX / Fox Corporation | 0.16 | -42.96 | 5.38 | -47.34 | 0.3187 | -0.3029 | |||
| BDXB / Becton, Dickinson And Co. - 6% PRF CONVERT 01/06/2023 USD 50 - Ser B | 0.07 | 0.00 | 3.65 | -2.28 | 0.2159 | -0.0110 | |||
| C / Citigroup Inc. | 0.05 | 3.11 | 0.1841 | 0.1841 | |||||
| PRGO / Perrigo Company plc | 0.08 | -60.67 | 3.02 | -67.68 | 0.1788 | -0.3894 | |||
| ELAT / Elanco Animal Health Inc - Units ( Purchase Contract & Senior Amortizing Note) | 0.01 | 0.00 | 0.48 | -10.55 | 0.0282 | -0.0041 |