Mga Batayang Estadistika
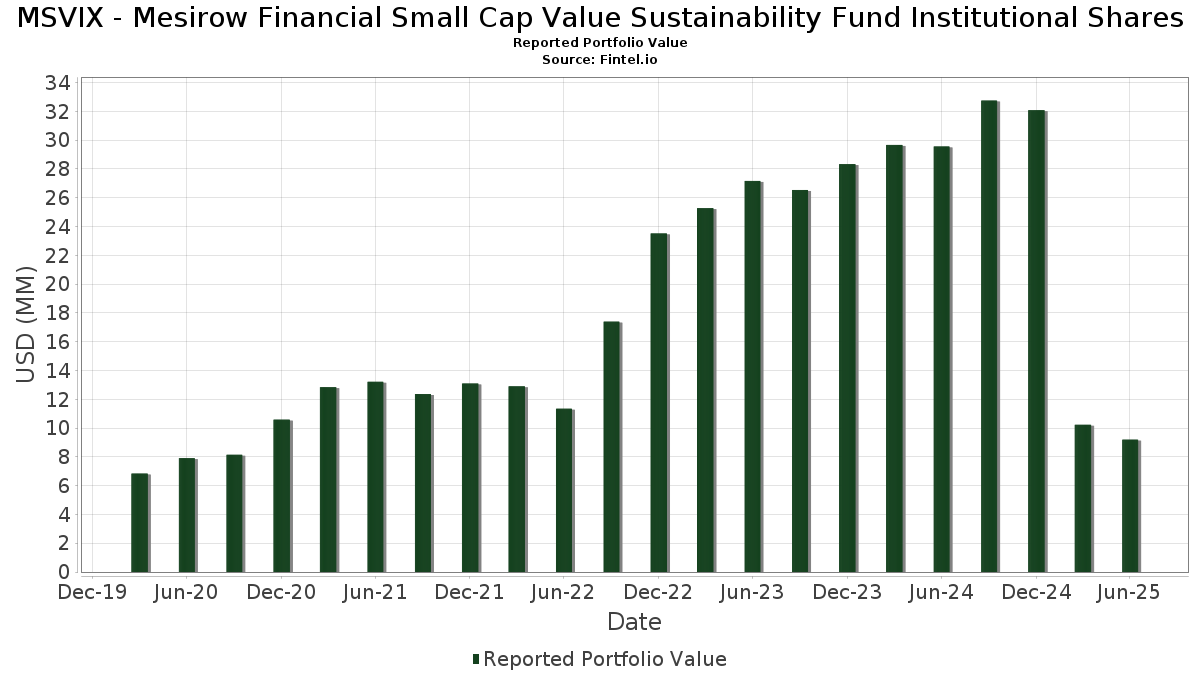
| Nilai Portofolio | $ 9,192,863 |
| Posisi Saat Ini | 82 |
Kepemilikan Terbaru, Kinerja, AUM (dari 13F, 13D)
MSVIX - Mesirow Financial Small Cap Value Sustainability Fund Institutional Shares telah mengungkapkan total kepemilikan 82 dalam pengajuan SEC terbaru mereka. Nilai portofolio terbaru dihitung sebesar $ 9,192,863 USD. Aset yang Dikelola (AUM) sebenarnya adalah nilai ini ditambah kas (yang tidak diungkapkan). Aset-aset utama MSVIX - Mesirow Financial Small Cap Value Sustainability Fund Institutional Shares adalah Coeur Mining, Inc. (US:CDE) , Kyndryl Holdings, Inc. (US:KD) , Rambus Inc. (US:RMBS) , Fluor Corporation (US:FLR) , and Advanced Energy Industries, Inc. (US:AEIS) . Posisi baru MSVIX - Mesirow Financial Small Cap Value Sustainability Fund Institutional Shares meliputi: Coeur Mining, Inc. (US:CDE) , BlackLine, Inc. (US:BL) , PotlatchDeltic Corporation (US:PCH) , TriMas Corporation (US:TRS) , and OceanFirst Financial Corp. (US:OCFC) .
Peningkatan Tertinggi Kuartal Ini
Kami menggunakan perubahan dalam alokasi portofolio karena ini adalah metrik yang paling bermakna. Perubahan dapat disebabkan oleh perdagangan atau perubahan harga saham.
| Keamanan | Saham (MM) |
Nilai (Juta Dolar AS) |
Portfolio % | ΔPorsyento ng Portfolio |
|---|---|---|---|---|
| 0.29 | 3.1878 | 3.1878 | ||
| 0.02 | 0.18 | 1.9131 | 1.9131 | |
| 0.00 | 0.11 | 1.2420 | 1.2420 | |
| 0.00 | 0.11 | 1.2114 | 1.2114 | |
| 0.00 | 0.10 | 1.0352 | 1.0352 | |
| 0.01 | 0.09 | 1.0193 | 1.0193 | |
| 0.00 | 0.09 | 1.0188 | 1.0188 | |
| 0.00 | 0.09 | 1.0184 | 1.0184 | |
| 0.00 | 0.09 | 1.0149 | 1.0149 | |
| 0.00 | 0.15 | 1.6298 | 0.4592 |
Penurunan Tertinggi Kuartal Ini
Kami menggunakan perubahan dalam alokasi portofolio karena ini adalah metrik yang paling bermakna. Perubahan dapat disebabkan oleh perdagangan atau perubahan harga saham.
| Keamanan | Saham (MM) |
Nilai (Juta Dolar AS) |
Portfolio % | ΔPorsyento ng Portfolio |
|---|---|---|---|---|
| 0.00 | 0.00 | -1.0112 | ||
| 0.00 | 0.00 | -1.0112 | ||
| 0.00 | 0.06 | 0.6625 | -0.8021 | |
| 0.00 | 0.07 | 0.7922 | -0.7311 | |
| 0.00 | 0.10 | 1.1193 | -0.6341 | |
| 0.00 | 0.10 | 1.0867 | -0.4490 | |
| 0.00 | 0.09 | 1.0046 | -0.3564 | |
| 0.00 | 0.09 | 1.0141 | -0.3392 | |
| 0.00 | 0.11 | 1.1468 | -0.3133 | |
| 0.00 | 0.05 | 0.5074 | -0.3092 |
Pengajuan 13F dan Dana
Formulir ini diajukan pada 2025-08-28 untuk periode pelaporan 2025-06-30. Klik ikon tautan untuk melihat riwayat transaksi selengkapnya.
Tingkatkan ke versi premium untuk membuka data premium dan ekspor ke Excel. ![]() .
.
| Keamanan | Ketik | Harga Saham Rata-rata | Saham (MM) |
ΔSaham (%) |
ΔSaham (%) |
Nilai ($MM) |
Portpolyo (%) |
ΔPortofolio (%) |
|
|---|---|---|---|---|---|---|---|---|---|
| BROWN BROTHERS HARRIMAN SWEEP INTEREST / STIV (N/A) | 0.29 | 3.1878 | 3.1878 | ||||||
| CDE / Coeur Mining, Inc. | 0.02 | 0.18 | 1.9131 | 1.9131 | |||||
| KD / Kyndryl Holdings, Inc. | 0.00 | -16.02 | 0.17 | 11.69 | 1.8801 | 0.3749 | |||
| RMBS / Rambus Inc. | 0.00 | -9.56 | 0.17 | 11.41 | 1.8123 | 0.3564 | |||
| FLR / Fluor Corporation | 0.00 | -16.02 | 0.16 | 19.55 | 1.7391 | 0.4392 | |||
| AEIS / Advanced Energy Industries, Inc. | 0.00 | -10.02 | 0.15 | 25.21 | 1.6298 | 0.4592 | |||
| HAE / Haemonetics Corporation | 0.00 | -12.49 | 0.14 | 2.90 | 1.5466 | 0.1942 | |||
| GTES / Gates Industrial Corporation plc | 0.01 | -14.08 | 0.14 | 6.98 | 1.5085 | 0.2476 | |||
| AL / Air Lease Corporation | 0.00 | -15.28 | 0.14 | 2.22 | 1.5063 | 0.1870 | |||
| ADMA / ADMA Biologics, Inc. | 0.01 | -7.25 | 0.14 | -14.81 | 1.5027 | -0.0832 | |||
| ATEC / Alphatec Holdings, Inc. | 0.01 | -5.59 | 0.14 | 3.76 | 1.5015 | 0.1961 | |||
| HALO / Halozyme Therapeutics, Inc. | 0.00 | 27.87 | 0.14 | 4.58 | 1.4924 | 0.2062 | |||
| OLLI / Ollie's Bargain Outlet Holdings, Inc. | 0.00 | -15.30 | 0.14 | -4.23 | 1.4833 | 0.0940 | |||
| MRCY / Mercury Systems, Inc. | 0.00 | -35.02 | 0.14 | -18.56 | 1.4814 | -0.1573 | |||
| AXSM / Axsome Therapeutics, Inc. | 0.00 | -14.53 | 0.14 | -23.73 | 1.4759 | -0.2574 | |||
| STVN / Stevanato Group S.p.A. | 0.01 | -25.58 | 0.13 | -10.74 | 1.4517 | -0.0132 | |||
| KTB / Kontoor Brands, Inc. | 0.00 | 13.67 | 0.13 | 16.81 | 1.4378 | 0.3331 | |||
| XBI / SPDR Series Trust - SPDR S&P Biotech ETF | 0.00 | -3.66 | 0.13 | -1.52 | 1.4241 | 0.1253 | |||
| OI / O-I Glass, Inc. | 0.01 | -16.02 | 0.13 | 7.44 | 1.4214 | 0.2382 | |||
| GMED / Globus Medical, Inc. | 0.00 | -3.38 | 0.13 | -21.69 | 1.4147 | -0.2168 | |||
| MOS / The Mosaic Company | 0.00 | -16.01 | 0.13 | 13.51 | 1.3711 | 0.2851 | |||
| BFAM / Bright Horizons Family Solutions Inc. | 0.00 | -16.05 | 0.13 | -18.18 | 1.3710 | -0.1372 | |||
| ACIW / ACI Worldwide, Inc. | 0.00 | -5.28 | 0.13 | -20.38 | 1.3606 | -0.1774 | |||
| ALKS / Alkermes plc | 0.00 | -7.02 | 0.12 | -19.48 | 1.3566 | -0.1562 | |||
| NWN / Northwest Natural Holding Company | 0.00 | -15.79 | 0.12 | -21.66 | 1.3452 | -0.1984 | |||
| BXMT / Blackstone Mortgage Trust, Inc. | 0.01 | 2.48 | 0.12 | -1.60 | 1.3411 | 0.1196 | |||
| SIGI / Selective Insurance Group, Inc. | 0.00 | -15.64 | 0.12 | -20.00 | 1.3061 | -0.1634 | |||
| NHI / National Health Investors, Inc. | 0.00 | -0.53 | 0.12 | -5.60 | 1.2888 | 0.0626 | |||
| LEVI / Levi Strauss & Co. | 0.01 | -16.02 | 0.12 | 0.00 | 1.2777 | 0.1252 | |||
| TCBI / Texas Capital Bancshares, Inc. | 0.00 | -16.02 | 0.12 | -11.45 | 1.2720 | -0.0083 | |||
| ZION / Zions Bancorporation, National Association | 0.00 | -15.44 | 0.12 | -11.45 | 1.2619 | -0.0252 | |||
| BL / BlackLine, Inc. | 0.00 | 0.11 | 1.2420 | 1.2420 | |||||
| SNV / Synovus Financial Corp. | 0.00 | -15.58 | 0.11 | -6.56 | 1.2410 | 0.0481 | |||
| CACI / CACI International Inc | 0.00 | -35.05 | 0.11 | -16.30 | 1.2391 | -0.0803 | |||
| SMTC / Semtech Corporation | 0.00 | 4.51 | 0.11 | -32.53 | 1.2288 | -0.0533 | |||
| AVTR / Avantor, Inc. | 0.01 | -6.11 | 0.11 | -22.22 | 1.2257 | -0.1868 | |||
| BRKR / Bruker Corporation | 0.00 | -8.42 | 0.11 | -9.68 | 1.2228 | 0.0074 | |||
| ICUI / ICU Medical, Inc. | 0.00 | -7.73 | 0.11 | -12.60 | 1.2173 | -0.0282 | |||
| IRT / Independence Realty Trust, Inc. | 0.01 | 5.47 | 0.11 | -11.90 | 1.2126 | -0.0270 | |||
| PCH / PotlatchDeltic Corporation | 0.00 | 0.11 | 1.2114 | 1.2114 | |||||
| HAYW / Hayward Holdings, Inc. | 0.01 | -16.02 | 0.11 | -16.92 | 1.1775 | -0.0932 | |||
| FTI / TechnipFMC plc | 0.00 | -16.02 | 0.11 | -8.55 | 1.1664 | 0.0182 | |||
| IPAR / Interparfums, Inc. | 0.00 | 0.25 | 0.11 | 16.48 | 1.1539 | 0.2571 | |||
| SSB / SouthState Corporation | 0.00 | 0.70 | 0.11 | 0.00 | 1.1500 | 0.1152 | |||
| HWC / Hancock Whitney Corporation | 0.00 | -35.52 | 0.11 | -29.53 | 1.1468 | -0.3133 | |||
| ITT / ITT Inc. | 0.00 | -16.06 | 0.10 | 1.96 | 1.1410 | 0.1352 | |||
| CPRX / Catalyst Pharmaceuticals, Inc. | 0.00 | -35.91 | 0.10 | -43.02 | 1.1193 | -0.6341 | |||
| PIPR / Piper Sandler Companies | 0.00 | -15.67 | 0.10 | -5.61 | 1.1063 | 0.0561 | |||
| ITRI / Itron, Inc. | 0.00 | -42.84 | 0.10 | -28.37 | 1.1023 | -0.2765 | |||
| SFNC / Simmons First National Corporation | 0.01 | -15.42 | 0.10 | -21.87 | 1.0947 | -0.1644 | |||
| KRC / Kilroy Realty Corporation | 0.00 | -1.68 | 0.10 | 3.09 | 1.0929 | 0.1394 | |||
| NXST / Nexstar Media Group, Inc. | 0.00 | -15.99 | 0.10 | -19.51 | 1.0872 | -0.1176 | |||
| WNS / WNS (Holdings) Limited | 0.00 | -38.18 | 0.10 | -36.94 | 1.0867 | -0.4490 | |||
| KFY / Korn Ferry | 0.00 | -16.03 | 0.10 | -9.17 | 1.0822 | 0.0112 | |||
| ELF / e.l.f. Beauty, Inc. | 0.00 | -53.36 | 0.10 | -7.48 | 1.0786 | 0.0301 | |||
| DX / Dynex Capital, Inc. | 0.01 | 10.40 | 0.10 | 3.16 | 1.0734 | 0.1427 | |||
| TRS / TriMas Corporation | 0.00 | 0.10 | 1.0352 | 1.0352 | |||||
| MTH / Meritage Homes Corporation | 0.00 | -0.07 | 0.10 | -5.00 | 1.0342 | 0.0501 | |||
| FWRG / First Watch Restaurant Group, Inc. | 0.01 | -12.73 | 0.09 | -16.07 | 1.0331 | -0.0709 | |||
| HLIO / Helios Technologies, Inc. | 0.00 | 3.03 | 0.09 | 8.05 | 1.0245 | 0.1654 | |||
| OCFC / OceanFirst Financial Corp. | 0.01 | 0.09 | 1.0193 | 1.0193 | |||||
| YETI / YETI Holdings, Inc. | 0.00 | 0.09 | 1.0188 | 1.0188 | |||||
| LFUS / Littelfuse, Inc. | 0.00 | 0.09 | 1.0184 | 1.0184 | |||||
| JBT / JBT Marel Corporation | 0.00 | 0.09 | 1.0149 | 1.0149 | |||||
| AR / Antero Resources Corporation | 0.00 | -32.41 | 0.09 | -32.61 | 1.0141 | -0.3392 | |||
| LAZ / Lazard, Inc. | 0.00 | -70.02 | 0.09 | -71.47 | 1.0139 | 0.0164 | |||
| LITE / Lumentum Holdings Inc. | 0.00 | -38.15 | 0.09 | -6.12 | 1.0090 | 0.0478 | |||
| BANR / Banner Corporation | 0.00 | -57.83 | 0.09 | -16.36 | 1.0046 | -0.3564 | |||
| AUB / Atlantic Union Bankshares Corporation | 0.00 | -57.90 | 0.09 | -62.45 | 1.0046 | 0.0303 | |||
| MZTI / The Marzetti Company | 0.00 | -16.04 | 0.09 | -17.12 | 1.0034 | -0.0841 | |||
| MTDR / Matador Resources Company | 0.00 | -19.54 | 0.09 | -24.58 | 0.9720 | -0.1901 | |||
| STAG / STAG Industrial, Inc. | 0.00 | -23.14 | 0.09 | -22.61 | 0.9683 | -0.1586 | |||
| PLYM / Plymouth Industrial REIT, Inc. | 0.01 | -14.53 | 0.09 | -15.84 | 0.9257 | -0.0619 | |||
| AXTA / Axalta Coating Systems Ltd. | 0.00 | -16.03 | 0.08 | -25.00 | 0.9215 | -0.1801 | |||
| ALK / Alaska Air Group, Inc. | 0.00 | -15.40 | 0.08 | -15.46 | 0.9013 | -0.0509 | |||
| EPAC / Enerpac Tool Group Corp. | 0.00 | -15.60 | 0.08 | -23.58 | 0.8853 | -0.1570 | |||
| NWE / NorthWestern Energy Group, Inc. | 0.00 | -43.98 | 0.07 | -41.46 | 0.7922 | -0.7311 | |||
| ACVA / ACV Auctions Inc. | 0.00 | -16.01 | 0.07 | -2.78 | 0.7626 | 0.0540 | |||
| AESI / Atlas Energy Solutions Inc. | 0.00 | -16.03 | 0.06 | -36.46 | 0.6635 | -0.2837 | |||
| SFM / Sprouts Farmers Market, Inc. | 0.00 | -62.32 | 0.06 | -59.73 | 0.6625 | -0.8021 | |||
| ALGT / Allegiant Travel Company | 0.00 | -47.53 | 0.05 | -44.58 | 0.5074 | -0.3092 | |||
| IWM / iShares Trust - iShares Russell 2000 ETF | 0.00 | -51.47 | 0.05 | -52.58 | 0.5046 | 0.1993 | |||
| HBI / Hanesbrands Inc. | 0.00 | -100.00 | 0.00 | -100.00 | -1.0112 | ||||
| HBI / Hanesbrands Inc. | 0.00 | -100.00 | 0.00 | -100.00 | -1.0112 |