Mga Batayang Estadistika
| Nilai Portofolio | $ 96,481,205 |
| Posisi Saat Ini | 107 |
Kepemilikan Terbaru, Kinerja, AUM (dari 13F, 13D)
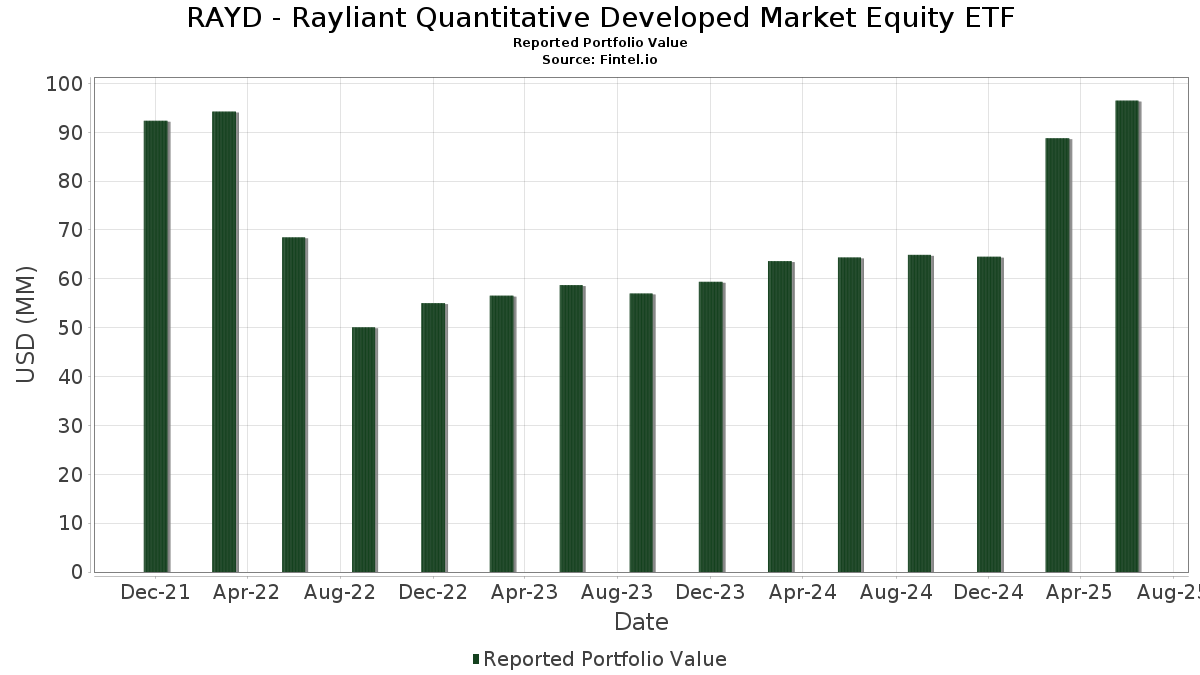
RAYD - Rayliant Quantitative Developed Market Equity ETF telah mengungkapkan total kepemilikan 107 dalam pengajuan SEC terbaru mereka. Nilai portofolio terbaru dihitung sebesar $ 96,481,205 USD. Aset yang Dikelola (AUM) sebenarnya adalah nilai ini ditambah kas (yang tidak diungkapkan). Aset-aset utama RAYD - Rayliant Quantitative Developed Market Equity ETF adalah NVIDIA Corporation (US:NVDA) , Microsoft Corporation (US:MSFT) , Amazon.com, Inc. (US:AMZN) , Alphabet Inc. (US:GOOGL) , and AT&T Inc. (US:T) . Posisi baru RAYD - Rayliant Quantitative Developed Market Equity ETF meliputi: The Toronto-Dominion Bank (US:TD) , Sanwa Holdings Corporation (DE:XST) , Encompass Health Corporation (US:EHC) , GE Vernova Inc. (US:GEV) , and Intuit Inc. (US:INTU) .
Peningkatan Tertinggi Kuartal Ini
Kami menggunakan perubahan dalam alokasi portofolio karena ini adalah metrik yang paling bermakna. Perubahan dapat disebabkan oleh perdagangan atau perubahan harga saham.
| Keamanan | Saham (MM) |
Nilai (Juta Dolar AS) |
Portfolio % | ΔPorsyento ng Portfolio |
|---|---|---|---|---|
| 0.04 | 2.51 | 2.5893 | 2.2340 | |
| 0.03 | 1.98 | 2.0452 | 2.0452 | |
| 0.04 | 6.17 | 6.3706 | 2.0383 | |
| 0.06 | 1.96 | 2.0242 | 2.0242 | |
| 0.02 | 1.96 | 2.0227 | 2.0227 | |
| 0.00 | 1.95 | 2.0095 | 2.0095 | |
| 0.00 | 1.87 | 1.9279 | 1.9279 | |
| 0.04 | 1.84 | 1.9001 | 1.9001 | |
| 0.02 | 1.79 | 1.8472 | 1.8472 | |
| 0.00 | 1.43 | 1.4708 | 1.4708 |
Penurunan Tertinggi Kuartal Ini
Kami menggunakan perubahan dalam alokasi portofolio karena ini adalah metrik yang paling bermakna. Perubahan dapat disebabkan oleh perdagangan atau perubahan harga saham.
| Keamanan | Saham (MM) |
Nilai (Juta Dolar AS) |
Portfolio % | ΔPorsyento ng Portfolio |
|---|---|---|---|---|
| 0.01 | 2.17 | 2.2369 | -3.8138 | |
| 0.02 | 0.66 | 0.6807 | -1.2692 | |
| 0.20 | 1.04 | 1.0684 | -1.2065 | |
| 0.00 | 0.20 | 0.2078 | -1.0412 | |
| 0.08 | 1.03 | 1.0591 | -0.8943 | |
| 0.00 | 0.46 | 0.4700 | -0.8273 | |
| 0.00 | 0.27 | 0.2836 | -0.6428 | |
| 0.02 | 0.95 | 0.9774 | -0.6413 | |
| 0.02 | 0.61 | 0.6286 | -0.4713 | |
| 0.00 | 0.24 | 0.2513 | -0.3015 |
Pengajuan 13F dan Dana
Formulir ini diajukan pada 2025-08-28 untuk periode pelaporan 2025-06-30. Klik ikon tautan untuk melihat riwayat transaksi selengkapnya.
Tingkatkan ke versi premium untuk membuka data premium dan ekspor ke Excel. ![]() .
.
| Keamanan | Ketik | Harga Saham Rata-rata | Saham (MM) |
ΔSaham (%) |
ΔSaham (%) |
Nilai ($MM) |
Portpolyo (%) |
ΔPortofolio (%) |
|
|---|---|---|---|---|---|---|---|---|---|
| NVDA / NVIDIA Corporation | 0.04 | 9.58 | 6.17 | 59.76 | 6.3706 | 2.0383 | |||
| MSFT / Microsoft Corporation | 0.01 | -0.48 | 5.22 | 31.88 | 5.3881 | 0.9494 | |||
| AMZN / Amazon.com, Inc. | 0.02 | 7.06 | 3.58 | 23.46 | 3.6932 | 0.4435 | |||
| GOOGL / Alphabet Inc. | 0.01 | 5.61 | 2.56 | 20.32 | 2.6406 | 0.2572 | |||
| T / AT&T Inc. | 0.09 | 125.45 | 2.53 | 130.78 | 2.6156 | 1.3841 | |||
| CSCO / Cisco Systems, Inc. | 0.04 | 689.48 | 2.51 | 1,000.44 | 2.5893 | 2.2340 | |||
| PM / Philip Morris International Inc. | 0.01 | -8.45 | 2.26 | 5.08 | 2.3283 | -0.0795 | |||
| AAPL / Apple Inc. | 0.01 | -56.52 | 2.17 | -59.85 | 2.2369 | -3.8138 | |||
| EXEL / Exelixis, Inc. | 0.05 | -13.42 | 2.02 | 3.33 | 2.0832 | -0.1063 | |||
| TD / The Toronto-Dominion Bank | 0.03 | 1.98 | 2.0452 | 2.0452 | |||||
| XST / Sanwa Holdings Corporation | 0.06 | 1.96 | 2.0242 | 2.0242 | |||||
| EHC / Encompass Health Corporation | 0.02 | 1.96 | 2.0227 | 2.0227 | |||||
| GILD / Gilead Sciences, Inc. | 0.02 | 4.79 | 1.96 | 3.71 | 2.0176 | -0.0962 | |||
| GEV / GE Vernova Inc. | 0.00 | 1.95 | 2.0095 | 2.0095 | |||||
| INTU / Intuit Inc. | 0.00 | 1.87 | 1.9279 | 1.9279 | |||||
| 6532 / Baycurrent, Inc. | 0.04 | 1.84 | 1.9001 | 1.9001 | |||||
| RBRK / Rubrik, Inc. | 0.02 | 1.79 | 1.8472 | 1.8472 | |||||
| SFM / Sprouts Farmers Market, Inc. | 0.01 | 224.44 | 1.77 | 249.90 | 1.8317 | 1.2631 | |||
| EXLS / ExlService Holdings, Inc. | 0.04 | 304.95 | 1.70 | 275.83 | 1.7494 | 1.2434 | |||
| IAG / International Consolidated Airlines Group S.A. | 0.36 | -24.60 | 1.69 | 4.71 | 1.7434 | -0.0649 | |||
| TPR / Tapestry, Inc. | 0.02 | 131.22 | 1.61 | 188.51 | 1.6583 | 1.0336 | |||
| BMY / Bristol-Myers Squibb Company | 0.03 | 273.65 | 1.47 | 206.26 | 1.5145 | 0.7648 | |||
| MCK / McKesson Corporation | 0.00 | 1.43 | 1.4708 | 1.4708 | |||||
| ANET / Arista Networks Inc | 0.01 | 100.11 | 1.33 | 164.67 | 1.3688 | 0.8061 | |||
| LLY / Eli Lilly and Company | 0.00 | 1.49 | 1.28 | -4.20 | 1.3193 | -0.1769 | |||
| CVS / CVS Health Corporation | 0.02 | 202.72 | 1.14 | 201.85 | 1.1783 | 0.5377 | |||
| ALSN / Allison Transmission Holdings, Inc. | 0.01 | 211.50 | 1.07 | 209.28 | 1.1017 | 0.7147 | |||
| EVN / Evolution Mining Limited | 0.20 | -55.72 | 1.04 | -48.99 | 1.0684 | -1.2065 | |||
| 5 / HSBC Holdings plc | 0.08 | -44.78 | 1.03 | -41.10 | 1.0591 | -0.8943 | |||
| BK / The Bank of New York Mellon Corporation | 0.01 | 157.96 | 1.01 | 180.78 | 1.0402 | 0.6370 | |||
| HAL / HAL Trust | 0.01 | 63.19 | 0.97 | 82.74 | 1.0055 | 0.4079 | |||
| MO / Altria Group, Inc. | 0.02 | -32.85 | 0.95 | -34.37 | 0.9774 | -0.6413 | |||
| NFG / National Fuel Gas Company | 0.01 | 0.93 | 0.9617 | 0.9617 | |||||
| MDT / Medtronic plc | 0.01 | 0.89 | 0.9177 | 0.9177 | |||||
| FTNT / Fortinet, Inc. | 0.01 | -1.81 | 0.88 | 7.83 | 0.9098 | -0.0067 | |||
| CART / Maplebear Inc. | 0.02 | 244.02 | 0.87 | 290.58 | 0.8989 | 0.6486 | |||
| NET / Cloudflare, Inc. | 0.00 | 0.86 | 0.8880 | 0.8880 | |||||
| CI / The Cigna Group | 0.00 | 8.37 | 0.84 | 8.83 | 0.8655 | 0.0021 | |||
| RYSD / NatWest Group plc | 0.11 | -1.24 | 0.77 | 18.83 | 0.7946 | 0.0673 | |||
| NDB / Nordea Bank Abp | 0.05 | 0.75 | 0.7756 | 0.7756 | |||||
| BCLYF / Barclays PLC | 0.16 | -31.91 | 0.75 | -15.32 | 0.7705 | -0.2174 | |||
| 3AG1 / SoftBank Corp. | 0.47 | 0.73 | 0.7542 | 0.7542 | |||||
| RBLX / Roblox Corporation | 0.01 | -3.75 | 0.72 | 73.97 | 0.7380 | 0.2765 | |||
| NNN / NNN REIT, Inc. | 0.02 | 0.71 | 0.7340 | 0.7340 | |||||
| VRSK / Verisk Analytics, Inc. | 0.00 | 67.03 | 0.66 | 94.40 | 0.6808 | 0.1601 | |||
| DTE / Deutsche Telekom AG | 0.02 | -61.44 | 0.66 | -62.10 | 0.6807 | -1.2692 | |||
| VEEV / Veeva Systems Inc. | 0.00 | 36.23 | 0.66 | 69.41 | 0.6805 | 0.2441 | |||
| GLE / Société Générale Société anonyme | 0.01 | 2.45 | 0.66 | 30.56 | 0.6793 | 0.1142 | |||
| LRCX / Lam Research Corporation | 0.01 | 0.63 | 0.6470 | 0.6470 | |||||
| CAH / Cardinal Health, Inc. | 0.00 | 38.79 | 0.62 | 137.69 | 0.6383 | 0.2369 | |||
| DASH / DoorDash, Inc. | 0.00 | 23.47 | 0.61 | 66.76 | 0.6316 | 0.2196 | |||
| FTI / TechnipFMC plc | 0.02 | -42.87 | 0.61 | -37.92 | 0.6286 | -0.4713 | |||
| NYT / The New York Times Company | 0.01 | 235.46 | 0.58 | 268.59 | 0.5940 | 0.3524 | |||
| UGI / UGI Corporation | 0.02 | 449.48 | 0.55 | 521.35 | 0.5714 | 0.3958 | |||
| V / Visa Inc. | 0.00 | 42.22 | 0.54 | 83.85 | 0.5529 | 0.1058 | |||
| G / Assicurazioni Generali S.p.A. | 0.01 | 199.96 | 0.53 | 268.06 | 0.5470 | 0.3258 | |||
| DUOL / Duolingo, Inc. | 0.00 | 61.13 | 0.53 | 113.41 | 0.5420 | 0.2653 | |||
| OHI / Omega Healthcare Investors, Inc. | 0.01 | 0.51 | 0.5249 | 0.5249 | |||||
| BEAN / BELIMO Holding AG | 0.00 | 0.50 | 0.5122 | 0.5122 | |||||
| ADBE / Adobe Inc. | 0.00 | 62.28 | 0.47 | 24.54 | 0.4879 | -0.1027 | |||
| PEN / Penumbra, Inc. | 0.00 | 0.47 | 0.4815 | 0.4815 | |||||
| IMB / Imperial Brands PLC | 0.01 | 87.86 | 0.46 | 100.44 | 0.4717 | 0.2158 | |||
| LOW / Lowe's Companies, Inc. | 0.00 | -58.63 | 0.46 | -60.67 | 0.4700 | -0.8273 | |||
| KVUE / Kenvue Inc. | 0.02 | 0.43 | 0.4473 | 0.4473 | |||||
| DSN / Danske Bank A/S | 0.01 | 187.63 | 0.43 | 315.53 | 0.4426 | 0.2805 | |||
| BRO / Brown & Brown, Inc. | 0.00 | 0.42 | 0.4295 | 0.4295 | |||||
| ZS / Zscaler, Inc. | 0.00 | 120.83 | 0.40 | 116.13 | 0.4156 | 0.2136 | |||
| CNC / Centene Corporation | 0.01 | 318.93 | 0.40 | 243.10 | 0.4116 | 0.2326 | |||
| ATO / Atmos Energy Corporation | 0.00 | 0.38 | 0.3961 | 0.3961 | |||||
| VLTO / Veralto Corporation | 0.00 | -1.62 | 0.37 | 1.66 | 0.3797 | -0.0250 | |||
| BSX / Boston Scientific Corporation | 0.00 | 0.36 | 0.3716 | 0.3716 | |||||
| CARR / Carrier Global Corporation | 0.00 | 0.35 | 0.3609 | 0.3609 | |||||
| PWCDF / Power Corporation of Canada | 0.01 | -19.27 | 0.34 | 1.48 | 0.3534 | 0.0028 | |||
| PLTR / Palantir Technologies Inc. | 0.00 | -58.54 | 0.33 | -33.13 | 0.3382 | -0.2104 | |||
| K72807140 / ORDINARY SHARES | 0.00 | -0.41 | 0.32 | 1.26 | 0.3319 | -0.0241 | |||
| VRSN / VeriSign, Inc. | 0.00 | -5.54 | 0.32 | 7.38 | 0.3305 | -0.0036 | |||
| ACA / Crédit Agricole S.A. | 0.02 | 11.05 | 0.31 | 15.50 | 0.3240 | 0.0195 | |||
| TEAM / Atlassian Corporation | 0.00 | 17.29 | 0.31 | 50.24 | 0.3213 | 0.0031 | |||
| SVHH / Svenska Handelsbanken AB (publ) | 0.02 | 0.30 | 0.3144 | 0.3144 | |||||
| BAM / Brookfield Asset Management Ltd. | 0.01 | 0.30 | 0.3136 | 0.3136 | |||||
| 6857 / Advantest Corporation | 0.00 | -28.77 | 0.30 | 21.29 | 0.3121 | 0.0328 | |||
| DSFIR / DSM-Firmenich AG | 0.00 | 40.60 | 0.30 | 7.94 | 0.3090 | -0.1162 | |||
| BJ / BJ's Wholesale Club Holdings, Inc. | 0.00 | 0.29 | 0.3011 | 0.3011 | |||||
| ZM / Zoom Communications Inc. | 0.00 | 0.29 | 0.2983 | 0.2983 | |||||
| CHKP / Check Point Software Technologies Ltd. | 0.00 | 0.28 | 0.2893 | 0.2893 | |||||
| KPN / Koninklijke KPN N.V. | 0.06 | -3.69 | 0.27 | 10.48 | 0.2837 | 0.0048 | |||
| MA / Mastercard Incorporated | 0.00 | -60.05 | 0.27 | -54.64 | 0.2836 | -0.6428 | |||
| TW / Tradeweb Markets Inc. | 0.00 | 0.27 | 0.2739 | 0.2739 | |||||
| XRO / Xero Limited | 0.00 | 22.83 | 0.25 | 50.60 | 0.2617 | 0.0723 | |||
| 5020 / ENEOS Holdings, Inc. | 0.05 | 25.09 | 0.25 | 18.40 | 0.2595 | 0.0214 | |||
| EBAY / eBay Inc. | 0.00 | -55.08 | 0.24 | -50.71 | 0.2513 | -0.3015 | |||
| ASI1 / ASICS Corporation | 0.01 | 3.54 | 0.24 | 26.04 | 0.2498 | 0.0335 | |||
| NN / NN Group N.V. | 0.00 | -3.88 | 0.24 | 14.76 | 0.2492 | 0.0137 | |||
| EMA / Emera Incorporated | 0.01 | 0.24 | 0.2445 | 0.2445 | |||||
| KOG / Kongsberg Gruppen ASA | 0.01 | 0.24 | 0.2429 | 0.2429 | |||||
| SUN / Suncorp Group Limited | 0.02 | 0.23 | 0.2396 | 0.2396 | |||||
| 1N8 / Adyen N.V. | 0.00 | 0.23 | 0.2379 | 0.2379 | |||||
| MT / ArcelorMittal S.A. | 0.01 | -1.46 | 0.23 | 8.65 | 0.2335 | 0.0002 | |||
| 3P7 / Pandora A/S | 0.00 | 2.20 | 0.22 | 17.74 | 0.2260 | 0.0165 | |||
| SRG / Snam S.p.A. | 0.03 | -14.79 | 0.21 | -11.76 | 0.2171 | -0.0305 | |||
| BOF / BOC Hong Kong (Holdings) Limited | 0.05 | -2.98 | 0.20 | 4.64 | 0.2096 | -0.0084 | |||
| MSI / Motorola Solutions, Inc. | 0.00 | -81.18 | 0.20 | -81.96 | 0.2078 | -1.0412 | |||
| ENR / Siemens Energy AG | 0.00 | -77.78 | 0.20 | -55.98 | 0.2015 | -0.2961 | |||
| ERCB / Telefonaktiebolaget LM Ericsson (publ) | 0.02 | -0.47 | 0.19 | 9.77 | 0.1971 | 0.0012 | |||
| H / Hydro One Limited | 0.01 | 0.19 | 0.1967 | 0.1967 | |||||
| AEM / Agnico Eagle Mines Limited | 0.00 | 0.14 | 0.1459 | 0.1459 | |||||
| CA21037X1345 / CONSTELLATION SOFTWARE INC | 0.00 | 0.00 | 0.00 | 0.0000 | 0.0000 | ||||
| FX Forward Contract: USD/JPY SETTLE 2025-07-01 / DFE (N/A) | 0.00 | -0.0000 | -0.0000 | ||||||
| FX Forward Contract: USD/JPY SETTLE 2025-07-01 / DFE (N/A) | -0.00 | -0.0000 | -0.0000 |