Mga Batayang Estadistika
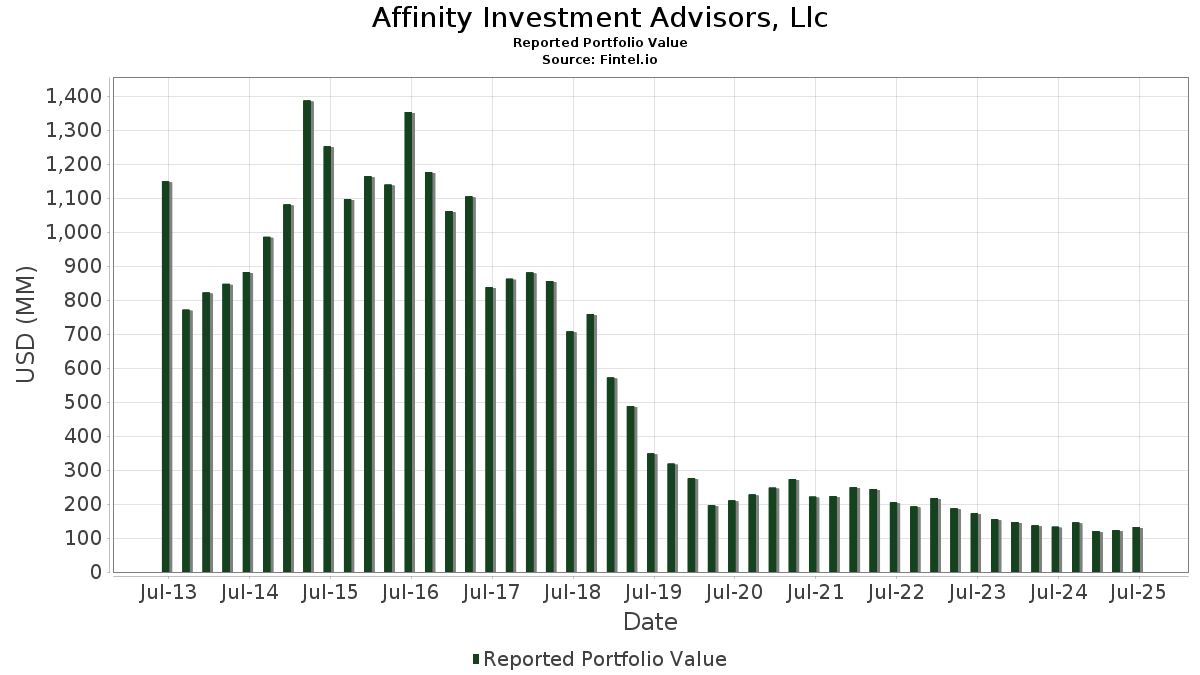
| Nilai Portofolio | $ 132,093,508 |
| Posisi Saat Ini | 133 |
Kepemilikan Terbaru, Kinerja, AUM (dari 13F, 13D)
Affinity Investment Advisors, Llc telah mengungkapkan total kepemilikan 133 dalam pengajuan SEC terbaru mereka. Nilai portofolio terbaru dihitung sebesar $ 132,093,508 USD. Aset yang Dikelola (AUM) sebenarnya adalah nilai ini ditambah kas (yang tidak diungkapkan). Aset-aset utama Affinity Investment Advisors, Llc adalah Microsoft Corporation (US:MSFT) , JPMorgan Chase & Co. (US:JPM) , Cisco Systems, Inc. (US:CSCO) , Jabil Inc. (US:JBL) , and Bank of America Corporation (US:BAC) . Posisi baru Affinity Investment Advisors, Llc meliputi: Corning Incorporated (US:GLW) , Carvana Co. (US:CVNA) , Charter Communications, Inc. (US:CHTR) , Zoom Communications Inc. (US:ZM) , and Howmet Aerospace Inc. (US:HWM) .
Peningkatan Tertinggi Kuartal Ini
Kami menggunakan perubahan dalam alokasi portofolio karena ini adalah metrik yang paling bermakna. Perubahan dapat disebabkan oleh perdagangan atau perubahan harga saham.
| Keamanan | Saham (MM) |
Nilai (Juta Dolar AS) |
Portfolio % | ΔPorsyento ng Portfolio |
|---|---|---|---|---|
| 0.01 | 3.11 | 2.3581 | 1.7836 | |
| 0.05 | 3.18 | 2.4111 | 1.2369 | |
| 0.03 | 1.49 | 1.1256 | 1.1256 | |
| 0.00 | 1.47 | 1.1130 | 1.1130 | |
| 0.02 | 2.30 | 1.7430 | 1.0289 | |
| 0.03 | 2.67 | 2.0209 | 0.9513 | |
| 0.01 | 2.10 | 1.5927 | 0.8083 | |
| 0.00 | 1.04 | 0.7863 | 0.7863 | |
| 0.01 | 6.36 | 4.8177 | 0.7844 | |
| 0.01 | 1.35 | 1.0248 | 0.7283 |
Penurunan Tertinggi Kuartal Ini
Kami menggunakan perubahan dalam alokasi portofolio karena ini adalah metrik yang paling bermakna. Perubahan dapat disebabkan oleh perdagangan atau perubahan harga saham.
| Keamanan | Saham (MM) |
Nilai (Juta Dolar AS) |
Portfolio % | ΔPorsyento ng Portfolio |
|---|---|---|---|---|
| 0.00 | 0.55 | 0.4131 | -1.4627 | |
| 0.00 | 2.06 | 1.5601 | -0.8041 | |
| 0.01 | 2.82 | 2.1335 | -0.6658 | |
| 0.00 | 0.42 | 0.3185 | -0.6444 | |
| 0.00 | 0.40 | 0.3044 | -0.5942 | |
| 0.01 | 0.77 | 0.5855 | -0.5444 | |
| 0.02 | 2.60 | 1.9706 | -0.4491 | |
| 0.03 | 1.88 | 1.4205 | -0.4140 | |
| 0.01 | 0.26 | 0.1977 | -0.3590 | |
| 0.01 | 1.70 | 1.2859 | -0.3258 |
Pengajuan 13F dan Dana
Formulir ini diajukan pada 2025-08-14 untuk periode pelaporan 2025-06-30. Klik ikon tautan untuk melihat riwayat transaksi selengkapnya.
Tingkatkan ke versi premium untuk membuka data premium dan ekspor ke Excel. ![]() .
.
| Keamanan | Ketik | Harga Saham Rata-rata | Saham (MM) |
ΔSaham (%) |
ΔSaham (%) |
Nilai ($MM) |
Portpolyo (%) |
ΔPortofolio (%) |
|
|---|---|---|---|---|---|---|---|---|---|
| MSFT / Microsoft Corporation | 0.01 | -3.01 | 6.36 | 28.52 | 4.8177 | 0.7844 | |||
| JPM / JPMorgan Chase & Co. | 0.01 | -4.37 | 4.29 | 13.04 | 3.2493 | 0.1562 | |||
| CSCO / Cisco Systems, Inc. | 0.05 | 96.51 | 3.18 | 120.96 | 2.4111 | 1.2369 | |||
| JBL / Jabil Inc. | 0.01 | 175.50 | 3.11 | 341.70 | 2.3581 | 1.7836 | |||
| BAC / Bank of America Corporation | 0.06 | -2.67 | 2.83 | 10.34 | 2.1424 | 0.0538 | |||
| AAPL / Apple Inc. | 0.01 | -11.22 | 2.82 | -17.99 | 2.1335 | -0.6658 | |||
| AVGO / Broadcom Inc. | 0.01 | -9.74 | 2.80 | 48.59 | 2.1185 | 0.5847 | |||
| TPR / Tapestry, Inc. | 0.03 | 63.00 | 2.67 | 103.27 | 2.0209 | 0.9513 | |||
| XOM / Exxon Mobil Corporation | 0.02 | -3.33 | 2.60 | -12.36 | 1.9706 | -0.4491 | |||
| NVDA / NVIDIA Corporation | 0.02 | -12.40 | 2.46 | 27.71 | 1.8636 | 0.2935 | |||
| STX / Seagate Technology Holdings plc | 0.02 | 54.57 | 2.30 | 162.79 | 1.7430 | 1.0289 | |||
| IBM / International Business Machines Corporation | 0.01 | -5.43 | 2.26 | 12.13 | 1.7074 | 0.0689 | |||
| RTX / RTX Corporation | 0.01 | 98.18 | 2.10 | 118.61 | 1.5927 | 0.8083 | |||
| GILD / Gilead Sciences, Inc. | 0.02 | 45.25 | 2.10 | 43.70 | 1.5890 | 0.3995 | |||
| URI / United Rentals, Inc. | 0.00 | -2.33 | 2.08 | 17.43 | 1.5765 | 0.1319 | |||
| META / Meta Platforms, Inc. | 0.00 | -44.56 | 2.06 | -29.01 | 1.5601 | -0.8041 | |||
| KR / The Kroger Co. | 0.03 | -21.38 | 1.88 | -16.70 | 1.4205 | -0.4140 | |||
| GS / The Goldman Sachs Group, Inc. | 0.00 | 0.00 | 1.77 | 29.51 | 1.3427 | 0.2276 | |||
| CMCSA / Comcast Corporation | 0.05 | 13.29 | 1.71 | 9.60 | 1.2973 | 0.0235 | |||
| GOOGL / Alphabet Inc. | 0.01 | -9.59 | 1.70 | 3.02 | 1.2896 | -0.0570 | |||
| ABBV / AbbVie Inc. | 0.01 | -3.10 | 1.70 | -14.16 | 1.2859 | -0.3258 | |||
| VZ / Verizon Communications Inc. | 0.04 | 8.22 | 1.68 | 3.20 | 1.2709 | -0.0536 | |||
| AMP / Ameriprise Financial, Inc. | 0.00 | -9.04 | 1.68 | 0.30 | 1.2691 | -0.0924 | |||
| MO / Altria Group, Inc. | 0.03 | -11.72 | 1.65 | -13.73 | 1.2462 | -0.3086 | |||
| NEM / Newmont Corporation | 0.03 | -0.41 | 1.64 | 20.12 | 1.2392 | 0.1298 | |||
| DAL / Delta Air Lines, Inc. | 0.03 | -4.60 | 1.56 | 7.57 | 1.1839 | 0.0002 | |||
| DRI / Darden Restaurants, Inc. | 0.01 | -5.10 | 1.55 | -0.45 | 1.1770 | -0.0948 | |||
| PFE / Pfizer Inc. | 0.06 | 11.39 | 1.55 | 6.54 | 1.1718 | -0.0114 | |||
| T / AT&T Inc. | 0.05 | 90.36 | 1.51 | 94.85 | 1.1451 | 0.5127 | |||
| GLW / Corning Incorporated | 0.03 | 1.49 | 1.1256 | 1.1256 | |||||
| CVNA / Carvana Co. | 0.00 | 1.47 | 1.1130 | 1.1130 | |||||
| VLO / Valero Energy Corporation | 0.01 | 7.19 | 1.44 | 9.17 | 1.0902 | 0.0151 | |||
| WFC / Wells Fargo & Company | 0.02 | -7.22 | 1.41 | 3.52 | 1.0702 | -0.0419 | |||
| PM / Philip Morris International Inc. | 0.01 | -21.79 | 1.41 | -10.28 | 1.0639 | -0.2117 | |||
| SPG / Simon Property Group, Inc. | 0.01 | 1.80 | 1.38 | -1.43 | 1.0413 | -0.0957 | |||
| TWLO / Twilio Inc. | 0.01 | 192.76 | 1.35 | 271.70 | 1.0248 | 0.7283 | |||
| QCOM / QUALCOMM Incorporated | 0.01 | -3.11 | 1.34 | 0.45 | 1.0109 | -0.0718 | |||
| CVS / CVS Health Corporation | 0.02 | 136.03 | 1.32 | 140.73 | 1.0023 | 0.5536 | |||
| CAT / Caterpillar Inc. | 0.00 | -10.25 | 1.32 | 5.71 | 0.9957 | -0.0184 | |||
| CI / The Cigna Group | 0.00 | 27.68 | 1.31 | 28.25 | 0.9938 | 0.1604 | |||
| MRK / Merck & Co., Inc. | 0.02 | -1.57 | 1.29 | -13.22 | 0.9749 | -0.2335 | |||
| BBY / Best Buy Co., Inc. | 0.02 | 4.22 | 1.24 | -4.92 | 0.9359 | -0.1235 | |||
| AGG / iShares Trust - iShares Core U.S. Aggregate Bond ETF | 0.01 | 0.00 | 1.18 | 0.26 | 0.8929 | -0.0651 | |||
| AMGN / Amgen Inc. | 0.00 | -6.35 | 1.14 | -16.04 | 0.8641 | -0.2436 | |||
| DKS / DICK'S Sporting Goods, Inc. | 0.01 | -3.01 | 1.05 | -4.82 | 0.7920 | -0.1032 | |||
| COF / Capital One Financial Corporation | 0.00 | 1.04 | 0.7863 | 0.7863 | |||||
| BK / The Bank of New York Mellon Corporation | 0.01 | -6.94 | 1.04 | 1.07 | 0.7846 | -0.0504 | |||
| EXC / Exelon Corporation | 0.02 | -16.18 | 1.00 | -20.98 | 0.7587 | -0.2748 | |||
| UNM / Unum Group | 0.01 | -0.18 | 0.98 | -1.02 | 0.7383 | -0.0644 | |||
| PKG / Packaging Corporation of America | 0.01 | -5.70 | 0.97 | -10.31 | 0.7317 | -0.1455 | |||
| APP / AppLovin Corporation | 0.00 | -39.56 | 0.96 | -20.13 | 0.7272 | -0.2526 | |||
| CEG / Constellation Energy Corporation | 0.00 | -1.41 | 0.90 | 57.79 | 0.6824 | 0.2172 | |||
| PPL / PPL Corporation | 0.03 | -16.47 | 0.90 | -21.63 | 0.6783 | -0.2526 | |||
| MS / Morgan Stanley | 0.01 | -6.83 | 0.88 | 12.47 | 0.6695 | 0.0292 | |||
| HST / Host Hotels & Resorts, Inc. | 0.05 | 28.11 | 0.84 | 38.49 | 0.6381 | 0.1423 | |||
| LMT / Lockheed Martin Corporation | 0.00 | 169.07 | 0.83 | 179.12 | 0.6283 | 0.3860 | |||
| APH / Amphenol Corporation | 0.01 | -9.86 | 0.83 | 35.69 | 0.6253 | 0.1296 | |||
| PHM / PulteGroup, Inc. | 0.01 | 0.00 | 0.79 | 2.61 | 0.5946 | -0.0290 | |||
| DELL / Dell Technologies Inc. | 0.01 | -58.55 | 0.77 | -44.27 | 0.5855 | -0.5444 | |||
| GEN / Gen Digital Inc. | 0.03 | 7.08 | 0.76 | 18.63 | 0.5789 | 0.0538 | |||
| EBAY / eBay Inc. | 0.01 | -2.32 | 0.75 | 7.32 | 0.5670 | -0.0011 | |||
| RCL / Royal Caribbean Cruises Ltd. | 0.00 | -16.47 | 0.73 | 27.30 | 0.5542 | 0.0859 | |||
| NRG / NRG Energy, Inc. | 0.00 | 76.35 | 0.72 | 197.52 | 0.5456 | 0.3477 | |||
| PNC / The PNC Financial Services Group, Inc. | 0.00 | 3.20 | 0.72 | 9.33 | 0.5419 | 0.0092 | |||
| CHTR / Charter Communications, Inc. | 0.00 | 0.71 | 0.5379 | 0.5379 | |||||
| ED / Consolidated Edison, Inc. | 0.01 | 0.00 | 0.70 | -9.23 | 0.5287 | -0.0982 | |||
| ZM / Zoom Communications Inc. | 0.01 | 0.69 | 0.5248 | 0.5248 | |||||
| SSNC / SS&C Technologies Holdings, Inc. | 0.01 | -5.46 | 0.69 | -6.25 | 0.5228 | -0.0774 | |||
| LRCX / Lam Research Corporation | 0.01 | -9.37 | 0.69 | 21.38 | 0.5202 | 0.0590 | |||
| C / Citigroup Inc. | 0.01 | -0.15 | 0.68 | 19.68 | 0.5158 | 0.0523 | |||
| DOX / Amdocs Limited | 0.01 | -3.48 | 0.68 | -3.70 | 0.5122 | -0.0604 | |||
| ACGL / Arch Capital Group Ltd. | 0.01 | -15.79 | 0.67 | -20.26 | 0.5037 | -0.1761 | |||
| BMY / Bristol-Myers Squibb Company | 0.01 | -3.24 | 0.65 | -26.50 | 0.4914 | -0.2285 | |||
| CMI / Cummins Inc. | 0.00 | 0.05 | 0.63 | 4.45 | 0.4805 | -0.0140 | |||
| HWM / Howmet Aerospace Inc. | 0.00 | 0.60 | 0.4565 | 0.4565 | |||||
| LOW / Lowe's Companies, Inc. | 0.00 | -9.46 | 0.59 | -13.91 | 0.4501 | -0.1122 | |||
| ALL / The Allstate Corporation | 0.00 | 12.25 | 0.57 | 8.97 | 0.4330 | 0.0061 | |||
| KLAC / KLA Corporation | 0.00 | 0.00 | 0.57 | 32.01 | 0.4279 | 0.0785 | |||
| CNC / Centene Corporation | 0.01 | 15.41 | 0.56 | 3.13 | 0.4253 | -0.0181 | |||
| UNH / UnitedHealth Group Incorporated | 0.00 | -60.22 | 0.55 | -76.32 | 0.4131 | -1.4627 | |||
| PGR / The Progressive Corporation | 0.00 | 0.00 | 0.52 | -5.76 | 0.3972 | -0.0560 | |||
| JNJ / Johnson & Johnson | 0.00 | 0.06 | 0.52 | -7.94 | 0.3956 | -0.0662 | |||
| ELV / Elevance Health, Inc. | 0.00 | -0.24 | 0.49 | -10.75 | 0.3713 | -0.0765 | |||
| CME / CME Group Inc. | 0.00 | 0.47 | 0.3537 | 0.3537 | |||||
| STT / State Street Corporation | 0.00 | -0.02 | 0.45 | 18.85 | 0.3438 | 0.0323 | |||
| GD / General Dynamics Corporation | 0.00 | 0.00 | 0.45 | 6.95 | 0.3383 | -0.0019 | |||
| K / Kellanova | 0.01 | 0.00 | 0.42 | -3.64 | 0.3207 | -0.0372 | |||
| AMAT / Applied Materials, Inc. | 0.00 | -71.79 | 0.42 | -64.47 | 0.3185 | -0.6444 | |||
| PPC / Pilgrim's Pride Corporation | 0.01 | 34.14 | 0.42 | 10.64 | 0.3152 | 0.0088 | |||
| ORCL / Oracle Corporation | 0.00 | 0.00 | 0.40 | 56.81 | 0.3054 | 0.0953 | |||
| NTAP / NetApp, Inc. | 0.00 | -69.95 | 0.40 | -63.55 | 0.3044 | -0.5942 | |||
| USFD / US Foods Holding Corp. | 0.00 | 0.74 | 0.38 | 18.44 | 0.2875 | 0.0265 | |||
| LNG / Cheniere Energy, Inc. | 0.00 | -0.06 | 0.38 | 5.28 | 0.2872 | -0.0066 | |||
| JCI / Johnson Controls International plc | 0.00 | 0.00 | 0.37 | 32.03 | 0.2811 | 0.0517 | |||
| CTVA / Corteva, Inc. | 0.00 | 0.37 | 0.2787 | 0.2787 | |||||
| GM / General Motors Company | 0.01 | 0.36 | 0.2762 | 0.2762 | |||||
| SNA / Snap-on Incorporated | 0.00 | 0.36 | 0.2695 | 0.2695 | |||||
| GAP / The Gap, Inc. | 0.02 | -0.03 | 0.35 | 5.79 | 0.2631 | -0.0045 | |||
| MMM / 3M Company | 0.00 | -16.15 | 0.34 | -12.98 | 0.2591 | -0.0616 | |||
| SFM / Sprouts Farmers Market, Inc. | 0.00 | 0.33 | 0.2489 | 0.2489 | |||||
| WMB / The Williams Companies, Inc. | 0.01 | -24.89 | 0.32 | -21.04 | 0.2416 | -0.0877 | |||
| TAP / Molson Coors Beverage Company | 0.01 | -7.62 | 0.32 | -27.08 | 0.2388 | -0.1132 | |||
| CAH / Cardinal Health, Inc. | 0.00 | -14.94 | 0.31 | 3.64 | 0.2374 | -0.0089 | |||
| MAS / Masco Corporation | 0.00 | 0.31 | 0.2374 | 0.2374 | |||||
| UAL / United Airlines Holdings, Inc. | 0.00 | 0.31 | 0.2356 | 0.2356 | |||||
| EXE / Expand Energy Corporation | 0.00 | 0.30 | 0.2299 | 0.2299 | |||||
| BBWI / Bath & Body Works, Inc. | 0.01 | 0.00 | 0.30 | -1.31 | 0.2282 | -0.0203 | |||
| ROK / Rockwell Automation, Inc. | 0.00 | 0.30 | 0.2271 | 0.2271 | |||||
| MCK / McKesson Corporation | 0.00 | -7.62 | 0.29 | 0.69 | 0.2219 | -0.0155 | |||
| SWK / Stanley Black & Decker, Inc. | 0.00 | 39.27 | 0.29 | 23.18 | 0.2174 | 0.0268 | |||
| LLY / Eli Lilly and Company | 0.00 | 0.00 | 0.28 | -5.72 | 0.2124 | -0.0297 | |||
| HIG / The Hartford Insurance Group, Inc. | 0.00 | 0.00 | 0.28 | 2.60 | 0.2096 | -0.0103 | |||
| AEP / American Electric Power Company, Inc. | 0.00 | 0.00 | 0.27 | -5.23 | 0.2067 | -0.0275 | |||
| CTRA / Coterra Energy Inc. | 0.01 | 0.27 | 0.2053 | 0.2053 | |||||
| KHC / The Kraft Heinz Company | 0.01 | -8.54 | 0.27 | -22.38 | 0.2023 | -0.0782 | |||
| JLL / Jones Lang LaSalle Incorporated | 0.00 | 0.00 | 0.26 | 3.13 | 0.2002 | -0.0086 | |||
| HCA / HCA Healthcare, Inc. | 0.00 | -1.16 | 0.26 | 9.62 | 0.1984 | 0.0036 | |||
| BKR / Baker Hughes Company | 0.01 | -56.20 | 0.26 | -61.79 | 0.1977 | -0.3590 | |||
| EPR / EPR Properties | 0.00 | -0.38 | 0.26 | 10.34 | 0.1940 | 0.0048 | |||
| USB / U.S. Bancorp | 0.01 | 0.00 | 0.24 | 7.14 | 0.1822 | -0.0007 | |||
| LH / Labcorp Holdings Inc. | 0.00 | 0.24 | 0.1810 | 0.1810 | |||||
| FNF / Fidelity National Financial, Inc. | 0.00 | 0.24 | 0.1804 | 0.1804 | |||||
| STLD / Steel Dynamics, Inc. | 0.00 | -0.11 | 0.23 | 2.20 | 0.1763 | -0.0092 | |||
| EME / EMCOR Group, Inc. | 0.00 | 0.23 | 0.1737 | 0.1737 | |||||
| CCL / Carnival Corporation & plc | 0.01 | -30.14 | 0.23 | 0.44 | 0.1731 | -0.0121 | |||
| ETR / Entergy Corporation | 0.00 | 0.22 | 0.1691 | 0.1691 | |||||
| DTE / DTE Energy Company | 0.00 | 0.00 | 0.21 | -4.04 | 0.1624 | -0.0200 | |||
| PYPL / PayPal Holdings, Inc. | 0.00 | 0.21 | 0.1614 | 0.1614 | |||||
| BAX / Baxter International Inc. | 0.01 | 0.00 | 0.21 | -11.25 | 0.1613 | -0.0349 | |||
| COR / Cencora, Inc. | 0.00 | -28.43 | 0.21 | -22.91 | 0.1612 | -0.0635 | |||
| SPY / SPDR S&P 500 ETF | 0.00 | 0.21 | 0.1609 | 0.1609 | |||||
| IRM / Iron Mountain Incorporated | 0.00 | 0.21 | 0.1563 | 0.1563 | |||||
| F / Ford Motor Company | 0.01 | -14.92 | 0.13 | -8.51 | 0.0983 | -0.0166 | |||
| BLDR / Builders FirstSource, Inc. | 0.00 | -100.00 | 0.00 | 0.0000 | |||||
| VTRS / Viatris Inc. | 0.00 | -100.00 | 0.00 | 0.0000 | |||||
| PH / Parker-Hannifin Corporation | 0.00 | -100.00 | 0.00 | 0.0000 | |||||
| SJM / The J. M. Smucker Company | 0.00 | -100.00 | 0.00 | 0.0000 | |||||
| DFS / Discover Financial Services | 0.00 | -100.00 | 0.00 | 0.0000 | |||||
| LOGI / Logitech International S.A. | 0.00 | -100.00 | 0.00 | 0.0000 | |||||
| BURL / Burlington Stores, Inc. | 0.00 | -100.00 | 0.00 | 0.0000 | |||||
| UHS / Universal Health Services, Inc. | 0.00 | -100.00 | 0.00 | 0.0000 | |||||
| CPNG / Coupang, Inc. | 0.00 | -100.00 | 0.00 | 0.0000 | |||||
| VRT / Vertiv Holdings Co | 0.00 | -100.00 | 0.00 | 0.0000 | |||||
| RF / Regions Financial Corporation | 0.00 | -100.00 | 0.00 | 0.0000 | |||||
| CVX / Chevron Corporation | 0.00 | -100.00 | 0.00 | 0.0000 | |||||
| CTSH / Cognizant Technology Solutions Corporation | 0.00 | -100.00 | 0.00 | 0.0000 | |||||
| GIS / General Mills, Inc. | 0.00 | -100.00 | 0.00 | 0.0000 | |||||
| MKL / Markel Group Inc. | 0.00 | -100.00 | 0.00 | 0.0000 | |||||
| DOCU / DocuSign, Inc. | 0.00 | -100.00 | 0.00 | 0.0000 | |||||
| AER / AerCap Holdings N.V. | 0.00 | -100.00 | 0.00 | 0.0000 | |||||
| PCAR / PACCAR Inc | 0.00 | -100.00 | 0.00 | 0.0000 | |||||
| TOL / Toll Brothers, Inc. | 0.00 | -100.00 | 0.00 | 0.0000 | |||||
| TROW / T. Rowe Price Group, Inc. | 0.00 | -100.00 | 0.00 | 0.0000 | |||||
| HPE / Hewlett Packard Enterprise Company | 0.00 | -100.00 | 0.00 | 0.0000 | |||||
| FI / Fiserv, Inc. | 0.00 | -100.00 | 0.00 | 0.0000 | |||||
| OMC / Omnicom Group Inc. | 0.00 | -100.00 | 0.00 | 0.0000 | |||||
| CBRE / CBRE Group, Inc. | 0.00 | -100.00 | 0.00 | 0.0000 | |||||
| OC / Owens Corning | 0.00 | -100.00 | 0.00 | 0.0000 | |||||
| FANG / Diamondback Energy, Inc. | 0.00 | -100.00 | 0.00 | 0.0000 | |||||
| IP / International Paper Company | 0.00 | -100.00 | 0.00 | 0.0000 | |||||
| BRK.B / Berkshire Hathaway Inc. | 0.00 | -100.00 | 0.00 | 0.0000 | |||||
| TEVA / Teva Pharmaceutical Industries Limited - Depositary Receipt (Common Stock) | 0.00 | -100.00 | 0.00 | 0.0000 | |||||
| THC / Tenet Healthcare Corporation | 0.00 | -100.00 | 0.00 | 0.0000 |