Mga Batayang Estadistika
| Nilai Portofolio | $ 425,250,000 |
| Posisi Saat Ini | 123 |
Kepemilikan Terbaru, Kinerja, AUM (dari 13F, 13D)
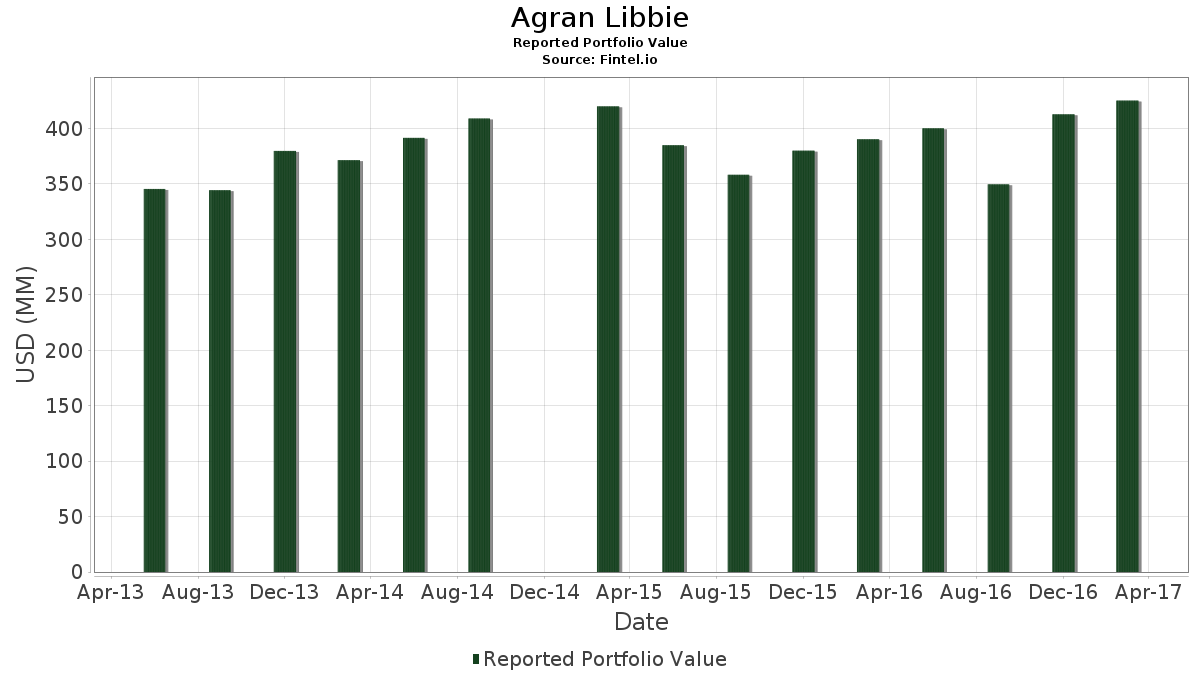
Agran Libbie telah mengungkapkan total kepemilikan 123 dalam pengajuan SEC terbaru mereka. Nilai portofolio terbaru dihitung sebesar $ 425,250,000 USD. Aset yang Dikelola (AUM) sebenarnya adalah nilai ini ditambah kas (yang tidak diungkapkan). Aset-aset utama Agran Libbie adalah Apple Inc. (US:AAPL) , Berkshire Hathaway Inc. (US:BRK.A) , Johnson & Johnson (US:JNJ) , Berkshire Hathaway Inc. (US:BRK.B) , and Meta Platforms, Inc. (US:META) . Posisi baru Agran Libbie meliputi: Pfizer Inc. (US:PFE) , Allergan plc (US:018490100) , IDEXX Laboratories, Inc. (US:IDXX) , ONEOK, Inc. (US:OKE) , and Roper Technologies, Inc. (US:ROP) .
Peningkatan Tertinggi Kuartal Ini
Kami menggunakan perubahan dalam alokasi portofolio karena ini adalah metrik yang paling bermakna. Perubahan dapat disebabkan oleh perdagangan atau perubahan harga saham.
| Keamanan | Saham (MM) |
Nilai (Juta Dolar AS) |
Portfolio % | ΔPorsyento ng Portfolio |
|---|---|---|---|---|
| 0.20 | 29.28 | 6.8851 | 1.0704 | |
| 0.02 | 3.03 | 0.7125 | 0.7125 | |
| 0.08 | 2.12 | 0.4997 | 0.4997 | |
| 0.07 | 10.61 | 2.4948 | 0.4150 | |
| 0.01 | 1.60 | 0.3753 | 0.3753 | |
| 0.15 | 8.20 | 1.9276 | 0.3298 | |
| 0.03 | 1.28 | 0.3019 | 0.3019 | |
| 0.01 | 5.82 | 1.3688 | 0.2140 | |
| 0.28 | 6.00 | 1.4105 | 0.1474 | |
| 0.01 | 0.55 | 0.1303 | 0.1303 |
Penurunan Tertinggi Kuartal Ini
Kami menggunakan perubahan dalam alokasi portofolio karena ini adalah metrik yang paling bermakna. Perubahan dapat disebabkan oleh perdagangan atau perubahan harga saham.
| Keamanan | Saham (MM) |
Nilai (Juta Dolar AS) |
Portfolio % | ΔPorsyento ng Portfolio |
|---|---|---|---|---|
| 0.00 | 0.00 | -0.5660 | ||
| 0.16 | 9.39 | 2.2091 | -0.3287 | |
| 0.09 | 4.09 | 0.9620 | -0.2875 | |
| 0.10 | 10.40 | 2.4468 | -0.2692 | |
| 0.16 | 5.22 | 1.2266 | -0.2688 | |
| 0.07 | 3.51 | 0.8263 | -0.2459 | |
| 0.16 | 7.99 | 1.8784 | -0.2135 | |
| 0.10 | 7.99 | 1.8777 | -0.1645 | |
| 0.27 | 8.03 | 1.8871 | -0.1612 | |
| 0.09 | 6.24 | 1.4667 | -0.1498 |
Pengajuan 13F dan Dana
Formulir ini diajukan pada 2017-04-27 untuk periode pelaporan 2017-03-31. Klik ikon tautan untuk melihat riwayat transaksi selengkapnya.
Tingkatkan ke versi premium untuk membuka data premium dan ekspor ke Excel. ![]() .
.
| Keamanan | Ketik | Harga Saham Rata-rata | Saham (MM) |
ΔSaham (%) |
ΔSaham (%) |
Nilai ($MM) |
Portpolyo (%) |
ΔPortofolio (%) |
|
|---|---|---|---|---|---|---|---|---|---|
| AAPL / Apple Inc. | 0.20 | -1.68 | 29.28 | 21.96 | 6.8851 | 1.0704 | |||
| BRK.A / Berkshire Hathaway Inc. | 0.00 | 0.00 | 15.49 | 2.35 | 3.6428 | -0.0232 | |||
| JNJ / Johnson & Johnson | 0.10 | -0.70 | 12.39 | 7.36 | 2.9141 | 0.1183 | |||
| BRK.B / Berkshire Hathaway Inc. | 0.07 | 0.43 | 10.94 | 2.71 | 2.5726 | -0.0071 | |||
| META / Meta Platforms, Inc. | 0.07 | 0.07 | 10.61 | 23.55 | 2.4948 | 0.4150 | |||
| V / Visa Inc. | 0.12 | -6.31 | 10.54 | 6.72 | 2.4790 | 0.0865 | |||
| CVX / Chevron Corporation | 0.10 | 1.71 | 10.40 | -7.21 | 2.4468 | -0.2692 | |||
| MSFT / Microsoft Corporation | 0.15 | 1.68 | 10.14 | 7.78 | 2.3852 | 0.1058 | |||
| D / Dominion Energy, Inc. | 0.13 | -2.96 | 10.07 | -1.72 | 2.3680 | -0.1136 | |||
| QCOM / QUALCOMM Incorporated | 0.16 | 1.94 | 9.39 | -10.35 | 2.2091 | -0.3287 | |||
| SPG / Simon Property Group, Inc. | 0.05 | 1.00 | 9.16 | -2.21 | 2.1536 | -0.1147 | |||
| EPD / Enterprise Products Partners L.P. - Limited Partnership | 0.31 | 0.45 | 8.60 | 2.56 | 2.0221 | -0.0085 | |||
| GOOGL / Alphabet Inc. | 0.01 | 2.25 | 8.53 | 9.39 | 2.0059 | 0.1172 | |||
| NEE / NextEra Energy, Inc. | 0.06 | -3.97 | 8.34 | 3.19 | 1.9617 | 0.0037 | |||
| OKS / ONEOK Partners, L.P. | 0.15 | -1.01 | 8.20 | 24.25 | 1.9276 | 0.3298 | |||
| RTX / RTX Corporation | 0.07 | -3.64 | 8.07 | -1.36 | 1.8979 | -0.0837 | |||
| GE / General Electric Company | 0.27 | 0.62 | 8.03 | -5.11 | 1.8871 | -0.1612 | |||
| VZ / Verizon Communications Inc. | 0.16 | 1.27 | 7.99 | -7.51 | 1.8784 | -0.2135 | |||
| XOM / Exxon Mobil Corporation | 0.10 | 4.22 | 7.99 | -5.30 | 1.8777 | -0.1645 | |||
| INTC / Intel Corporation | 0.22 | -2.18 | 7.77 | -2.73 | 1.8262 | -0.1075 | |||
| PEAK / Healthpeak Properties, Inc. | 0.25 | 0.29 | 7.67 | 5.56 | 1.8048 | 0.0438 | |||
| PG / The Procter & Gamble Company | 0.08 | -0.94 | 7.40 | 5.85 | 1.7397 | 0.0469 | |||
| C.WSA / Citigroup, Inc. | 0.02 | -0.29 | 7.35 | 0.49 | 1.7277 | -0.0430 | |||
| GOOG / Alphabet Inc. | 0.01 | 0.20 | 7.02 | 7.68 | 1.6510 | 0.0719 | |||
| JPM / JPMorgan Chase & Co. | 0.07 | 2.61 | 6.58 | 4.46 | 1.5485 | 0.0217 | |||
| GS / The Goldman Sachs Group, Inc. | 0.03 | 0.96 | 6.49 | -3.13 | 1.5262 | -0.0966 | |||
| COST / Costco Wholesale Corporation | 0.04 | -1.15 | 6.43 | 3.54 | 1.5125 | 0.0080 | |||
| UNP / Union Pacific Corporation | 0.06 | 0.62 | 6.36 | 2.80 | 1.4956 | -0.0029 | |||
| GILD / Gilead Sciences, Inc. | 0.09 | -1.47 | 6.24 | -6.55 | 1.4667 | -0.1498 | |||
| KMI / Kinder Morgan, Inc. | 0.28 | 9.57 | 6.00 | 15.01 | 1.4105 | 0.1474 | |||
| AMZN / Amazon.com, Inc. | 0.01 | 3.26 | 5.82 | 22.08 | 1.3688 | 0.2140 | |||
| KO / The Coca-Cola Company | 0.13 | -3.16 | 5.31 | -0.88 | 1.2496 | -0.0488 | |||
| T / AT&T Inc. | 0.13 | 2.78 | 5.30 | 0.42 | 1.2454 | -0.0320 | |||
| TEVA / Teva Pharmaceutical Industries Limited - Depositary Receipt (Common Stock) | 0.16 | -4.56 | 5.22 | -15.52 | 1.2266 | -0.2688 | |||
| VTR / Ventas, Inc. | 0.08 | 7.70 | 4.96 | 12.05 | 1.1654 | 0.0942 | |||
| CELG / Celgene Corp. | 0.04 | -0.01 | 4.68 | 7.49 | 1.1001 | 0.0460 | |||
| BA / The Boeing Company | 0.02 | -1.66 | 4.19 | 11.73 | 0.9855 | 0.0770 | |||
| BDX / Becton, Dickinson and Company | 0.02 | -1.83 | 4.13 | 8.77 | 0.9714 | 0.0515 | |||
| DCI / Donaldson Company, Inc. | 0.09 | -29.23 | 4.09 | -20.70 | 0.9620 | -0.2875 | |||
| WFC / Wells Fargo & Company | 0.07 | -8.51 | 3.91 | -7.59 | 0.9195 | -0.1053 | |||
| COP / ConocoPhillips | 0.07 | -20.19 | 3.51 | -20.62 | 0.8263 | -0.2459 | |||
| DIS / The Walt Disney Company | 0.03 | -0.14 | 3.35 | 8.63 | 0.7875 | 0.0408 | |||
| HON / Honeywell International Inc. | 0.03 | -0.59 | 3.34 | 7.15 | 0.7857 | 0.0305 | |||
| AMT / American Tower Corporation | 0.03 | -0.09 | 3.22 | 14.88 | 0.7570 | 0.0783 | |||
| ABBV / AbbVie Inc. | 0.05 | -0.11 | 3.17 | 3.93 | 0.7454 | 0.0067 | |||
| MMM / 3M Company | 0.02 | 3.03 | 0.7125 | 0.7125 | |||||
| ORCL / Oracle Corporation | 0.07 | -10.24 | 2.95 | 4.13 | 0.6935 | 0.0076 | |||
| BAC / Bank of America Corporation | 0.12 | 0.84 | 2.83 | 7.63 | 0.6667 | 0.0287 | |||
| VNO / Vornado Realty Trust | 0.03 | -3.50 | 2.62 | -7.26 | 0.6154 | -0.0681 | |||
| TSLA / Tesla, Inc. | 0.01 | -4.05 | 2.50 | 24.91 | 0.5884 | 0.1032 | |||
| US6550441058 / Noble Energy, Inc. | 0.07 | -6.76 | 2.38 | -15.88 | 0.5606 | -0.1258 | |||
| OAK / Oaktree Capital Group, LLC | 0.05 | -6.40 | 2.37 | 13.04 | 0.5564 | 0.0495 | |||
| MDLZ / Mondelez International, Inc. | 0.05 | -3.40 | 2.36 | -6.12 | 0.5559 | -0.0540 | |||
| NKE / NIKE, Inc. | 0.04 | -0.92 | 2.24 | 8.63 | 0.5267 | 0.0273 | |||
| ISRG / Intuitive Surgical, Inc. | 0.00 | 0.00 | 2.20 | 20.85 | 0.5166 | 0.0763 | |||
| GIS / General Mills, Inc. | 0.04 | -6.07 | 2.20 | -10.29 | 0.5164 | -0.0765 | |||
| PHO / Invesco Exchange-Traded Fund Trust - Invesco Water Resources ETF | 0.08 | -6.89 | 2.12 | -1.44 | 0.4997 | 0.4997 | |||
| ABT / Abbott Laboratories | 0.05 | -0.64 | 2.11 | 14.90 | 0.4969 | 0.0515 | |||
| SXL / Sunoco Logistics Partners L.P. | 0.06 | -1.52 | 2.07 | 0.44 | 0.4861 | -0.0124 | |||
| AMLP / ALPS ETF Trust - Alerian MLP ETF | 0.15 | 25.20 | 1.91 | 26.27 | 0.4487 | 0.0827 | |||
| AMAT / Applied Materials, Inc. | 0.04 | 0.00 | 1.68 | 20.56 | 0.3944 | 0.0575 | |||
| PSX / Phillips 66 | 0.02 | -4.31 | 1.62 | -12.27 | 0.3800 | -0.0661 | |||
| SO / The Southern Company | 0.03 | -16.08 | 1.60 | -15.07 | 0.3765 | -0.0801 | |||
| AVGO / Broadcom Inc. | 0.01 | 10.70 | 1.60 | 37.11 | 0.3753 | 0.3753 | |||
| BX / Blackstone Inc. | 0.05 | -1.02 | 1.58 | 8.80 | 0.3720 | 0.0199 | |||
| CSCO / Cisco Systems, Inc. | 0.05 | -1.72 | 1.55 | 9.94 | 0.3643 | 0.0230 | |||
| ATR / AptarGroup, Inc. | 0.02 | 0.00 | 1.50 | 4.82 | 0.3530 | 0.0061 | |||
| MCD / McDonald's Corporation | 0.01 | -26.33 | 1.40 | -21.53 | 0.3283 | -0.1026 | |||
| CVS / CVS Health Corporation | 0.02 | -17.81 | 1.35 | -18.25 | 0.3182 | -0.0827 | |||
| BABA / Alibaba Group Holding Limited - Depositary Receipt (Common Stock) | 0.01 | -12.18 | 1.34 | 7.86 | 0.3163 | 0.0143 | |||
| SBUX / Starbucks Corporation | 0.02 | 3.03 | 1.31 | 8.34 | 0.3085 | 0.0152 | |||
| BMY / Bristol-Myers Squibb Company | 0.02 | -6.05 | 1.30 | -12.53 | 0.3069 | -0.0545 | |||
| DEI / Douglas Emmett, Inc. | 0.03 | 1.28 | 0.3019 | 0.3019 | |||||
| MDT / Medtronic plc | 0.01 | -3.67 | 1.16 | 8.91 | 0.2730 | 0.0148 | |||
| NXPI / NXP Semiconductors N.V. | 0.01 | -1.12 | 1.14 | 4.38 | 0.2690 | 0.0036 | |||
| GLD / SPDR Gold Trust | 0.01 | -4.61 | 1.14 | 3.35 | 0.2688 | 0.0009 | |||
| WTRG / Essential Utilities, Inc. | 0.03 | -1.77 | 1.07 | 5.11 | 0.2514 | 0.0051 | |||
| IBM / International Business Machines Corporation | 0.01 | -4.42 | 1.05 | 0.19 | 0.2479 | -0.0069 | |||
| CMI / Cummins Inc. | 0.01 | -0.57 | 1.05 | 10.03 | 0.2476 | 0.0158 | |||
| OXY / Occidental Petroleum Corporation | 0.02 | 19.87 | 1.02 | 6.57 | 0.2403 | 0.0081 | |||
| LVS / Las Vegas Sands Corp. | 0.02 | 1.00 | 1.01 | 8.02 | 0.2375 | 0.0110 | |||
| PSA / Public Storage | 0.00 | 1.17 | 0.95 | -0.94 | 0.2227 | -0.0089 | |||
| C / Citigroup Inc. | 0.01 | 49.39 | 0.90 | 50.34 | 0.2107 | 0.0663 | |||
| NOC / Northrop Grumman Corporation | 0.00 | 5.04 | 0.89 | 7.47 | 0.2098 | 0.0087 | |||
| F / Ford Motor Company | 0.08 | -7.64 | 0.89 | -11.40 | 0.2083 | -0.0339 | |||
| PANW / Palo Alto Networks, Inc. | 0.01 | 10.09 | 0.79 | -0.76 | 0.1851 | -0.0070 | |||
| CWT / California Water Service Group | 0.02 | 0.00 | 0.77 | 5.74 | 0.1820 | 0.0047 | |||
| MRK / Merck & Co., Inc. | 0.01 | 82.96 | 0.76 | 97.65 | 0.1780 | 0.0852 | |||
| SCHW / The Charles Schwab Corporation | 0.02 | 14.15 | 0.76 | 18.13 | 0.1778 | 0.0228 | |||
| CAT / Caterpillar Inc. | 0.01 | -12.94 | 0.65 | -12.94 | 0.1519 | -0.0278 | |||
| MMP / Magellan Midstream Partners L.P. | 0.01 | 0.00 | 0.55 | 1.65 | 0.1303 | 0.1303 | |||
| DE / Deere & Company | 0.01 | -0.49 | 0.55 | 5.14 | 0.1298 | 0.0027 | |||
| US16941M1099 / China Mobile Ltd. | 0.01 | -0.55 | 0.50 | 4.82 | 0.1176 | 0.1176 | |||
| HD / The Home Depot, Inc. | 0.00 | 0.00 | 0.50 | 9.45 | 0.1171 | 0.0069 | |||
| ZION / Zions Bancorporation, National Association | 0.01 | 0.00 | 0.49 | -2.58 | 0.1155 | -0.0066 | |||
| AMGN / Amgen Inc. | 0.00 | 4.10 | 0.46 | 16.79 | 0.1079 | 0.0128 | |||
| RY / Royal Bank of Canada | 0.01 | -5.97 | 0.46 | 1.10 | 0.1079 | -0.0020 | |||
| PEP / PepsiCo, Inc. | 0.00 | -1.03 | 0.45 | 5.88 | 0.1058 | 0.0029 | |||
| SLV / iShares Silver Trust | 0.02 | -8.84 | 0.41 | 4.07 | 0.0962 | 0.0010 | |||
| FOX / Fox Corporation | 0.01 | -0.19 | 0.39 | 15.38 | 0.0917 | 0.0098 | |||
| FLS / Flowserve Corporation | 0.01 | -31.89 | 0.37 | -31.41 | 0.0868 | -0.0435 | |||
| PM / Philip Morris International Inc. | 0.00 | -0.67 | 0.37 | 22.59 | 0.0868 | 0.0139 | |||
| MIDD / The Middleby Corporation | 0.00 | 0.00 | 0.37 | 5.75 | 0.0865 | 0.0023 | |||
| EOG / EOG Resources, Inc. | 0.00 | 39.85 | 0.36 | 34.96 | 0.0844 | 0.0200 | |||
| TRP / TC Energy Corporation | 0.01 | 0.00 | 0.35 | 2.05 | 0.0818 | -0.0008 | |||
| MO / Altria Group, Inc. | 0.00 | -1.13 | 0.31 | 4.67 | 0.0738 | 0.0738 | |||
| PFE / Pfizer Inc. | 0.01 | 0.31 | 0.0738 | 0.0738 | |||||
| SLB / Schlumberger Limited | 0.00 | 21.49 | 0.31 | 13.19 | 0.0727 | 0.0065 | |||
| JCI / Johnson Controls International plc | 0.01 | -9.04 | 0.31 | -6.97 | 0.0722 | -0.0077 | |||
| CRM / Salesforce, Inc. | 0.00 | -2.65 | 0.30 | 17.44 | 0.0713 | 0.0088 | |||
| GD / General Dynamics Corporation | 0.00 | 7.41 | 0.27 | 16.31 | 0.0637 | 0.0637 | |||
| NSC / Norfolk Southern Corporation | 0.00 | -3.21 | 0.25 | 0.40 | 0.0595 | -0.0015 | |||
| 018490100 / Allergan plc | 0.00 | 0.25 | 0.0595 | 0.0595 | |||||
| IDXX / IDEXX Laboratories, Inc. | 0.00 | 0.25 | 0.0581 | 0.0581 | |||||
| MRVL / Marvell Technology, Inc. | 0.02 | 0.00 | 0.24 | 10.19 | 0.0560 | 0.0560 | |||
| NVS / Novartis AG - Depositary Receipt (Common Stock) | 0.00 | -2.44 | 0.22 | -0.45 | 0.0524 | -0.0018 | |||
| OKE / ONEOK, Inc. | 0.00 | 0.21 | 0.0501 | 0.0501 | |||||
| DUK / Duke Energy Corporation | 0.00 | -3.15 | 0.21 | 2.45 | 0.0491 | -0.0003 | |||
| ROP / Roper Technologies, Inc. | 0.00 | 0.21 | 0.0489 | 0.0489 | |||||
| ECL / Ecolab Inc. | 0.00 | -11.46 | 0.20 | -5.19 | 0.0473 | -0.0041 | |||
| CPRX / Catalyst Pharmaceuticals, Inc. | 0.04 | 0.00 | 0.09 | 86.96 | 0.0202 | 0.0091 | |||
| ARWR / Arrowhead Pharmaceuticals, Inc. | 0.02 | 0.00 | 0.04 | 18.75 | 0.0089 | 0.0089 | |||
| QLGN / Qualigen Therapeutics, Inc. | 0.01 | 0.00 | 0.01 | -46.43 | 0.0035 | -0.0033 | |||
| XLV / The Select Sector SPDR Trust - The Health Care Select Sector SPDR Fund | 0.00 | -100.00 | 0.00 | -100.00 | 0.0000 | ||||
| XLP / The Select Sector SPDR Trust - The Consumer Staples Select Sector SPDR Fund | 0.00 | -100.00 | 0.00 | -100.00 | 0.0000 | ||||
| XLE / The Select Sector SPDR Trust - The Energy Select Sector SPDR Fund | 0.00 | -100.00 | 0.00 | -100.00 | 0.0000 | ||||
| MMLP / Martin Midstream Partners L.P. - Limited Partnership | 0.00 | -100.00 | 0.00 | -100.00 | 0.0000 | ||||
| QCP / Quality Care Properties, Inc. | 0.00 | -100.00 | 0.00 | -100.00 | 0.0000 | ||||
| NVO / Novo Nordisk A/S - Depositary Receipt (Common Stock) | 0.00 | -100.00 | 0.00 | -100.00 | -0.0559 | ||||
| TGT / Target Corporation | 0.00 | -100.00 | 0.00 | -100.00 | -0.1189 | ||||
| US2655041000 / Dunkin' Brands Group, Inc. | 0.00 | -100.00 | 0.00 | -100.00 | -0.0538 | ||||
| XLK / The Select Sector SPDR Trust - The Technology Select Sector SPDR Fund | 0.00 | -100.00 | 0.00 | -100.00 | -0.5660 | ||||
| AMJ / JPMorgan Alerian MLP Index ETN - Corporate Bond/Note | 0.00 | -100.00 | 0.00 | -100.00 | 0.0000 |