Mga Batayang Estadistika
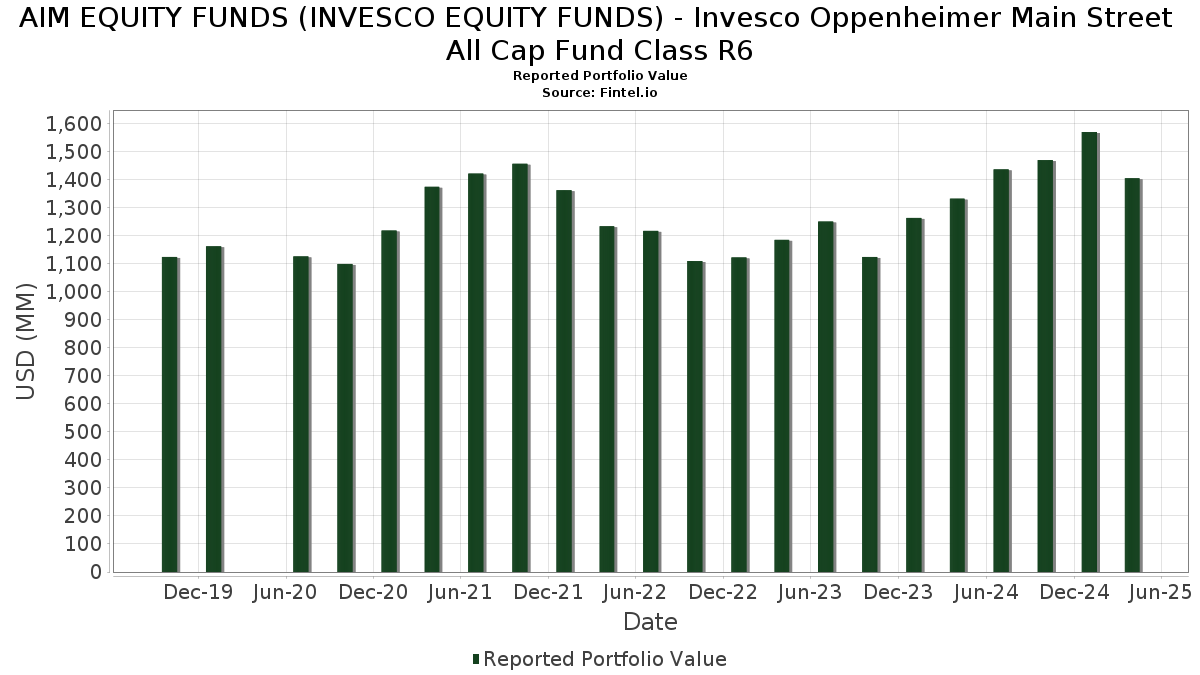
| Nilai Portofolio | $ 1,405,300,729 |
| Posisi Saat Ini | 81 |
Kepemilikan Terbaru, Kinerja, AUM (dari 13F, 13D)
AIM EQUITY FUNDS (INVESCO EQUITY FUNDS) - Invesco Oppenheimer Main Street All Cap Fund Class R6 telah mengungkapkan total kepemilikan 81 dalam pengajuan SEC terbaru mereka. Nilai portofolio terbaru dihitung sebesar $ 1,405,300,729 USD. Aset yang Dikelola (AUM) sebenarnya adalah nilai ini ditambah kas (yang tidak diungkapkan). Aset-aset utama AIM EQUITY FUNDS (INVESCO EQUITY FUNDS) - Invesco Oppenheimer Main Street All Cap Fund Class R6 adalah Microsoft Corporation (US:MSFT) , NVIDIA Corporation (US:NVDA) , Apple Inc. (US:AAPL) , Amazon.com, Inc. (US:AMZN) , and Meta Platforms, Inc. (US:META) . Posisi baru AIM EQUITY FUNDS (INVESCO EQUITY FUNDS) - Invesco Oppenheimer Main Street All Cap Fund Class R6 meliputi: Linde plc (US:LIN) , General Electric Company (US:GE) , Cheniere Energy, Inc. (US:LNG) , ASML Holding N.V. - Depositary Receipt (Common Stock) (US:ASML) , and Medtronic plc (US:MDT) .
Peningkatan Tertinggi Kuartal Ini
Kami menggunakan perubahan dalam alokasi portofolio karena ini adalah metrik yang paling bermakna. Perubahan dapat disebabkan oleh perdagangan atau perubahan harga saham.
| Keamanan | Saham (MM) |
Nilai (Juta Dolar AS) |
Portfolio % | ΔPorsyento ng Portfolio |
|---|---|---|---|---|
| 0.04 | 16.52 | 1.1826 | 1.1826 | |
| 0.04 | 14.08 | 1.0076 | 1.0076 | |
| 0.07 | 13.76 | 0.9850 | 0.9850 | |
| 0.05 | 10.86 | 0.7775 | 0.7775 | |
| 0.02 | 10.41 | 0.7453 | 0.7453 | |
| 0.12 | 10.19 | 0.7294 | 0.7294 | |
| 0.04 | 9.38 | 0.6716 | 0.6716 | |
| 0.16 | 28.21 | 2.0190 | 0.6380 | |
| 0.26 | 101.45 | 7.2618 | 0.5543 | |
| 6.63 | 6.63 | 0.4746 | 0.4746 |
Penurunan Tertinggi Kuartal Ini
Kami menggunakan perubahan dalam alokasi portofolio karena ini adalah metrik yang paling bermakna. Perubahan dapat disebabkan oleh perdagangan atau perubahan harga saham.
| Keamanan | Saham (MM) |
Nilai (Juta Dolar AS) |
Portfolio % | ΔPorsyento ng Portfolio |
|---|---|---|---|---|
| 5.19 | 5.19 | 0.3712 | -1.0233 | |
| 0.08 | 45.71 | 3.2721 | -0.9943 | |
| 0.34 | 62.56 | 4.4777 | -0.7172 | |
| 2.79 | 2.79 | 0.1999 | -0.5510 | |
| 0.22 | 8.79 | 0.6293 | -0.5339 | |
| 0.25 | 39.80 | 2.8486 | -0.4459 | |
| 0.22 | 10.67 | 0.7635 | -0.3370 | |
| 0.08 | 7.87 | 0.5631 | -0.3014 | |
| 0.12 | 12.41 | 0.8886 | -0.2964 | |
| 0.04 | 10.61 | 0.7597 | -0.2209 |
Pengajuan 13F dan Dana
Formulir ini diajukan pada 2025-06-30 untuk periode pelaporan 2025-04-30. Klik ikon tautan untuk melihat riwayat transaksi selengkapnya.
Tingkatkan ke versi premium untuk membuka data premium dan ekspor ke Excel. ![]() .
.
| Keamanan | Ketik | Harga Saham Rata-rata | Saham (MM) |
ΔSaham (%) |
ΔSaham (%) |
Nilai ($MM) |
Portpolyo (%) |
ΔPortofolio (%) |
|
|---|---|---|---|---|---|---|---|---|---|
| MSFT / Microsoft Corporation | 0.26 | 2.34 | 101.45 | -2.54 | 7.2618 | 0.5543 | |||
| NVDA / NVIDIA Corporation | 0.81 | 0.00 | 88.39 | -9.29 | 6.3268 | 0.0484 | |||
| AAPL / Apple Inc. | 0.36 | 0.00 | 76.69 | -9.96 | 5.4892 | 0.0014 | |||
| AMZN / Amazon.com, Inc. | 0.34 | 0.00 | 62.56 | -22.41 | 4.4777 | -0.7172 | |||
| META / Meta Platforms, Inc. | 0.08 | -13.33 | 45.71 | -30.96 | 3.2721 | -0.9943 | |||
| JPM / JPMorgan Chase & Co. | 0.17 | 0.00 | 40.39 | -8.49 | 2.8912 | 0.0473 | |||
| GOOGL / Alphabet Inc. | 0.25 | 0.00 | 39.80 | -22.16 | 2.8486 | -0.4459 | |||
| AVGO / Broadcom Inc. | 0.18 | 4.92 | 34.03 | -8.73 | 2.4361 | 0.0333 | |||
| LLY / Eli Lilly and Company | 0.03 | -13.05 | 28.80 | -3.63 | 2.0614 | 0.1359 | |||
| PM / Philip Morris International Inc. | 0.16 | 0.00 | 28.21 | 31.61 | 2.0190 | 0.6380 | |||
| WMT / Walmart Inc. | 0.27 | -16.75 | 26.48 | -17.52 | 1.8956 | -0.1732 | |||
| MA / Mastercard Incorporated | 0.05 | 21.23 | 26.28 | 19.62 | 1.8811 | 0.4655 | |||
| PG / The Procter & Gamble Company | 0.15 | 9.32 | 24.74 | 7.07 | 1.7708 | 0.2820 | |||
| UNH / UnitedHealth Group Incorporated | 0.05 | 9.52 | 22.20 | -16.94 | 1.5893 | -0.1331 | |||
| SCHW / The Charles Schwab Corporation | 0.23 | 0.00 | 19.08 | -1.59 | 1.3655 | 0.1163 | |||
| CRM / Salesforce, Inc. | 0.07 | 0.00 | 18.71 | -21.36 | 1.3389 | -0.1938 | |||
| NOW / ServiceNow, Inc. | 0.02 | 34.88 | 17.62 | 26.48 | 1.2613 | 0.3636 | |||
| AIG / American International Group, Inc. | 0.22 | 0.00 | 17.58 | 10.68 | 1.2584 | 0.2348 | |||
| UBER / Uber Technologies, Inc. | 0.21 | -11.87 | 17.34 | 6.80 | 1.2415 | 0.1951 | |||
| CMCSA / Comcast Corporation | 0.51 | -10.17 | 17.29 | -8.72 | 1.2373 | 0.0170 | |||
| AJG / Arthur J. Gallagher & Co. | 0.05 | 0.00 | 16.81 | 6.25 | 1.2035 | 0.1839 | |||
| CVX / Chevron Corporation | 0.12 | 0.00 | 16.76 | -8.80 | 1.1999 | 0.0155 | |||
| PPL / PPL Corporation | 0.45 | 27.18 | 16.53 | 38.16 | 1.1835 | 0.4124 | |||
| LIN / Linde plc | 0.04 | 16.52 | 1.1826 | 1.1826 | |||||
| HWM / Howmet Aerospace Inc. | 0.12 | -17.90 | 16.38 | -10.11 | 1.1726 | -0.0017 | |||
| TXN / Texas Instruments Incorporated | 0.10 | 0.00 | 15.96 | -13.30 | 1.1423 | -0.0438 | |||
| BSX / Boston Scientific Corporation | 0.15 | -8.10 | 15.79 | -7.65 | 1.1302 | 0.0286 | |||
| RCL / Royal Caribbean Cruises Ltd. | 0.07 | 0.00 | 15.06 | -19.39 | 1.0783 | -0.1258 | |||
| COR / Cencora, Inc. | 0.05 | 0.00 | 14.25 | 15.12 | 1.0201 | 0.2225 | |||
| FR / First Industrial Realty Trust, Inc. | 0.30 | -14.42 | 14.15 | -23.73 | 1.0130 | -0.1827 | |||
| MCD / McDonald's Corporation | 0.04 | 14.08 | 1.0076 | 1.0076 | |||||
| THC / Tenet Healthcare Corporation | 0.10 | 0.00 | 13.80 | 1.46 | 0.9875 | 0.1114 | |||
| GE / General Electric Company | 0.07 | 13.76 | 0.9850 | 0.9850 | |||||
| LOW / Lowe's Companies, Inc. | 0.06 | 0.00 | 13.73 | -14.03 | 0.9828 | -0.0463 | |||
| AXP / American Express Company | 0.05 | 0.00 | 13.60 | -16.08 | 0.9733 | -0.0707 | |||
| LZAGY / Lonza Group AG - Depositary Receipt (Common Stock) | 0.02 | -10.05 | 13.58 | 1.92 | 0.9720 | 0.1135 | |||
| COP / ConocoPhillips | 0.15 | 0.00 | 13.15 | -9.83 | 0.9413 | 0.0016 | |||
| HUBB / Hubbell Incorporated | 0.04 | -11.23 | 12.73 | -23.79 | 0.9113 | -0.1651 | |||
| VZ / Verizon Communications Inc. | 0.29 | 14.20 | 12.65 | 27.74 | 0.9056 | 0.2674 | |||
| RJF / Raymond James Financial, Inc. | 0.09 | 0.00 | 12.64 | -18.66 | 0.9047 | -0.0965 | |||
| EMR / Emerson Electric Co. | 0.12 | -16.54 | 12.41 | -32.50 | 0.8886 | -0.2964 | |||
| WH / Wyndham Hotels & Resorts, Inc. | 0.14 | 0.00 | 11.63 | -18.78 | 0.8325 | -0.0902 | |||
| ZBH / Zimmer Biomet Holdings, Inc. | 0.11 | 0.00 | 11.40 | -5.87 | 0.8158 | 0.0356 | |||
| SNOW / Snowflake Inc. | 0.07 | 0.00 | 11.15 | -12.13 | 0.7983 | -0.0195 | |||
| AIR / Airbus SE | 0.07 | 15.61 | 11.12 | 13.42 | 0.7961 | 0.1642 | |||
| LNG / Cheniere Energy, Inc. | 0.05 | 10.86 | 0.7775 | 0.7775 | |||||
| FI / Fiserv, Inc. | 0.06 | 0.00 | 10.84 | -14.57 | 0.7758 | -0.0416 | |||
| AEE / Ameren Corporation | 0.11 | -20.03 | 10.78 | -15.75 | 0.7715 | -0.0528 | |||
| EQH / Equitable Holdings, Inc. | 0.22 | -31.27 | 10.67 | -37.55 | 0.7635 | -0.3370 | |||
| TSLA / Tesla, Inc. | 0.04 | 0.00 | 10.61 | -30.26 | 0.7597 | -0.2209 | |||
| ASML / ASML Holding N.V. - Depositary Receipt (Common Stock) | 0.02 | 10.41 | 0.7453 | 0.7453 | |||||
| ASND / Ascendis Pharma A/S - Depositary Receipt (Common Stock) | 0.06 | 0.00 | 10.39 | 30.45 | 0.7437 | 0.2305 | |||
| DOX / Amdocs Limited | 0.12 | 51.18 | 10.31 | 53.09 | 0.7383 | 0.2644 | |||
| MDT / Medtronic plc | 0.12 | 10.19 | 0.7294 | 0.7294 | |||||
| BRBR / BellRing Brands, Inc. | 0.12 | -12.94 | 9.60 | -13.17 | 0.6870 | -0.0253 | |||
| AMH / American Homes 4 Rent | 0.25 | 0.00 | 9.42 | 7.97 | 0.6741 | 0.1121 | |||
| PH / Parker-Hannifin Corporation | 0.02 | -12.84 | 9.41 | -25.42 | 0.6733 | -0.1393 | |||
| CEG / Constellation Energy Corporation | 0.04 | 9.38 | 0.6716 | 0.6716 | |||||
| ROK / Rockwell Automation, Inc. | 0.04 | 0.00 | 9.17 | -11.05 | 0.6564 | -0.0078 | |||
| LECO / Lincoln Electric Holdings, Inc. | 0.05 | 0.00 | 9.09 | -11.35 | 0.6505 | -0.0101 | |||
| SNY / Sanofi - Depositary Receipt (Common Stock) | 0.16 | -23.54 | 9.01 | -22.68 | 0.6449 | -0.1059 | |||
| DFS / Discover Financial Services | 0.05 | 41.61 | 9.01 | 28.64 | 0.6447 | 0.1935 | |||
| USB / U.S. Bancorp | 0.22 | -42.32 | 8.79 | -51.30 | 0.6293 | -0.5339 | |||
| PCTY / Paylocity Holding Corporation | 0.05 | 0.00 | 8.74 | -6.54 | 0.6255 | 0.0231 | |||
| HIG / The Hartford Insurance Group, Inc. | 0.07 | 0.00 | 8.58 | 9.96 | 0.6139 | 0.1114 | |||
| U / Unity Software Inc. | 0.41 | 0.00 | 8.54 | -5.09 | 0.6113 | 0.0315 | |||
| DHI / D.R. Horton, Inc. | 0.07 | 0.00 | 8.52 | -10.97 | 0.6095 | -0.0067 | |||
| KEYS / Keysight Technologies, Inc. | 0.06 | 0.00 | 8.00 | -18.47 | 0.5728 | -0.0597 | |||
| CRH / CRH plc | 0.08 | -39.15 | 7.87 | -41.37 | 0.5631 | -0.3014 | |||
| KIM / Kimco Realty Corporation | 0.37 | 0.00 | 7.44 | -11.01 | 0.5325 | -0.0061 | |||
| COO / The Cooper Companies, Inc. | 0.09 | 0.00 | 7.40 | -15.41 | 0.5300 | -0.0340 | |||
| ATI / ATI Inc. | 0.14 | 0.00 | 7.35 | -4.76 | 0.5262 | 0.0289 | |||
| MDB / MongoDB, Inc. | 0.04 | 0.74 | 7.30 | -36.55 | 0.5227 | -0.2188 | |||
| BURL / Burlington Stores, Inc. | 0.03 | 22.66 | 7.08 | 26.94 | 0.5070 | 0.0279 | |||
| DD / DuPont de Nemours, Inc. | 0.10 | 0.00 | 6.91 | -14.08 | 0.4945 | -0.0236 | |||
| SU / Suncor Energy Inc. | 0.19 | -10.40 | 6.82 | -15.81 | 0.4881 | -0.0338 | |||
| OWL / Blue Owl Capital Inc. | 0.36 | 0.00 | 6.64 | -28.76 | 0.4753 | -0.1253 | |||
| Invesco Private Prime Fund / STIV (N/A) | 6.63 | 6.63 | 0.4746 | 0.4746 | |||||
| US8252524066 / Invesco Treasury Portfolio, Institutional Class | 5.19 | -76.04 | 5.19 | -76.04 | 0.3712 | -1.0233 | |||
| US8252528851 / Invesco Government & Agency Portfolio, Institutional Class | 2.79 | -76.04 | 2.79 | -76.04 | 0.1999 | -0.5510 | |||
| Invesco Private Government Fund / STIV (N/A) | 2.56 | 2.56 | 0.1834 | 0.1834 | |||||
| TTAN / ServiceTitan, Inc. | 0.00 | -100.00 | 0.00 | -100.00 | -0.1411 |