Mga Batayang Estadistika
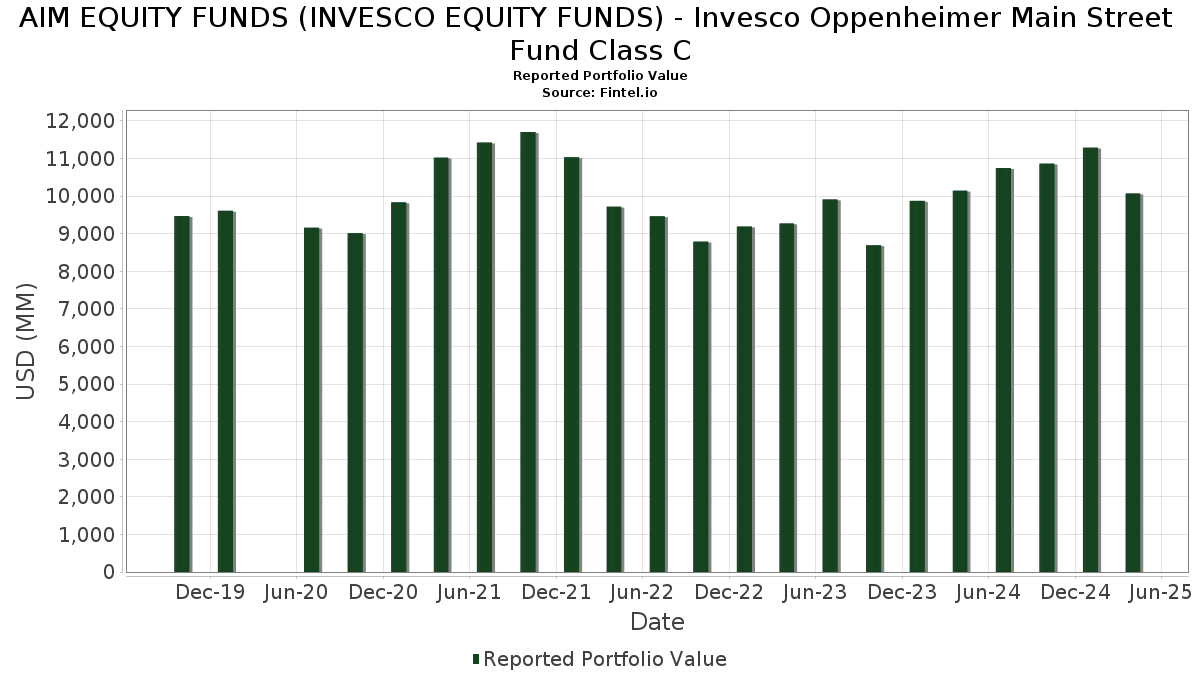
| Nilai Portofolio | $ 10,067,699,682 |
| Posisi Saat Ini | 76 |
Kepemilikan Terbaru, Kinerja, AUM (dari 13F, 13D)
AIM EQUITY FUNDS (INVESCO EQUITY FUNDS) - Invesco Oppenheimer Main Street Fund Class C telah mengungkapkan total kepemilikan 76 dalam pengajuan SEC terbaru mereka. Nilai portofolio terbaru dihitung sebesar $ 10,067,699,682 USD. Aset yang Dikelola (AUM) sebenarnya adalah nilai ini ditambah kas (yang tidak diungkapkan). Aset-aset utama AIM EQUITY FUNDS (INVESCO EQUITY FUNDS) - Invesco Oppenheimer Main Street Fund Class C adalah Microsoft Corporation (US:MSFT) , NVIDIA Corporation (US:NVDA) , Apple Inc. (US:AAPL) , Amazon.com, Inc. (US:AMZN) , and Alphabet Inc. (US:GOOGL) . Posisi baru AIM EQUITY FUNDS (INVESCO EQUITY FUNDS) - Invesco Oppenheimer Main Street Fund Class C meliputi: Airbus SE (US:EADSF) , ASML Holding N.V. - Depositary Receipt (Common Stock) (US:ASML) , Intuit Inc. (US:INTU) , Keurig Dr Pepper Inc. (US:KDP) , and .
Peningkatan Tertinggi Kuartal Ini
Kami menggunakan perubahan dalam alokasi portofolio karena ini adalah metrik yang paling bermakna. Perubahan dapat disebabkan oleh perdagangan atau perubahan harga saham.
| Keamanan | Saham (MM) |
Nilai (Juta Dolar AS) |
Portfolio % | ΔPorsyento ng Portfolio |
|---|---|---|---|---|
| 1.71 | 114.33 | 1.1454 | 1.1454 | |
| 0.65 | 206.60 | 2.0698 | 1.0900 | |
| 0.86 | 173.76 | 1.7408 | 0.8627 | |
| 0.50 | 85.24 | 0.8540 | 0.8540 | |
| 0.36 | 105.21 | 1.0540 | 0.7964 | |
| 1.90 | 752.56 | 7.5394 | 0.7834 | |
| 0.11 | 74.61 | 0.7474 | 0.7474 | |
| 66.09 | 66.09 | 0.6621 | 0.6621 | |
| 1.70 | 144.06 | 1.4433 | 0.6426 | |
| 0.08 | 52.81 | 0.5291 | 0.5291 |
Penurunan Tertinggi Kuartal Ini
Kami menggunakan perubahan dalam alokasi portofolio karena ini adalah metrik yang paling bermakna. Perubahan dapat disebabkan oleh perdagangan atau perubahan harga saham.
| Keamanan | Saham (MM) |
Nilai (Juta Dolar AS) |
Portfolio % | ΔPorsyento ng Portfolio |
|---|---|---|---|---|
| 0.47 | 260.22 | 2.6070 | -1.0852 | |
| 0.20 | 80.85 | 0.8099 | -0.9842 | |
| 2.66 | 490.24 | 4.9114 | -0.7770 | |
| 0.54 | 38.76 | 0.3883 | -0.6758 | |
| 0.61 | 63.90 | 0.6402 | -0.6403 | |
| 0.50 | 133.98 | 1.3422 | -0.6385 | |
| 0.42 | 89.79 | 0.8996 | -0.5398 | |
| 1.96 | 311.80 | 3.1237 | -0.4129 | |
| 0.14 | 40.64 | 0.4071 | -0.4005 | |
| 0.16 | 24.85 | 0.2490 | -0.3511 |
Pengajuan 13F dan Dana
Formulir ini diajukan pada 2025-06-30 untuk periode pelaporan 2025-04-30. Klik ikon tautan untuk melihat riwayat transaksi selengkapnya.
Tingkatkan ke versi premium untuk membuka data premium dan ekspor ke Excel. ![]() .
.
| Keamanan | Ketik | Harga Saham Rata-rata | Saham (MM) |
ΔSaham (%) |
ΔSaham (%) |
Nilai ($MM) |
Portpolyo (%) |
ΔPortofolio (%) |
|
|---|---|---|---|---|---|---|---|---|---|
| MSFT / Microsoft Corporation | 1.90 | 5.31 | 752.56 | 0.29 | 7.5394 | 0.7834 | |||
| NVDA / NVIDIA Corporation | 5.70 | -5.30 | 621.35 | -14.09 | 6.2249 | -0.2869 | |||
| AAPL / Apple Inc. | 2.91 | 8.64 | 618.09 | -2.17 | 6.1923 | 0.5038 | |||
| AMZN / Amazon.com, Inc. | 2.66 | 0.00 | 490.24 | -22.41 | 4.9114 | -0.7770 | |||
| GOOGL / Alphabet Inc. | 1.96 | 1.98 | 311.80 | -20.63 | 3.1237 | -0.4129 | |||
| META / Meta Platforms, Inc. | 0.47 | -20.34 | 260.22 | -36.55 | 2.6070 | -1.0852 | |||
| PM / Philip Morris International Inc. | 1.52 | -21.76 | 260.12 | 2.98 | 2.6060 | 0.3318 | |||
| JPM / JPMorgan Chase & Co. | 1.06 | -1.15 | 258.29 | -9.53 | 2.5876 | 0.0172 | |||
| MCD / McDonald's Corporation | 0.65 | 71.46 | 206.60 | 89.84 | 2.0698 | 1.0900 | |||
| AVGO / Broadcom Inc. | 1.06 | -5.86 | 203.93 | -18.11 | 2.0431 | -0.1991 | |||
| SCHW / The Charles Schwab Corporation | 2.23 | -10.02 | 181.88 | -11.46 | 1.8222 | -0.0272 | |||
| LLY / Eli Lilly and Company | 0.20 | -10.82 | 181.29 | -1.16 | 1.8163 | 0.1649 | |||
| WMT / Walmart Inc. | 1.86 | -24.00 | 180.54 | -24.71 | 1.8088 | -0.3501 | |||
| FI / Fiserv, Inc. | 0.95 | 0.00 | 175.27 | -14.57 | 1.7560 | -0.0911 | |||
| MA / Mastercard Incorporated | 0.32 | 0.00 | 175.23 | -1.33 | 1.7555 | 0.1567 | |||
| GE / General Electric Company | 0.86 | 79.96 | 173.76 | 78.16 | 1.7408 | 0.8627 | |||
| CRM / Salesforce, Inc. | 0.63 | 17.23 | 170.38 | -7.81 | 1.7070 | 0.0430 | |||
| T / AT&T Inc. | 6.02 | -5.64 | 166.80 | 10.15 | 1.6710 | 0.3077 | |||
| AIG / American International Group, Inc. | 1.96 | 6.81 | 160.16 | 18.20 | 1.6045 | 0.3846 | |||
| UBER / Uber Technologies, Inc. | 1.87 | -18.25 | 151.12 | -0.94 | 1.5139 | 0.1406 | |||
| NOW / ServiceNow, Inc. | 0.16 | -8.11 | 148.11 | -13.83 | 1.4838 | -0.0637 | |||
| PLD / Prologis, Inc. | 1.42 | 0.00 | 145.24 | -14.30 | 1.4551 | -0.0707 | |||
| MDT / Medtronic plc | 1.70 | 73.57 | 144.06 | 61.99 | 1.4433 | 0.6426 | |||
| CVX / Chevron Corporation | 1.02 | 43.47 | 139.35 | 30.84 | 1.3960 | 0.4372 | |||
| EQH / Equitable Holdings, Inc. | 2.72 | -12.67 | 134.64 | -20.64 | 1.3489 | -0.1786 | |||
| LONN / Lonza Group AG | 0.19 | -7.22 | 134.17 | 5.13 | 1.3442 | 0.1952 | |||
| CRH / CRH plc | 1.41 | 0.00 | 134.07 | -3.65 | 1.3432 | 0.0904 | |||
| AXP / American Express Company | 0.50 | -27.43 | 133.98 | -39.10 | 1.3422 | -0.6385 | |||
| C / Citigroup Inc. | 1.95 | -8.18 | 133.10 | -22.89 | 1.3334 | -0.2206 | |||
| BSX / Boston Scientific Corporation | 1.21 | -14.53 | 124.41 | -14.11 | 1.2464 | -0.0577 | |||
| US8252524066 / Invesco Treasury Portfolio, Institutional Class | 119.12 | -2.45 | 119.12 | -2.45 | 1.1934 | 0.0941 | |||
| ATO / Atmos Energy Corporation | 0.74 | 0.00 | 118.53 | 12.72 | 1.1875 | 0.2407 | |||
| CVS / CVS Health Corporation | 1.71 | 114.33 | 1.1454 | 1.1454 | |||||
| HUBB / Hubbell Incorporated | 0.30 | -9.47 | 108.04 | -22.27 | 1.0824 | -0.1691 | |||
| COR / Cencora, Inc. | 0.36 | 219.29 | 105.21 | 267.60 | 1.0540 | 0.7964 | |||
| OTIS / Otis Worldwide Corporation | 1.08 | 36.69 | 103.65 | 37.91 | 1.0384 | 0.3617 | |||
| SU / Suncor Energy Inc. | 2.89 | -9.01 | 102.06 | -14.51 | 1.0225 | -0.0524 | |||
| AJG / Arthur J. Gallagher & Co. | 0.30 | 11.14 | 97.71 | 18.09 | 0.9789 | 0.2340 | |||
| LNG / Cheniere Energy, Inc. | 0.41 | 69.22 | 94.11 | 74.87 | 0.9428 | 0.4583 | |||
| RCL / Royal Caribbean Cruises Ltd. | 0.42 | -30.33 | 89.79 | -43.83 | 0.8996 | -0.5398 | |||
| EADSF / Airbus SE | 0.50 | 85.24 | 0.8540 | 0.8540 | |||||
| TXN / Texas Instruments Incorporated | 0.53 | -10.23 | 85.08 | -22.17 | 0.8524 | -0.1318 | |||
| DD / DuPont de Nemours, Inc. | 1.25 | 0.00 | 82.67 | -14.08 | 0.8282 | -0.0380 | |||
| DFS / Discover Financial Services | 0.45 | -12.66 | 82.60 | -20.66 | 0.8276 | -0.1098 | |||
| PG / The Procter & Gamble Company | 0.50 | 53.86 | 81.91 | 50.70 | 0.8206 | 0.3312 | |||
| ZBH / Zimmer Biomet Holdings, Inc. | 0.79 | -26.60 | 81.07 | -30.91 | 0.8122 | -0.2443 | |||
| UNH / UnitedHealth Group Incorporated | 0.20 | -46.51 | 80.85 | -59.43 | 0.8099 | -0.9842 | |||
| PH / Parker-Hannifin Corporation | 0.13 | 4.12 | 79.23 | -10.90 | 0.7938 | -0.0068 | |||
| PPL / PPL Corporation | 2.14 | 151.65 | 78.26 | 173.38 | 0.7840 | 0.5263 | |||
| ASML / ASML Holding N.V. - Depositary Receipt (Common Stock) | 0.11 | 74.61 | 0.7474 | 0.7474 | |||||
| TYL / Tyler Technologies, Inc. | 0.13 | -21.09 | 72.29 | -28.74 | 0.7242 | -0.1891 | |||
| COO / The Cooper Companies, Inc. | 0.85 | -13.07 | 69.79 | -26.47 | 0.6992 | -0.1553 | |||
| Invesco Private Prime Fund / STIV (N/A) | 66.09 | 66.09 | 0.6621 | 0.6621 | |||||
| US8252528851 / Invesco Government & Agency Portfolio, Institutional Class | 64.14 | -2.45 | 64.14 | -2.45 | 0.6426 | 0.0506 | |||
| EMR / Emerson Electric Co. | 0.61 | -44.45 | 63.90 | -55.07 | 0.6402 | -0.6403 | |||
| ALC / Alcon Inc. | 0.57 | 85.61 | 55.18 | 148.88 | 0.5528 | 0.3549 | |||
| VVV / Valvoline Inc. | 1.60 | -8.36 | 54.91 | -15.40 | 0.5501 | -0.0342 | |||
| THC / Tenet Healthcare Corporation | 0.38 | -45.70 | 54.81 | -44.91 | 0.5491 | -0.3466 | |||
| PCTY / Paylocity Holding Corporation | 0.28 | 0.00 | 53.92 | -6.53 | 0.5401 | 0.0208 | |||
| INTU / Intuit Inc. | 0.08 | 52.81 | 0.5291 | 0.5291 | |||||
| KDP / Keurig Dr Pepper Inc. | 1.49 | 51.70 | 0.5179 | 0.5179 | |||||
| LOW / Lowe's Companies, Inc. | 0.21 | 0.00 | 46.68 | -14.03 | 0.4677 | -0.0212 | |||
| AMT / American Tower Corporation | 0.20 | 44.80 | 0.4488 | 0.4488 | |||||
| DHI / D.R. Horton, Inc. | 0.34 | 85.49 | 43.31 | 65.16 | 0.4339 | 0.1978 | |||
| TSLA / Tesla, Inc. | 0.14 | -35.04 | 40.64 | -54.70 | 0.4071 | -0.4005 | |||
| GILD / Gilead Sciences, Inc. | 0.37 | -42.54 | 39.89 | -37.02 | 0.3996 | -0.1706 | |||
| AEE / Ameren Corporation | 0.39 | 36.63 | 39.11 | 43.94 | 0.3918 | 0.1472 | |||
| AZN / AstraZeneca PLC - Depositary Receipt (Common Stock) | 0.54 | -62.82 | 38.76 | -57.78 | 0.3883 | -0.6758 | |||
| ARES / Ares Management Corporation | 0.23 | -0.66 | 35.73 | -23.56 | 0.3579 | -0.0628 | |||
| CEG / Constellation Energy Corporation | 0.13 | 0.00 | 28.17 | -25.51 | 0.2822 | -0.0583 | |||
| NTRA / Natera, Inc. | 0.18 | -5.57 | 26.67 | -19.45 | 0.2671 | -0.0309 | |||
| Invesco Private Government Fund / STIV (N/A) | 25.40 | 25.40 | 0.2545 | 0.2545 | |||||
| SNOW / Snowflake Inc. | 0.16 | -57.56 | 24.85 | -62.71 | 0.2490 | -0.3511 | |||
| EL / The Estée Lauder Companies Inc. | 0.32 | 0.00 | 19.30 | -28.13 | 0.1933 | -0.0484 | |||
| TMUS / T-Mobile US, Inc. | 0.06 | -71.03 | 15.79 | -69.29 | 0.1582 | -0.3047 | |||
| MDB / MongoDB, Inc. | 0.02 | -83.53 | 4.23 | -89.62 | 0.0424 | -0.3249 | |||
| VST / Vistra Corp. | 0.00 | -100.00 | 0.00 | -100.00 | -0.1043 |