Mga Batayang Estadistika
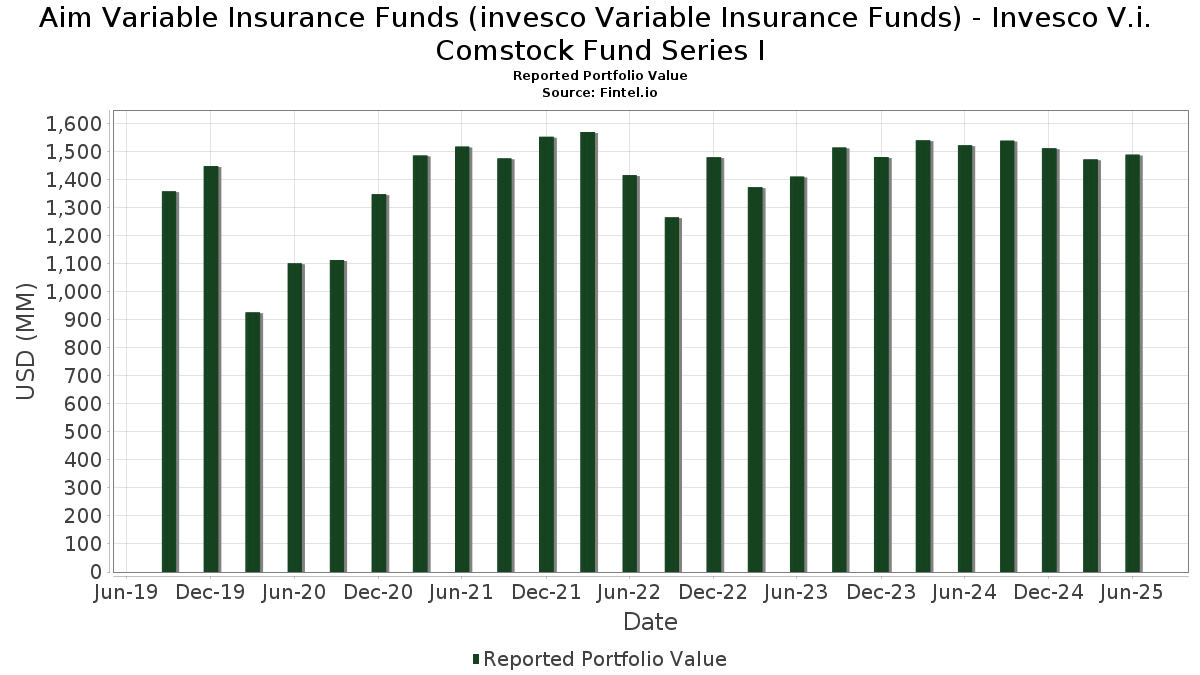
| Nilai Portofolio | $ 1,490,117,635 |
| Posisi Saat Ini | 96 |
Kepemilikan Terbaru, Kinerja, AUM (dari 13F, 13D)
Aim Variable Insurance Funds (invesco Variable Insurance Funds) - Invesco V.i. Comstock Fund Series I telah mengungkapkan total kepemilikan 96 dalam pengajuan SEC terbaru mereka. Nilai portofolio terbaru dihitung sebesar $ 1,490,117,635 USD. Aset yang Dikelola (AUM) sebenarnya adalah nilai ini ditambah kas (yang tidak diungkapkan). Aset-aset utama Aim Variable Insurance Funds (invesco Variable Insurance Funds) - Invesco V.i. Comstock Fund Series I adalah Bank of America Corporation (US:BAC) , Wells Fargo & Company (US:WFC) , Microsoft Corporation (US:MSFT) , Cisco Systems, Inc. (US:CSCO) , and CVS Health Corporation (US:CVS) . Posisi baru Aim Variable Insurance Funds (invesco Variable Insurance Funds) - Invesco V.i. Comstock Fund Series I meliputi: NIKE, Inc. (US:NKE) , The Clorox Company (US:CLX) , Regeneron Pharmaceuticals, Inc. (US:REGN) , .
Peningkatan Tertinggi Kuartal Ini
Kami menggunakan perubahan dalam alokasi portofolio karena ini adalah metrik yang paling bermakna. Perubahan dapat disebabkan oleh perdagangan atau perubahan harga saham.
| Keamanan | Saham (MM) |
Nilai (Juta Dolar AS) |
Portfolio % | ΔPorsyento ng Portfolio |
|---|---|---|---|---|
| 42.40 | 42.40 | 2.9583 | 2.9583 | |
| 16.24 | 16.24 | 1.1332 | 1.1332 | |
| 0.17 | 11.96 | 0.8347 | 0.8347 | |
| 0.09 | 10.89 | 0.7598 | 0.7598 | |
| 25.36 | 25.36 | 1.7693 | 0.7381 | |
| 0.09 | 42.80 | 2.9863 | 0.6920 | |
| 0.29 | 31.01 | 2.1634 | 0.4829 | |
| 1.02 | 48.06 | 3.3534 | 0.4262 | |
| 0.27 | 28.90 | 2.0167 | 0.4245 | |
| 0.05 | 11.46 | 0.7997 | 0.4079 |
Penurunan Tertinggi Kuartal Ini
Kami menggunakan perubahan dalam alokasi portofolio karena ini adalah metrik yang paling bermakna. Perubahan dapat disebabkan oleh perdagangan atau perubahan harga saham.
| Keamanan | Saham (MM) |
Nilai (Juta Dolar AS) |
Portfolio % | ΔPorsyento ng Portfolio |
|---|---|---|---|---|
| 0.14 | 9.60 | 0.6702 | -0.6519 | |
| 0.15 | 21.94 | 1.5311 | -0.5653 | |
| 0.08 | 6.99 | 0.4875 | -0.4720 | |
| 0.12 | 17.98 | 1.2549 | -0.4493 | |
| 0.12 | 12.52 | 0.8733 | -0.4130 | |
| 0.42 | 20.11 | 1.4030 | -0.3950 | |
| 0.16 | 12.21 | 0.8519 | -0.3726 | |
| 0.50 | 18.70 | 1.3051 | -0.3677 | |
| 0.05 | 10.43 | 0.7277 | -0.3612 | |
| 0.24 | 20.37 | 1.4215 | -0.3380 |
Pengajuan 13F dan Dana
Formulir ini diajukan pada 2025-08-28 untuk periode pelaporan 2025-06-30. Klik ikon tautan untuk melihat riwayat transaksi selengkapnya.
Tingkatkan ke versi premium untuk membuka data premium dan ekspor ke Excel. ![]() .
.
| Keamanan | Ketik | Harga Saham Rata-rata | Saham (MM) |
ΔSaham (%) |
ΔSaham (%) |
Nilai ($MM) |
Portpolyo (%) |
ΔPortofolio (%) |
|
|---|---|---|---|---|---|---|---|---|---|
| BAC / Bank of America Corporation | 1.02 | 1.56 | 48.06 | 15.16 | 3.3534 | 0.4262 | |||
| WFC / Wells Fargo & Company | 0.55 | -10.97 | 43.87 | -0.64 | 3.0612 | -0.0359 | |||
| MSFT / Microsoft Corporation | 0.09 | -1.26 | 42.80 | 30.84 | 2.9863 | 0.6920 | |||
| Invesco Private Prime Fund / STIV (N/A) | 42.40 | 42.40 | 2.9583 | 2.9583 | |||||
| CSCO / Cisco Systems, Inc. | 0.57 | 0.07 | 39.31 | 12.51 | 2.7426 | 0.2921 | |||
| CVS / CVS Health Corporation | 0.49 | 1.56 | 33.82 | 3.40 | 2.3599 | 0.0656 | |||
| STT / State Street Corporation | 0.29 | 8.95 | 31.01 | 29.41 | 2.1634 | 0.4829 | |||
| META / Meta Platforms, Inc. | 0.04 | -16.10 | 30.36 | 7.44 | 2.1185 | 0.1364 | |||
| GOOGL / Alphabet Inc. | 0.17 | -1.26 | 29.36 | 12.53 | 2.0488 | 0.2186 | |||
| JCI / Johnson Controls International plc | 0.27 | -3.43 | 28.90 | 27.32 | 2.0167 | 0.4245 | |||
| PM / Philip Morris International Inc. | 0.15 | -21.93 | 26.48 | -10.42 | 1.8477 | -0.2257 | |||
| C / Citigroup Inc. | 0.30 | -1.26 | 25.59 | 18.39 | 1.7857 | 0.2696 | |||
| SYY / Sysco Corporation | 0.34 | -1.26 | 25.59 | -0.33 | 1.7855 | -0.0154 | |||
| US8252524066 / Invesco Treasury Portfolio, Institutional Class | 25.36 | 72.47 | 25.36 | 72.47 | 1.7693 | 0.7381 | |||
| ETN / Eaton Corporation plc | 0.07 | -1.26 | 24.58 | 29.68 | 1.7150 | 0.3856 | |||
| HBAN / Huntington Bancshares Incorporated | 1.46 | 5.74 | 24.43 | 18.06 | 1.7045 | 0.2532 | |||
| NXPI / NXP Semiconductors N.V. | 0.11 | 6.26 | 24.35 | 22.16 | 1.6991 | 0.3009 | |||
| CTSH / Cognizant Technology Solutions Corporation | 0.31 | 7.35 | 24.08 | 9.50 | 1.6801 | 0.1377 | |||
| RKT / Reckitt Benckiser Group plc | 0.35 | 3.59 | 23.62 | 4.37 | 1.6483 | 0.0607 | |||
| EMR / Emerson Electric Co. | 0.18 | -1.26 | 23.54 | 20.08 | 1.6422 | 0.2674 | |||
| CFG / Citizens Financial Group, Inc. | 0.52 | -1.26 | 23.26 | 7.86 | 1.6229 | 0.1103 | |||
| SRE / Sempra | 0.30 | -1.26 | 22.85 | 4.85 | 1.5943 | 0.0657 | |||
| FDX / FedEx Corporation | 0.10 | 9.92 | 22.71 | 2.49 | 1.5845 | 0.0304 | |||
| ELV / Elevance Health, Inc. | 0.06 | -1.26 | 22.58 | -11.70 | 1.5753 | -0.2180 | |||
| WAB / Westinghouse Air Brake Technologies Corporation | 0.11 | -1.26 | 22.12 | 13.99 | 1.5436 | 0.1823 | |||
| CVX / Chevron Corporation | 0.15 | -14.22 | 21.94 | -26.58 | 1.5311 | -0.5653 | |||
| KMB / Kimberly-Clark Corporation | 0.16 | -1.26 | 21.15 | -10.49 | 1.4758 | -0.1816 | |||
| AIG / American International Group, Inc. | 0.24 | -17.51 | 20.37 | -18.79 | 1.4215 | -0.3380 | |||
| SNY / Sanofi - Depositary Receipt (Common Stock) | 0.42 | -9.95 | 20.11 | -21.56 | 1.4030 | -0.3950 | |||
| FITB / Fifth Third Bancorp | 0.47 | -1.26 | 19.48 | 3.61 | 1.3589 | 0.0404 | |||
| KDP / Keurig Dr Pepper Inc. | 0.59 | -1.26 | 19.46 | -4.60 | 1.3578 | -0.0730 | |||
| EBAY / eBay Inc. | 0.26 | -1.26 | 19.00 | 8.55 | 1.3260 | 0.0981 | |||
| CAT / Caterpillar Inc. | 0.05 | -1.26 | 18.76 | 16.23 | 1.3093 | 0.1770 | |||
| SU / Suncor Energy Inc. | 0.50 | -18.91 | 18.70 | -21.57 | 1.3051 | -0.3677 | |||
| AZN / Astrazeneca plc | 0.13 | -8.32 | 18.32 | -13.11 | 1.2782 | -0.2006 | |||
| TXT / Textron Inc. | 0.23 | 16.99 | 18.20 | 30.02 | 1.2697 | 0.2880 | |||
| JNJ / Johnson & Johnson | 0.12 | -19.64 | 17.98 | -25.98 | 1.2549 | -0.4493 | |||
| D / Dominion Energy, Inc. | 0.31 | -1.26 | 17.64 | -0.46 | 1.2307 | -0.0122 | |||
| MTB / M&T Bank Corporation | 0.09 | -1.26 | 17.49 | 7.16 | 1.2203 | 0.0756 | |||
| SBUX / Starbucks Corporation | 0.19 | 18.85 | 17.19 | 11.02 | 1.1995 | 0.1134 | |||
| COP / ConocoPhillips | 0.19 | -1.26 | 16.81 | -15.63 | 1.1731 | -0.2245 | |||
| Invesco Private Government Fund / STIV (N/A) | 16.24 | 16.24 | 1.1332 | 1.1332 | |||||
| MRK / Merck & Co., Inc. | 0.20 | -1.26 | 15.92 | -12.92 | 1.1111 | -0.1715 | |||
| CHTR / Charter Communications, Inc. | 0.04 | -1.25 | 15.67 | 9.54 | 1.0936 | 0.0900 | |||
| QSR / Restaurant Brands International Inc. | 0.23 | 21.05 | 15.49 | 20.45 | 1.0807 | 0.1788 | |||
| LVS / Las Vegas Sands Corp. | 0.34 | 5.06 | 14.97 | 18.33 | 1.0443 | 0.1571 | |||
| DIS / The Walt Disney Company | 0.12 | -11.23 | 14.75 | 11.53 | 1.0293 | 0.1016 | |||
| ABIT / Anheuser-Busch InBev SA/NV | 0.21 | -1.26 | 14.49 | 10.50 | 1.0113 | 0.0913 | |||
| MET / MetLife, Inc. | 0.18 | -1.26 | 14.26 | -1.10 | 0.9950 | -0.0163 | |||
| MDT / Medtronic plc | 0.16 | -1.26 | 14.07 | -4.21 | 0.9819 | -0.0485 | |||
| US8252528851 / Invesco Government & Agency Portfolio, Institutional Class | 13.65 | 72.46 | 13.65 | 72.46 | 0.9527 | 0.3974 | |||
| BDX / Becton, Dickinson and Company | 0.07 | -1.26 | 12.67 | -25.75 | 0.8838 | -0.3127 | |||
| CMCSA / Comcast Corporation | 0.35 | -1.26 | 12.66 | -4.50 | 0.8832 | -0.0464 | |||
| DPZ / Domino's Pizza, Inc. | 0.03 | -1.26 | 12.65 | -3.15 | 0.8829 | -0.0336 | |||
| XOM / Exxon Mobil Corporation | 0.12 | -24.71 | 12.52 | -31.75 | 0.8733 | -0.4130 | |||
| CTVA / Corteva, Inc. | 0.16 | -40.95 | 12.21 | -30.07 | 0.8519 | -0.3726 | |||
| NKE / NIKE, Inc. | 0.17 | 11.96 | 0.8347 | 0.8347 | |||||
| SBAC / SBA Communications Corporation | 0.05 | 92.23 | 11.46 | 105.21 | 0.7997 | 0.4079 | |||
| IP / International Paper Company | 0.23 | -1.26 | 11.00 | -13.33 | 0.7679 | -0.1227 | |||
| HSIC / Henry Schein, Inc. | 0.15 | -18.14 | 10.98 | -12.69 | 0.7663 | -0.1160 | |||
| CLX / The Clorox Company | 0.09 | 10.89 | 0.7598 | 0.7598 | |||||
| QCOM / QUALCOMM Incorporated | 0.07 | -6.49 | 10.80 | -3.04 | 0.7536 | -0.0277 | |||
| FFIV / F5, Inc. | 0.04 | -10.75 | 10.70 | -1.36 | 0.7466 | -0.0142 | |||
| ALL / The Allstate Corporation | 0.05 | -30.90 | 10.43 | -32.82 | 0.7277 | -0.3612 | |||
| INTC / Intel Corporation | 0.46 | -1.26 | 10.38 | -2.61 | 0.7240 | -0.0233 | |||
| HES / Hess Corporation | 0.07 | -1.26 | 9.88 | -14.35 | 0.6895 | -0.1198 | |||
| KO / The Coca-Cola Company | 0.14 | -48.42 | 9.60 | -49.04 | 0.6702 | -0.6519 | |||
| GEHC / GE HealthCare Technologies Inc. | 0.13 | -1.26 | 9.31 | -9.38 | 0.6496 | -0.0710 | |||
| BMY / Bristol-Myers Squibb Company | 0.20 | -1.26 | 9.06 | -25.06 | 0.6322 | -0.2158 | |||
| UNH / UnitedHealth Group Incorporated | 0.03 | 11.48 | 8.86 | -33.59 | 0.6179 | -0.3175 | |||
| DXC / DXC Technology Company | 0.58 | -1.26 | 8.84 | -11.46 | 0.6165 | -0.0834 | |||
| UMG / Universal Music Group N.V. | 0.27 | -1.26 | 8.83 | 16.01 | 0.6159 | 0.0822 | |||
| WBD / Warner Bros. Discovery, Inc. | 0.76 | -1.26 | 8.71 | 5.46 | 0.6075 | 0.0284 | |||
| EQT / EQT Corporation | 0.14 | -28.86 | 8.30 | -22.35 | 0.5791 | -0.1706 | |||
| TEN / Tenaris S.A. | 0.43 | -1.26 | 8.00 | -5.42 | 0.5584 | -0.0351 | |||
| HUM / Humana Inc. | 0.03 | -1.25 | 7.45 | -8.76 | 0.5197 | -0.0529 | |||
| GS / The Goldman Sachs Group, Inc. | 0.01 | -1.25 | 7.37 | 27.93 | 0.5146 | 0.1103 | |||
| IQV / IQVIA Holdings Inc. | 0.04 | -1.26 | 7.01 | -11.74 | 0.4890 | -0.0679 | |||
| CF / CF Industries Holdings, Inc. | 0.08 | -56.62 | 6.99 | -48.93 | 0.4875 | -0.4720 | |||
| ICLR / ICON Public Limited Company | 0.04 | 4.59 | 6.53 | -13.07 | 0.4553 | -0.0712 | |||
| BAX / Baxter International Inc. | 0.20 | -1.26 | 5.90 | -12.66 | 0.4120 | -0.0621 | |||
| COF / Capital One Financial Corporation | 0.03 | -36.26 | 5.83 | 3.30 | 0.4065 | 0.0479 | |||
| REGN / Regeneron Pharmaceuticals, Inc. | 0.01 | 5.17 | 0.3605 | 0.3605 | |||||
| EVRG / Evergy, Inc. | 0.07 | -1.26 | 5.06 | -1.29 | 0.3531 | -0.0065 | |||
| Forward Foreign Currency Contract / DFE (N/A) | 0.01 | 0.0010 | 0.0010 | ||||||
| Forward Foreign Currency Contract / DFE (N/A) | 0.01 | 0.0005 | 0.0005 | ||||||
| Forward Foreign Currency Contract / DFE (N/A) | 0.00 | 0.0003 | 0.0003 | ||||||
| Forward Foreign Currency Contract / DFE (N/A) | 0.00 | 0.0002 | 0.0002 | ||||||
| Forward Foreign Currency Contract / DFE (N/A) | 0.00 | 0.0000 | 0.0000 | ||||||
| Forward Foreign Currency Contract / DFE (N/A) | 0.00 | 0.0000 | 0.0000 | ||||||
| Forward Foreign Currency Contract / DFE (N/A) | -0.00 | -0.0001 | -0.0001 | ||||||
| Forward Foreign Currency Contract / DFE (N/A) | -0.01 | -0.0004 | -0.0004 | ||||||
| Forward Foreign Currency Contract / DFE (N/A) | -0.01 | -0.0004 | -0.0004 | ||||||
| Forward Foreign Currency Contract / DFE (N/A) | -0.09 | -0.0063 | -0.0063 | ||||||
| Forward Foreign Currency Contract / DFE (N/A) | -0.27 | -0.0191 | -0.0191 | ||||||
| Forward Foreign Currency Contract / DFE (N/A) | -0.71 | -0.0493 | -0.0493 |