Mga Batayang Estadistika
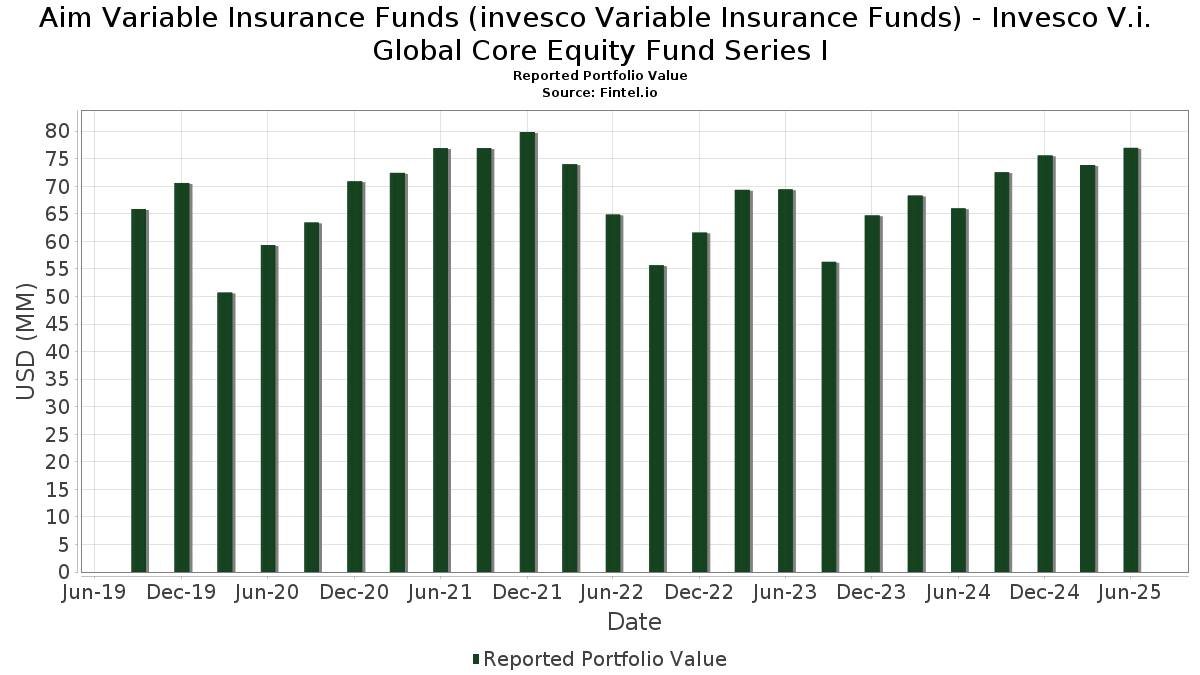
| Nilai Portofolio | $ 76,971,679 |
| Posisi Saat Ini | 66 |
Kepemilikan Terbaru, Kinerja, AUM (dari 13F, 13D)
Aim Variable Insurance Funds (invesco Variable Insurance Funds) - Invesco V.i. Global Core Equity Fund Series I telah mengungkapkan total kepemilikan 66 dalam pengajuan SEC terbaru mereka. Nilai portofolio terbaru dihitung sebesar $ 76,971,679 USD. Aset yang Dikelola (AUM) sebenarnya adalah nilai ini ditambah kas (yang tidak diungkapkan). Aset-aset utama Aim Variable Insurance Funds (invesco Variable Insurance Funds) - Invesco V.i. Global Core Equity Fund Series I adalah Microsoft Corporation (US:MSFT) , Amazon.com, Inc. (US:AMZN) , 3i Group plc (DE:IGQ5) , Meta Platforms, Inc. (US:META) , and NVIDIA Corporation (US:NVDA) . Posisi baru Aim Variable Insurance Funds (invesco Variable Insurance Funds) - Invesco V.i. Global Core Equity Fund Series I meliputi: Safran SA (FR:SAF) , Viking Holdings Ltd (US:VIK) , East West Bancorp, Inc. (US:EWBC) , Interactive Brokers Group, Inc. (US:IBKR) , and QXO, Inc. (US:QXO) .
Peningkatan Tertinggi Kuartal Ini
Kami menggunakan perubahan dalam alokasi portofolio karena ini adalah metrik yang paling bermakna. Perubahan dapat disebabkan oleh perdagangan atau perubahan harga saham.
| Keamanan | Saham (MM) |
Nilai (Juta Dolar AS) |
Portfolio % | ΔPorsyento ng Portfolio |
|---|---|---|---|---|
| 0.00 | 1.06 | 1.3948 | 1.3948 | |
| 0.02 | 2.64 | 3.4735 | 1.2109 | |
| 0.00 | 2.64 | 3.4748 | 1.1715 | |
| 0.01 | 0.79 | 1.0416 | 1.0416 | |
| 0.01 | 5.27 | 6.9199 | 0.9535 | |
| 0.01 | 1.53 | 2.0137 | 0.7937 | |
| 0.01 | 2.93 | 3.8460 | 0.7920 | |
| 0.02 | 1.12 | 1.4731 | 0.7553 | |
| 0.57 | 0.57 | 0.7545 | 0.7545 | |
| 0.00 | 1.11 | 1.4535 | 0.7163 |
Penurunan Tertinggi Kuartal Ini
Kami menggunakan perubahan dalam alokasi portofolio karena ini adalah metrik yang paling bermakna. Perubahan dapat disebabkan oleh perdagangan atau perubahan harga saham.
| Keamanan | Saham (MM) |
Nilai (Juta Dolar AS) |
Portfolio % | ΔPorsyento ng Portfolio |
|---|---|---|---|---|
| 0.00 | 1.10 | 1.4516 | -3.8923 | |
| 0.01 | 1.15 | 1.5132 | -3.3930 | |
| 0.00 | 1.19 | 1.5647 | -1.3749 | |
| 0.02 | 1.15 | 1.5109 | -1.1494 | |
| 0.00 | 1.62 | 2.1301 | -1.0869 | |
| 0.00 | 0.36 | 0.4745 | -1.0562 | |
| 0.00 | 0.38 | 0.5035 | -0.9016 | |
| 0.00 | 0.62 | 0.8142 | -0.7452 | |
| 0.00 | 0.76 | 1.0014 | -0.5573 | |
| 0.01 | 1.10 | 1.4464 | -0.5094 |
Pengajuan 13F dan Dana
Formulir ini diajukan pada 2025-08-27 untuk periode pelaporan 2025-06-30. Klik ikon tautan untuk melihat riwayat transaksi selengkapnya.
Tingkatkan ke versi premium untuk membuka data premium dan ekspor ke Excel. ![]() .
.
| Keamanan | Ketik | Harga Saham Rata-rata | Saham (MM) |
ΔSaham (%) |
ΔSaham (%) |
Nilai ($MM) |
Portpolyo (%) |
ΔPortofolio (%) |
|
|---|---|---|---|---|---|---|---|---|---|
| MSFT / Microsoft Corporation | 0.01 | -5.26 | 5.27 | 25.53 | 6.9199 | 0.9535 | |||
| AMZN / Amazon.com, Inc. | 0.01 | 18.21 | 2.93 | 36.33 | 3.8460 | 0.7920 | |||
| IGQ5 / 3i Group plc | 0.05 | -5.11 | 2.67 | 14.17 | 3.5054 | 0.1831 | |||
| META / Meta Platforms, Inc. | 0.00 | 27.51 | 2.64 | 63.31 | 3.4748 | 1.1715 | |||
| NVDA / NVIDIA Corporation | 0.02 | 13.99 | 2.64 | 66.12 | 3.4735 | 1.2109 | |||
| CNSWF / Constellation Software Inc. | 0.00 | 5.03 | 2.30 | 21.64 | 3.0208 | 0.3320 | |||
| US8252524066 / Invesco Treasury Portfolio, Institutional Class | 2.09 | 33.24 | 2.09 | 33.27 | 2.7485 | 0.5158 | |||
| AAPL / Apple Inc. | 0.01 | 9.42 | 2.02 | 1.10 | 2.6543 | -0.1882 | |||
| CP / Canadian Pacific Kansas City Limited | 0.02 | 5.27 | 1.98 | 19.21 | 2.6019 | 0.2385 | |||
| 2330 / Taiwan Semiconductor Manufacturing Company Limited | 0.05 | 8.89 | 1.79 | 41.36 | 2.3544 | 0.5521 | |||
| MA / Mastercard Incorporated | 0.00 | -30.09 | 1.62 | -28.34 | 2.1301 | -1.0869 | |||
| AVGO / Broadcom Inc. | 0.01 | 8.51 | 1.53 | 78.76 | 2.0137 | 0.7937 | |||
| TXN / Texas Instruments Incorporated | 0.01 | -17.12 | 1.53 | -4.20 | 2.0064 | -0.2614 | |||
| GOOGL / Alphabet Inc. | 0.01 | -17.04 | 1.45 | -5.48 | 1.9057 | -0.2762 | |||
| JPM / JPMorgan Chase & Co. | 0.00 | 8.82 | 1.44 | 28.53 | 1.8894 | 0.2993 | |||
| HD / The Home Depot, Inc. | 0.00 | 27.34 | 1.40 | 27.37 | 1.8354 | 0.2760 | |||
| EWJ / iShares, Inc. - iShares MSCI Japan ETF | 0.02 | 1.14 | 1.33 | 10.61 | 1.7534 | 0.0373 | |||
| AME / AMETEK, Inc. | 0.01 | 12.32 | 1.33 | 18.09 | 1.7509 | 0.1460 | |||
| FERG / Ferguson Enterprises Inc. | 0.01 | -25.95 | 1.28 | 0.63 | 1.6757 | -0.1265 | |||
| APH / Amphenol Corporation | 0.01 | -36.39 | 1.24 | -4.23 | 1.6354 | -0.2129 | |||
| ODFL / Old Dominion Freight Line, Inc. | 0.01 | 4.14 | 1.24 | 2.14 | 1.6299 | -0.0970 | |||
| EOG / EOG Resources, Inc. | 0.01 | 12.81 | 1.19 | 5.31 | 1.5650 | -0.0448 | |||
| TMO / Thermo Fisher Scientific Inc. | 0.00 | -29.30 | 1.19 | -42.43 | 1.5647 | -1.3749 | |||
| HYB / HOYA Corporation | 0.01 | 37.50 | 1.18 | 44.70 | 1.5448 | 0.3892 | |||
| EXPN / Experian plc | 0.02 | 20.89 | 1.17 | 66.62 | 1.5420 | 0.4330 | |||
| 8001 / ITOCHU Corporation | 0.02 | 21.86 | 1.17 | 37.46 | 1.5343 | 0.3262 | |||
| REC / Recordati Industria Chimica e Farmaceutica S.p.A. | 0.02 | 32.85 | 1.15 | 47.38 | 1.5136 | 0.4018 | |||
| LSEG / London Stock Exchange Group plc | 0.01 | -72.27 | 1.15 | -61.75 | 1.5132 | -3.3930 | |||
| RELX / RELX PLC - Depositary Receipt (Common Stock) | 0.02 | -42.82 | 1.15 | -38.56 | 1.5109 | -1.1494 | |||
| CME / CME Group Inc. | 0.00 | -8.92 | 1.13 | -5.43 | 1.4895 | -0.2143 | |||
| US8252528851 / Invesco Government & Agency Portfolio, Institutional Class | 1.13 | 33.21 | 1.13 | 33.22 | 1.4810 | 0.2777 | |||
| 700 / Tencent Holdings Limited | 0.02 | 120.25 | 1.12 | 122.42 | 1.4731 | 0.7553 | |||
| MSI / Motorola Solutions, Inc. | 0.00 | 122.21 | 1.11 | 113.51 | 1.4535 | 0.7163 | |||
| SAPGF / SAP SE | 0.00 | -84.95 | 1.10 | -66.31 | 1.4516 | -3.8923 | |||
| ORLY / O'Reilly Automotive, Inc. | 0.01 | 1,172.29 | 1.10 | -20.00 | 1.4464 | -0.5094 | |||
| SAF / Safran SA | 0.00 | 1.06 | 1.3948 | 1.3948 | |||||
| MLM / Martin Marietta Materials, Inc. | 0.00 | 13.11 | 1.06 | 29.89 | 1.3878 | 0.2311 | |||
| AXP / American Express Company | 0.00 | -11.25 | 1.00 | 5.24 | 1.3198 | -0.0378 | |||
| LIN / Linde plc | 0.00 | 5.03 | 0.99 | 5.78 | 1.2989 | -0.0295 | |||
| MSCI / MSCI Inc. | 0.00 | -9.23 | 0.95 | -7.48 | 1.2519 | -0.2118 | |||
| ADI / Analog Devices, Inc. | 0.00 | 16.00 | 0.95 | 36.96 | 1.2422 | 0.2602 | |||
| MMC / Marsh & McLennan Companies, Inc. | 0.00 | -12.69 | 0.94 | -21.79 | 1.2316 | -0.4724 | |||
| MCO / Moody's Corporation | 0.00 | 48.17 | 0.83 | 59.58 | 1.0947 | 0.3523 | |||
| IMCD / IMCD N.V. | 0.01 | -20.18 | 0.83 | -19.34 | 1.0859 | -0.3712 | |||
| VIK / Viking Holdings Ltd | 0.01 | 0.79 | 1.0416 | 1.0416 | |||||
| BRK.B / Berkshire Hathaway Inc. | 0.00 | -23.76 | 0.76 | -30.47 | 1.0014 | -0.5573 | |||
| KO / The Coca-Cola Company | 0.01 | -0.69 | 0.74 | -1.85 | 0.9778 | -0.1010 | |||
| ASML / ASML Holding N.V. | 0.00 | 180.95 | 0.71 | 240.87 | 0.9318 | 0.6354 | |||
| RMS / Hermès International Société en commandite par actions | 0.00 | 6.79 | 0.64 | 9.98 | 0.8406 | 0.0137 | |||
| DHR / Danaher Corporation | 0.00 | -41.35 | 0.62 | -43.52 | 0.8142 | -0.7452 | |||
| UNP / Union Pacific Corporation | 0.00 | -10.96 | 0.61 | -13.30 | 0.8056 | -0.1999 | |||
| ACO4 / Atlas Copco AB (publ) | 0.04 | 2.35 | 0.58 | 3.58 | 0.7619 | -0.0342 | |||
| Invesco Private Prime Fund / STIV (N/A) | 0.57 | 0.57 | 0.7545 | 0.7545 | |||||
| RIO / Rio Tinto Group | 0.01 | 37.60 | 0.54 | 33.50 | 0.7131 | 0.1348 | |||
| OR / L'Oréal S.A. | 0.00 | -32.63 | 0.45 | -22.36 | 0.5893 | -0.2322 | |||
| EWBC / East West Bancorp, Inc. | 0.00 | 0.45 | 0.5891 | 0.5891 | |||||
| COST / Costco Wholesale Corporation | 0.00 | 6.19 | 0.42 | 10.99 | 0.5580 | 0.0146 | |||
| PGR / The Progressive Corporation | 0.00 | -58.87 | 0.38 | -61.20 | 0.5035 | -0.9016 | |||
| MC / LVMH Moët Hennessy - Louis Vuitton, Société Européenne | 0.00 | -60.30 | 0.36 | -66.45 | 0.4745 | -1.0562 | |||
| FP / TotalEnergies SE | 0.01 | 6.17 | 0.33 | 0.91 | 0.4351 | -0.0325 | |||
| IBKR / Interactive Brokers Group, Inc. | 0.01 | 0.31 | 0.4105 | 0.4105 | |||||
| CPRT / Copart, Inc. | 0.01 | -34.84 | 0.31 | -43.49 | 0.4047 | -0.3706 | |||
| ULVR / Unilever PLC | 0.00 | -45.84 | 0.30 | -44.69 | 0.3914 | -0.3733 | |||
| QXO / QXO, Inc. | 0.01 | 0.26 | 0.3427 | 0.3427 | |||||
| NOV / Novo Nordisk A/S | 0.00 | 3.00 | 0.22 | 4.25 | 0.2911 | -0.0108 | |||
| Invesco Private Government Fund / STIV (N/A) | 0.22 | 0.22 | 0.2858 | 0.2858 |