Mga Batayang Estadistika
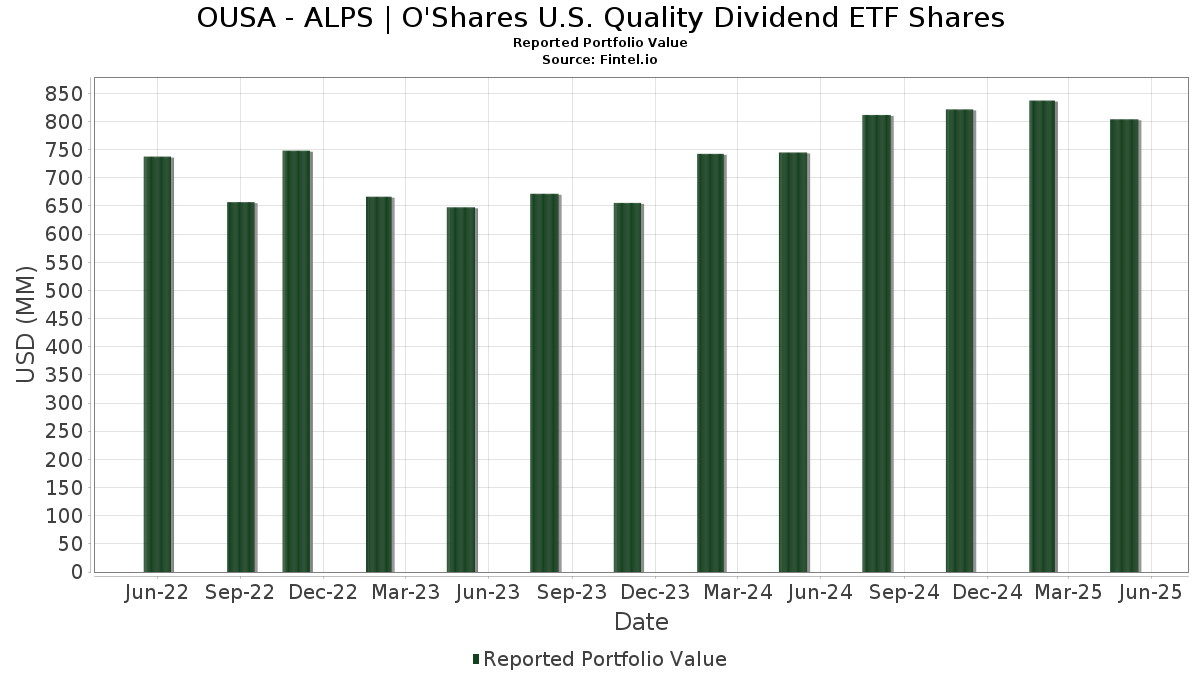
| Nilai Portofolio | $ 803,783,062 |
| Posisi Saat Ini | 101 |
Kepemilikan Terbaru, Kinerja, AUM (dari 13F, 13D)
OUSA - ALPS | O'Shares U.S. Quality Dividend ETF Shares telah mengungkapkan total kepemilikan 101 dalam pengajuan SEC terbaru mereka. Nilai portofolio terbaru dihitung sebesar $ 803,783,062 USD. Aset yang Dikelola (AUM) sebenarnya adalah nilai ini ditambah kas (yang tidak diungkapkan). Aset-aset utama OUSA - ALPS | O'Shares U.S. Quality Dividend ETF Shares adalah Visa Inc. (US:V) , Microsoft Corporation (US:MSFT) , The Home Depot, Inc. (US:HD) , Mastercard Incorporated (US:MA) , and Apple Inc. (US:AAPL) .
Peningkatan Tertinggi Kuartal Ini
Kami menggunakan perubahan dalam alokasi portofolio karena ini adalah metrik yang paling bermakna. Perubahan dapat disebabkan oleh perdagangan atau perubahan harga saham.
| Keamanan | Saham (MM) |
Nilai (Juta Dolar AS) |
Portfolio % | ΔPorsyento ng Portfolio |
|---|---|---|---|---|
| 0.09 | 43.39 | 5.3940 | 0.9307 | |
| 0.06 | 36.39 | 4.5242 | 0.2587 | |
| 0.09 | 29.54 | 3.6718 | 0.2142 | |
| 0.19 | 32.35 | 4.0221 | 0.1993 | |
| 0.05 | 4.41 | 0.5482 | 0.1599 | |
| 0.04 | 7.00 | 0.8702 | 0.1545 | |
| 0.04 | 9.64 | 1.1983 | 0.1482 | |
| 0.02 | 4.96 | 0.6169 | 0.1308 | |
| 0.17 | 7.15 | 0.8885 | 0.1100 | |
| 0.02 | 7.94 | 0.9873 | 0.1054 |
Penurunan Tertinggi Kuartal Ini
Kami menggunakan perubahan dalam alokasi portofolio karena ini adalah metrik yang paling bermakna. Perubahan dapat disebabkan oleh perdagangan atau perubahan harga saham.
| Keamanan | Saham (MM) |
Nilai (Juta Dolar AS) |
Portfolio % | ΔPorsyento ng Portfolio |
|---|---|---|---|---|
| 0.18 | 36.28 | 4.5107 | -0.6989 | |
| 0.12 | 43.43 | 5.3997 | -0.6884 | |
| 0.03 | 7.80 | 0.9691 | -0.4888 | |
| 0.34 | 25.81 | 3.2090 | -0.4839 | |
| 0.06 | 4.84 | 0.6018 | -0.1923 | |
| 0.01 | 7.39 | 0.9183 | -0.1777 | |
| 0.11 | 39.58 | 4.9210 | -0.1506 | |
| 0.06 | 20.39 | 2.5343 | -0.1365 | |
| 0.23 | 35.17 | 4.3719 | -0.0843 | |
| 0.04 | 4.02 | 0.4992 | -0.0834 |
Pengajuan 13F dan Dana
Formulir ini diajukan pada 2025-07-30 untuk periode pelaporan 2025-05-31. Klik ikon tautan untuk melihat riwayat transaksi selengkapnya.
Tingkatkan ke versi premium untuk membuka data premium dan ekspor ke Excel. ![]() .
.
| Keamanan | Ketik | Harga Saham Rata-rata | Saham (MM) |
ΔSaham (%) |
ΔSaham (%) |
Nilai ($MM) |
Portpolyo (%) |
ΔPortofolio (%) |
|
|---|---|---|---|---|---|---|---|---|---|
| V / Visa Inc. | 0.12 | -15.41 | 43.43 | -14.83 | 5.3997 | -0.6884 | |||
| MSFT / Microsoft Corporation | 0.09 | 0.08 | 43.39 | 16.05 | 5.3940 | 0.9307 | |||
| HD / The Home Depot, Inc. | 0.11 | 0.34 | 39.58 | -6.82 | 4.9210 | -0.1506 | |||
| MA / Mastercard Incorporated | 0.06 | 0.24 | 36.39 | 1.85 | 4.5242 | 0.2587 | |||
| AAPL / Apple Inc. | 0.18 | 0.12 | 36.28 | -16.85 | 4.5107 | -0.6989 | |||
| JNJ / Johnson & Johnson | 0.23 | 0.17 | 35.17 | -5.78 | 4.3719 | -0.0843 | |||
| GOOGL / Alphabet Inc. | 0.19 | 0.18 | 32.35 | 1.04 | 4.0221 | 0.1993 | |||
| MCD / McDonald's Corporation | 0.09 | 0.19 | 29.54 | 1.98 | 3.6718 | 0.2142 | |||
| CSCO / Cisco Systems, Inc. | 0.44 | 0.19 | 27.65 | -1.49 | 3.4370 | 0.0866 | |||
| MRK / Merck & Co., Inc. | 0.34 | 0.18 | 25.81 | -16.55 | 3.2090 | -0.4839 | |||
| CMCSA / Comcast Corporation | 0.72 | 0.17 | 24.79 | -3.48 | 3.0817 | 0.0154 | |||
| PG / The Procter & Gamble Company | 0.13 | 0.16 | 21.54 | -2.12 | 2.6781 | 0.0506 | |||
| ACN / Accenture plc | 0.06 | 0.24 | 20.39 | -8.87 | 2.5343 | -0.1365 | |||
| MMC / Marsh & McLennan Companies, Inc. | 0.08 | 0.15 | 18.97 | -1.61 | 2.3587 | 0.0565 | |||
| TXN / Texas Instruments Incorporated | 0.10 | 0.19 | 17.60 | -6.53 | 2.1881 | -0.0600 | |||
| ABT / Abbott Laboratories | 0.11 | 0.11 | 14.03 | -3.10 | 1.7440 | 0.0155 | |||
| TJX / The TJX Companies, Inc. | 0.10 | 0.40 | 12.10 | 2.12 | 1.5043 | 0.0897 | |||
| LOW / Lowe's Companies, Inc. | 0.05 | 0.40 | 10.21 | -8.85 | 1.2687 | -0.0680 | |||
| ITW / Illinois Tool Works Inc. | 0.04 | 0.40 | 9.95 | -6.79 | 1.2364 | -0.0374 | |||
| CTAS / Cintas Corporation | 0.04 | 0.39 | 9.64 | 9.58 | 1.1983 | 0.1482 | |||
| TMUS / T-Mobile US, Inc. | 0.04 | 0.42 | 8.97 | -9.81 | 1.1150 | -0.0723 | |||
| ABBV / AbbVie Inc. | 0.04 | 0.38 | 8.04 | -10.62 | 0.9999 | -0.0745 | |||
| LMT / Lockheed Martin Corporation | 0.02 | 0.38 | 7.94 | 7.51 | 0.9873 | 0.1054 | |||
| UNH / UnitedHealth Group Incorporated | 0.03 | 0.42 | 7.80 | -36.16 | 0.9691 | -0.4888 | |||
| T / AT&T Inc. | 0.28 | 0.40 | 7.75 | 1.83 | 0.9628 | 0.0548 | |||
| COST / Costco Wholesale Corporation | 0.01 | 0.43 | 7.74 | -0.39 | 0.9622 | 0.0347 | |||
| LLY / Eli Lilly and Company | 0.01 | 0.42 | 7.39 | -19.53 | 0.9183 | -0.1777 | |||
| KO / The Coca-Cola Company | 0.10 | 0.39 | 7.33 | 1.65 | 0.9110 | 0.0503 | |||
| FAST / Fastenal Company | 0.17 | 100.78 | 7.15 | 9.60 | 0.8885 | 0.1100 | |||
| PM / Philip Morris International Inc. | 0.04 | 0.40 | 7.00 | 16.76 | 0.8702 | 0.1545 | |||
| ADP / Automatic Data Processing, Inc. | 0.02 | 0.43 | 6.84 | 3.73 | 0.8498 | 0.0631 | |||
| VZ / Verizon Communications Inc. | 0.15 | 0.39 | 6.39 | 2.39 | 0.7940 | 0.0493 | |||
| CB / Chubb Limited | 0.02 | 0.44 | 5.93 | 4.57 | 0.7368 | 0.0601 | |||
| MO / Altria Group, Inc. | 0.10 | 0.40 | 5.91 | 8.96 | 0.7349 | 0.0872 | |||
| HON / Honeywell International Inc. | 0.03 | 0.38 | 5.85 | 6.89 | 0.7272 | 0.0738 | |||
| IBM / International Business Machines Corporation | 0.02 | 0.41 | 5.79 | 3.04 | 0.7198 | 0.0490 | |||
| UNP / Union Pacific Corporation | 0.03 | 0.42 | 5.78 | -9.77 | 0.7187 | -0.0462 | |||
| PEP / PepsiCo, Inc. | 0.04 | 0.39 | 5.40 | -14.03 | 0.6713 | -0.0785 | |||
| MCO / Moody's Corporation | 0.01 | 0.35 | 5.26 | -4.56 | 0.6538 | -0.0040 | |||
| YUM / Yum! Brands, Inc. | 0.04 | 0.39 | 5.06 | -7.59 | 0.6286 | -0.0246 | |||
| ORCL / Oracle Corporation | 0.03 | 0.40 | 5.00 | 0.08 | 0.6219 | 0.0251 | |||
| AVGO / Broadcom Inc. | 0.02 | 0.41 | 4.96 | 21.86 | 0.6169 | 0.1308 | |||
| PAYX / Paychex, Inc. | 0.03 | 0.41 | 4.85 | 4.55 | 0.6023 | 0.0490 | |||
| SBUX / Starbucks Corporation | 0.06 | 0.39 | 4.84 | -27.22 | 0.6018 | -0.1923 | |||
| QCOM / QUALCOMM Incorporated | 0.03 | 0.37 | 4.61 | -7.28 | 0.5734 | -0.0204 | |||
| TROW / T. Rowe Price Group, Inc. | 0.05 | 0.38 | 4.58 | -11.14 | 0.5694 | -0.0460 | |||
| WMT / Walmart Inc. | 0.05 | 0.40 | 4.53 | 0.53 | 0.5631 | 0.0251 | |||
| CAT / Caterpillar Inc. | 0.01 | 0.40 | 4.51 | 1.60 | 0.5605 | 0.0307 | |||
| APH / Amphenol Corporation | 0.05 | 0.40 | 4.41 | 35.58 | 0.5482 | 0.1599 | |||
| BLK / BlackRock, Inc. | 0.00 | 0.51 | 4.26 | 0.73 | 0.5295 | 0.0247 | |||
| JPM / JPMorgan Chase & Co. | 0.02 | 0.42 | 4.19 | 0.17 | 0.5204 | 0.0215 | |||
| MSCI / MSCI Inc. | 0.01 | 0.44 | 4.16 | -4.08 | 0.5173 | -0.0005 | |||
| GRMN / Garmin Ltd. | 0.02 | 0.41 | 4.15 | -10.97 | 0.5155 | -0.0406 | |||
| EA / Electronic Arts Inc. | 0.03 | 0.40 | 4.07 | 11.78 | 0.5062 | 0.0714 | |||
| TEL / TE Connectivity plc | 0.03 | 0.37 | 4.03 | 4.32 | 0.5010 | 0.0397 | |||
| UPS / United Parcel Service, Inc. | 0.04 | 0.41 | 4.02 | -17.73 | 0.4992 | -0.0834 | |||
| OTIS / Otis Worldwide Corporation | 0.04 | 0.37 | 3.94 | -4.07 | 0.4895 | -0.0006 | |||
| ZTS / Zoetis Inc. | 0.02 | 0.41 | 3.76 | 1.24 | 0.4669 | 0.0241 | |||
| SPGI / S&P Global Inc. | 0.01 | 0.31 | 3.62 | -3.59 | 0.4502 | 0.0017 | |||
| WM / Waste Management, Inc. | 0.01 | 0.37 | 3.50 | 3.92 | 0.4352 | 0.0330 | |||
| CTSH / Cognizant Technology Solutions Corporation | 0.04 | 0.38 | 3.42 | -2.45 | 0.4257 | 0.0067 | |||
| EBAY / eBay Inc. | 0.04 | 0.38 | 3.21 | 13.44 | 0.3988 | 0.0612 | |||
| AON / Aon plc | 0.01 | 0.40 | 3.16 | -8.71 | 0.3923 | -0.0203 | |||
| CBOE / Cboe Global Markets, Inc. | 0.01 | 0.44 | 2.94 | 9.16 | 0.3661 | 0.0440 | |||
| PCAR / PACCAR Inc | 0.03 | 0.40 | 2.84 | -12.16 | 0.3532 | -0.0328 | |||
| CL / Colgate-Palmolive Company | 0.03 | 0.39 | 2.75 | 2.35 | 0.3416 | 0.0210 | |||
| MSI / Motorola Solutions, Inc. | 0.01 | 0.48 | 2.60 | -5.21 | 0.3235 | -0.0042 | |||
| NKE / NIKE, Inc. | 0.04 | 0.41 | 2.55 | -23.41 | 0.3173 | -0.0805 | |||
| SYK / Stryker Corporation | 0.01 | 0.39 | 2.54 | -0.51 | 0.3156 | 0.0109 | |||
| GD / General Dynamics Corporation | 0.01 | 0.34 | 2.48 | 10.63 | 0.3081 | 0.0406 | |||
| AMGN / Amgen Inc. | 0.01 | 0.40 | 2.46 | -6.10 | 0.3063 | -0.0069 | |||
| ETN / Eaton Corporation plc | 0.01 | 0.43 | 2.37 | 9.67 | 0.2946 | 0.0366 | |||
| MDT / Medtronic plc | 0.03 | 0.40 | 2.26 | -9.48 | 0.2815 | -0.0171 | |||
| TSCO / Tractor Supply Company | 0.05 | 0.34 | 2.21 | -12.25 | 0.2751 | -0.0260 | |||
| TT / Trane Technologies plc | 0.01 | 0.33 | 2.20 | 22.07 | 0.2737 | 0.0584 | |||
| DE / Deere & Company | 0.00 | 0.51 | 2.20 | 5.83 | 0.2732 | 0.0253 | |||
| GWW / W.W. Grainger, Inc. | 0.00 | 0.40 | 2.20 | 6.92 | 0.2730 | 0.0278 | |||
| CSX / CSX Corporation | 0.07 | 0.39 | 2.15 | -0.92 | 0.2677 | 0.0082 | |||
| SNA / Snap-on Incorporated | 0.01 | 0.48 | 2.01 | -5.55 | 0.2496 | -0.0041 | |||
| MDLZ / Mondelez International, Inc. | 0.03 | 0.38 | 1.94 | 5.51 | 0.2406 | 0.0215 | |||
| GILD / Gilead Sciences, Inc. | 0.02 | 0.42 | 1.93 | -3.26 | 0.2396 | 0.0017 | |||
| KMB / Kimberly-Clark Corporation | 0.01 | 0.45 | 1.81 | 1.69 | 0.2248 | 0.0125 | |||
| HSY / The Hershey Company | 0.01 | 0.36 | 1.70 | -6.59 | 0.2115 | -0.0060 | |||
| ELV / Elevance Health, Inc. | 0.00 | 0.42 | 1.47 | -2.85 | 0.1825 | 0.0020 | |||
| INTU / Intuit Inc. | 0.00 | 0.41 | 1.46 | 23.21 | 0.1816 | 0.0401 | |||
| VRSK / Verisk Analytics, Inc. | 0.00 | 0.51 | 1.36 | 6.33 | 0.1691 | 0.0164 | |||
| GGG / Graco Inc. | 0.01 | 0.37 | 1.23 | -2.39 | 0.1524 | 0.0024 | |||
| EXPD / Expeditors International of Washington, Inc. | 0.01 | 0.35 | 1.22 | -3.64 | 0.1514 | 0.0006 | |||
| ADI / Analog Devices, Inc. | 0.01 | 0.43 | 1.21 | -6.56 | 0.1506 | -0.0042 | |||
| A / Agilent Technologies, Inc. | 0.01 | 0.41 | 1.16 | -12.18 | 0.1444 | -0.0135 | |||
| CMI / Cummins Inc. | 0.00 | 0.45 | 1.14 | -12.25 | 0.1416 | -0.0134 | |||
| AME / AMETEK, Inc. | 0.01 | 0.32 | 1.11 | -5.28 | 0.1384 | -0.0019 | |||
| IEX / IDEX Corporation | 0.01 | 0.34 | 1.08 | -6.59 | 0.1340 | -0.0038 | |||
| NOC / Northrop Grumman Corporation | 0.00 | 0.18 | 1.07 | 5.20 | 0.1334 | 0.0116 | |||
| TMO / Thermo Fisher Scientific Inc. | 0.00 | 0.40 | 0.82 | -23.57 | 0.1016 | -0.0260 | |||
| KR / The Kroger Co. | 0.01 | 0.38 | 0.78 | 5.67 | 0.0974 | 0.0089 | |||
| GIS / General Mills, Inc. | 0.01 | 0.43 | 0.74 | -10.17 | 0.0923 | -0.0063 | |||
| KVUE / Kenvue Inc. | 0.03 | 0.38 | 0.69 | 1.63 | 0.0853 | 0.0046 | |||
| TGT / Target Corporation | 0.01 | 0.31 | 0.54 | -24.06 | 0.0675 | -0.0179 | |||
| CHD / Church & Dwight Co., Inc. | 0.00 | 0.49 | 0.44 | -11.22 | 0.0551 | -0.0045 | |||
| US8574928623 / State Street Institutional Treasury Plus Money Market Fund | 0.24 | -34.02 | 0.24 | -34.06 | 0.0301 | -0.0137 |