Mga Batayang Estadistika
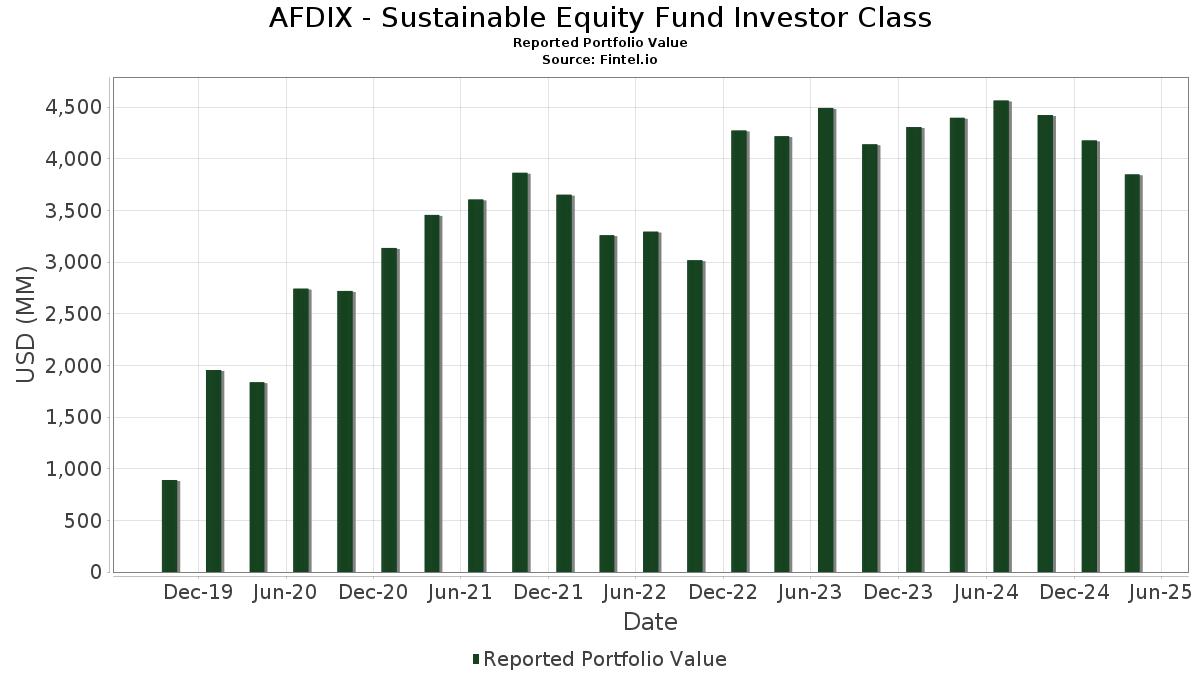
| Nilai Portofolio | $ 3,848,791,528 |
| Posisi Saat Ini | 134 |
Kepemilikan Terbaru, Kinerja, AUM (dari 13F, 13D)
AFDIX - Sustainable Equity Fund Investor Class telah mengungkapkan total kepemilikan 134 dalam pengajuan SEC terbaru mereka. Nilai portofolio terbaru dihitung sebesar $ 3,848,791,528 USD. Aset yang Dikelola (AUM) sebenarnya adalah nilai ini ditambah kas (yang tidak diungkapkan). Aset-aset utama AFDIX - Sustainable Equity Fund Investor Class adalah Microsoft Corporation (US:MSFT) , NVIDIA Corporation (US:NVDA) , Apple Inc. (US:AAPL) , iShares Trust - iShares Core S&P 500 ETF (US:IVV) , and Alphabet Inc. (US:GOOGL) . Posisi baru AFDIX - Sustainable Equity Fund Investor Class meliputi: Expro Group Holdings N.V. (US:XPRO) , Church & Dwight Co., Inc. (US:CHD) , Automatic Data Processing, Inc. (US:ADP) , Copart, Inc. (US:CPRT) , and .
Peningkatan Tertinggi Kuartal Ini
Kami menggunakan perubahan dalam alokasi portofolio karena ini adalah metrik yang paling bermakna. Perubahan dapat disebabkan oleh perdagangan atau perubahan harga saham.
| Keamanan | Saham (MM) |
Nilai (Juta Dolar AS) |
Portfolio % | ΔPorsyento ng Portfolio |
|---|---|---|---|---|
| 0.28 | 158.52 | 4.1167 | 3.7313 | |
| 0.13 | 24.55 | 0.6376 | 0.6376 | |
| 0.02 | 27.60 | 0.7169 | 0.6157 | |
| 0.22 | 21.97 | 0.5706 | 0.5706 | |
| 0.07 | 20.39 | 0.5295 | 0.5295 | |
| 0.32 | 19.26 | 0.5002 | 0.5002 | |
| 0.12 | 39.76 | 1.0325 | 0.4060 | |
| 0.06 | 58.28 | 1.5134 | 0.2552 | |
| 0.76 | 299.40 | 7.7753 | 0.2517 | |
| 0.13 | 30.94 | 0.8034 | 0.2253 |
Penurunan Tertinggi Kuartal Ini
Kami menggunakan perubahan dalam alokasi portofolio karena ini adalah metrik yang paling bermakna. Perubahan dapat disebabkan oleh perdagangan atau perubahan harga saham.
| Keamanan | Saham (MM) |
Nilai (Juta Dolar AS) |
Portfolio % | ΔPorsyento ng Portfolio |
|---|---|---|---|---|
| 0.82 | 174.98 | 4.5443 | -1.5502 | |
| 1.78 | 193.40 | 5.0225 | -1.0762 | |
| 0.90 | 142.98 | 3.7131 | -0.7964 | |
| 0.19 | 52.71 | 1.3688 | -0.7654 | |
| 0.72 | 132.03 | 3.4287 | -0.7019 | |
| 0.17 | 91.90 | 2.3867 | -0.4811 | |
| 0.02 | 3.98 | 0.1034 | -0.3729 | |
| 0.14 | 56.48 | 1.4667 | -0.3153 | |
| 0.46 | 89.23 | 2.3173 | -0.2692 | |
| 0.03 | 3.93 | 0.1021 | -0.2026 |
Pengajuan 13F dan Dana
Formulir ini diajukan pada 2025-06-27 untuk periode pelaporan 2025-04-30. Klik ikon tautan untuk melihat riwayat transaksi selengkapnya.
Tingkatkan ke versi premium untuk membuka data premium dan ekspor ke Excel. ![]() .
.
| Keamanan | Ketik | Harga Saham Rata-rata | Saham (MM) |
ΔSaham (%) |
ΔSaham (%) |
Nilai ($MM) |
Portpolyo (%) |
ΔPortofolio (%) |
|
|---|---|---|---|---|---|---|---|---|---|
| MSFT / Microsoft Corporation | 0.76 | 0.00 | 299.40 | -4.77 | 7.7753 | 0.2517 | |||
| NVDA / NVIDIA Corporation | 1.78 | -16.35 | 193.40 | -24.11 | 5.0225 | -1.0762 | |||
| AAPL / Apple Inc. | 0.82 | -23.69 | 174.98 | -31.29 | 4.5443 | -1.5502 | |||
| IVV / iShares Trust - iShares Core S&P 500 ETF | 0.28 | 966.66 | 158.52 | 884.28 | 4.1167 | 3.7313 | |||
| GOOGL / Alphabet Inc. | 0.90 | -2.52 | 142.98 | -24.13 | 3.7131 | -0.7964 | |||
| AMZN / Amazon.com, Inc. | 0.72 | -1.42 | 132.03 | -23.51 | 3.4287 | -0.7019 | |||
| META / Meta Platforms, Inc. | 0.17 | -3.73 | 91.90 | -23.31 | 2.3867 | -0.4811 | |||
| AVGO / Broadcom Inc. | 0.46 | -5.09 | 89.23 | -17.44 | 2.3173 | -0.2692 | |||
| MA / Mastercard Incorporated | 0.14 | 4.44 | 76.28 | 3.05 | 1.9810 | 0.2097 | |||
| JPM / JPMorgan Chase & Co. | 0.27 | -3.72 | 67.22 | -11.89 | 1.7457 | -0.0799 | |||
| HD / The Home Depot, Inc. | 0.16 | 0.00 | 58.60 | -12.50 | 1.5219 | -0.0808 | |||
| LLY / Eli Lilly and Company | 0.06 | 0.00 | 58.28 | 10.83 | 1.5134 | 0.2552 | |||
| UNH / UnitedHealth Group Incorporated | 0.14 | 0.00 | 56.48 | -24.16 | 1.4667 | -0.3153 | |||
| NEE / NextEra Energy, Inc. | 0.84 | 0.00 | 56.10 | -6.54 | 1.4568 | 0.0205 | |||
| TSLA / Tesla, Inc. | 0.19 | -15.26 | 52.71 | -40.90 | 1.3688 | -0.7654 | |||
| PG / The Procter & Gamble Company | 0.31 | 12.73 | 51.14 | 10.41 | 1.3282 | 0.2197 | |||
| JCI / Johnson Controls International plc | 0.55 | 0.00 | 45.87 | 7.56 | 1.1914 | 0.1708 | |||
| TJX / The TJX Companies, Inc. | 0.35 | 0.00 | 45.40 | 3.12 | 1.1791 | 0.1254 | |||
| CDNS / Cadence Design Systems, Inc. | 0.15 | 0.00 | 45.13 | 0.04 | 1.1721 | 0.0925 | |||
| SPGI / S&P Global Inc. | 0.09 | 0.00 | 44.46 | -4.10 | 1.1545 | 0.0452 | |||
| MS / Morgan Stanley | 0.38 | 0.00 | 44.19 | -16.62 | 1.1476 | -0.1207 | |||
| LIN / Linde plc | 0.09 | 0.00 | 42.82 | 1.59 | 1.1120 | 0.1034 | |||
| EQIX / Equinix, Inc. | 0.05 | 4.73 | 42.69 | -1.34 | 1.1087 | 0.0733 | |||
| V / Visa Inc. | 0.12 | 50.24 | 39.76 | 51.87 | 1.0325 | 0.4060 | |||
| IBM / International Business Machines Corporation | 0.16 | 9.78 | 39.48 | 3.82 | 1.0254 | 0.1153 | |||
| ADI / Analog Devices, Inc. | 0.20 | 10.97 | 39.44 | 2.08 | 1.0243 | 0.0997 | |||
| ABBV / AbbVie Inc. | 0.20 | 0.00 | 39.33 | 6.09 | 1.0214 | 0.1342 | |||
| BAC / Bank of America Corporation | 0.98 | 6.89 | 39.17 | -7.94 | 1.0172 | -0.0009 | |||
| DHR / Danaher Corporation | 0.19 | 0.00 | 36.93 | -10.51 | 0.9590 | -0.0285 | |||
| ACN / Accenture plc | 0.12 | 36.64 | 36.79 | 6.19 | 0.9553 | 0.1263 | |||
| MSI / Motorola Solutions, Inc. | 0.08 | 22.22 | 36.67 | 14.71 | 0.9523 | 0.1873 | |||
| CI / The Cigna Group | 0.11 | 0.00 | 35.97 | 15.58 | 0.9341 | 0.1894 | |||
| PLD / Prologis, Inc. | 0.35 | -5.01 | 35.85 | -18.59 | 0.9311 | -0.1228 | |||
| SLB / Schlumberger Limited | 1.02 | 0.00 | 33.92 | -17.45 | 0.8808 | -0.1024 | |||
| PEP / PepsiCo, Inc. | 0.23 | -13.00 | 31.75 | -21.72 | 0.8245 | -0.1461 | |||
| COST / Costco Wholesale Corporation | 0.03 | 0.00 | 31.74 | 1.49 | 0.8243 | 0.0759 | |||
| RF / Regions Financial Corporation | 1.54 | 0.00 | 31.45 | -17.17 | 0.8167 | -0.0918 | |||
| LNG / Cheniere Energy, Inc. | 0.13 | 23.93 | 30.94 | 28.06 | 0.8034 | 0.2253 | |||
| XYL / Xylem Inc. | 0.25 | 31.41 | 30.69 | 27.74 | 0.7970 | 0.2221 | |||
| MET / MetLife, Inc. | 0.39 | 33.72 | 29.53 | 16.50 | 0.7670 | 0.1603 | |||
| SYY / Sysco Corporation | 0.41 | 0.00 | 29.52 | -2.08 | 0.7666 | 0.0452 | |||
| ISRG / Intuitive Surgical, Inc. | 0.06 | 0.00 | 28.68 | -9.81 | 0.7449 | -0.0161 | |||
| ECL / Ecolab Inc. | 0.11 | 0.00 | 28.19 | 0.50 | 0.7322 | 0.0608 | |||
| VZ / Verizon Communications Inc. | 0.64 | 0.00 | 28.17 | 11.86 | 0.7316 | 0.1289 | |||
| ZTS / Zoetis Inc. | 0.18 | 0.00 | 28.06 | -8.48 | 0.7287 | -0.0050 | |||
| ETN / Eaton Corporation plc | 0.09 | -18.56 | 27.82 | -26.56 | 0.7225 | -0.1840 | |||
| NFLX / Netflix, Inc. | 0.02 | 463.30 | 27.60 | 552.71 | 0.7169 | 0.6157 | |||
| AXP / American Express Company | 0.10 | 0.00 | 27.43 | -16.08 | 0.7123 | -0.0698 | |||
| HON / Honeywell International Inc. | 0.13 | 0.00 | 27.30 | -5.91 | 0.7090 | 0.0147 | |||
| HLT / Hilton Worldwide Holdings Inc. | 0.12 | 0.00 | 26.68 | -11.95 | 0.6929 | -0.0322 | |||
| WDAY / Workday, Inc. | 0.11 | 0.00 | 26.37 | -6.51 | 0.6849 | 0.0098 | |||
| TSCO / Tractor Supply Company | 0.52 | 26.28 | 26.32 | 17.59 | 0.6836 | 0.1479 | |||
| UNP / Union Pacific Corporation | 0.12 | -12.00 | 26.05 | -23.41 | 0.6766 | -0.1374 | |||
| CMI / Cummins Inc. | 0.09 | -12.83 | 25.64 | -28.11 | 0.6659 | -0.1876 | |||
| AMP / Ameriprise Financial, Inc. | 0.05 | 0.00 | 25.31 | -13.32 | 0.6572 | -0.0414 | |||
| XPRO / Expro Group Holdings N.V. | 0.13 | 24.55 | 0.6376 | 0.6376 | |||||
| TMO / Thermo Fisher Scientific Inc. | 0.06 | 0.00 | 24.31 | -28.23 | 0.6314 | -0.1793 | |||
| BLK / BlackRock, Inc. | 0.03 | -16.28 | 24.10 | -28.83 | 0.6260 | -0.1845 | |||
| PGR / The Progressive Corporation | 0.08 | -29.68 | 23.84 | -19.61 | 0.6190 | -0.0905 | |||
| BKNG / Booking Holdings Inc. | 0.00 | -45.75 | 23.77 | 2.98 | 0.6174 | 0.0709 | |||
| CMG / Chipotle Mexican Grill, Inc. | 0.47 | 0.00 | 23.50 | -13.42 | 0.6104 | -0.0392 | |||
| UBER / Uber Technologies, Inc. | 0.29 | -20.28 | 23.27 | -3.40 | 0.6042 | 0.0279 | |||
| MMC / Marsh & McLennan Companies, Inc. | 0.10 | 0.00 | 22.96 | 3.96 | 0.5962 | 0.0678 | |||
| IDXX / IDEXX Laboratories, Inc. | 0.05 | 16.37 | 22.42 | 19.29 | 0.5821 | 0.1325 | |||
| VRTX / Vertex Pharmaceuticals Incorporated | 0.04 | 0.00 | 22.39 | 10.36 | 0.5814 | 0.0959 | |||
| CHD / Church & Dwight Co., Inc. | 0.22 | 21.97 | 0.5706 | 0.5706 | |||||
| ICE / Intercontinental Exchange, Inc. | 0.13 | 10.72 | 21.56 | 16.35 | 0.5598 | 0.1165 | |||
| DE / Deere & Company | 0.04 | 0.00 | 20.59 | -2.73 | 0.5347 | 0.0282 | |||
| ADP / Automatic Data Processing, Inc. | 0.07 | 20.39 | 0.5295 | 0.5295 | |||||
| ASML / ASML Holding N.V. | 0.03 | 11.97 | 20.38 | 1.32 | 0.5293 | 0.0479 | |||
| CRM / Salesforce, Inc. | 0.07 | 0.00 | 20.03 | -21.36 | 0.5201 | -0.0893 | |||
| KKR / KKR & Co. Inc. | 0.17 | 0.00 | 19.88 | -31.60 | 0.5163 | -0.1793 | |||
| PH / Parker-Hannifin Corporation | 0.03 | -23.08 | 19.41 | -34.17 | 0.5040 | -0.2015 | |||
| CPRT / Copart, Inc. | 0.32 | 19.26 | 0.5002 | 0.5002 | |||||
| CRWD / CrowdStrike Holdings, Inc. | 0.04 | -10.65 | 19.17 | -3.74 | 0.4979 | 0.0213 | |||
| ANET / Arista Networks Inc | 0.22 | 0.00 | 18.11 | -28.61 | 0.4703 | -0.1367 | |||
| MRK / Merck & Co., Inc. | 0.21 | 0.00 | 17.74 | -13.78 | 0.4607 | -0.0317 | |||
| COP / ConocoPhillips | 0.19 | 0.00 | 17.12 | -9.83 | 0.4445 | -0.0097 | |||
| LKQ / LKQ Corporation | 0.43 | 0.00 | 16.37 | 2.20 | 0.4252 | 0.0418 | |||
| CDW / CDW Corporation | 0.10 | 0.00 | 16.06 | -19.37 | 0.4170 | -0.0596 | |||
| URI / United Rentals, Inc. | 0.03 | 29.74 | 15.82 | 8.07 | 0.4107 | 0.0605 | |||
| CL / Colgate-Palmolive Company | 0.17 | 0.00 | 15.64 | 6.34 | 0.4061 | 0.0542 | |||
| BLL / Ball Corp. | 0.30 | 0.00 | 15.51 | -6.75 | 0.4028 | 0.0048 | |||
| NVO / Novo Nordisk A/S - Depositary Receipt (Common Stock) | 0.23 | 0.00 | 15.41 | -20.80 | 0.4001 | -0.0654 | |||
| NOW / ServiceNow, Inc. | 0.02 | 15.60 | 14.97 | 8.41 | 0.3888 | 0.0583 | |||
| DT / Dynatrace, Inc. | 0.31 | 54.29 | 14.65 | 25.49 | 0.3803 | 0.1011 | |||
| FERG / Ferguson Enterprises Inc. | 0.08 | 0.00 | 14.20 | -6.33 | 0.3688 | 0.0060 | |||
| A / Agilent Technologies, Inc. | 0.12 | 0.00 | 12.74 | -28.99 | 0.3308 | -0.0984 | |||
| FDX / FedEx Corporation | 0.06 | 0.00 | 12.34 | -20.59 | 0.3206 | -0.0514 | |||
| GEV / GE Vernova Inc. | 0.03 | 0.00 | 12.30 | -0.55 | 0.3195 | 0.0235 | |||
| BMY / Bristol-Myers Squibb Company | 0.24 | 39.22 | 11.82 | 18.55 | 0.3070 | 0.0684 | |||
| EOG / EOG Resources, Inc. | 0.10 | -31.83 | 10.93 | -40.21 | 0.2838 | -0.1536 | |||
| XYZ / Block, Inc. | 0.18 | 0.00 | 10.57 | -35.62 | 0.2746 | -0.1184 | |||
| KMX / CarMax, Inc. | 0.15 | 0.00 | 9.82 | -24.49 | 0.2549 | -0.0562 | |||
| MDB / MongoDB, Inc. | 0.05 | 20.82 | 8.57 | -23.89 | 0.2225 | -0.0469 | |||
| DECK / Deckers Outdoor Corporation | 0.07 | 0.00 | 8.17 | -37.51 | 0.2122 | -0.1007 | |||
| Fixed Income Clearing Corp 4.36 05/01/2025 / RA (RPEN2JAO5) | 8.01 | 0.2081 | 0.2081 | ||||||
| ABNB / Airbnb, Inc. | 0.06 | 0.00 | 7.21 | -7.04 | 0.1871 | 0.0016 | |||
| ARM / Arm Holdings plc - Depositary Receipt (Common Stock) | 0.06 | 0.00 | 6.84 | -28.52 | 0.1775 | -0.0513 | |||
| YETI / YETI Holdings, Inc. | 0.23 | -15.65 | 6.62 | -35.37 | 0.1720 | -0.0732 | |||
| FWONK / Formula One Group | 0.07 | 0.00 | 6.40 | -7.36 | 0.1662 | 0.0009 | |||
| SBAC / SBA Communications Corporation | 0.02 | -78.79 | 3.98 | -80.21 | 0.1034 | -0.3729 | |||
| AMAT / Applied Materials, Inc. | 0.03 | -63.05 | 3.93 | -69.13 | 0.1021 | -0.2026 | |||
| SAIA / Saia, Inc. | 0.00 | -68.31 | 1.09 | -83.90 | 0.0282 | -0.1331 | |||
| JETD / MAX Airlines -3X Inverse Leveraged ETNs due May 28, 2043 - Structured Product | 1.00 | 0.0260 | 0.0260 | ||||||
| BOUGHT EUR/SOLD USD / DFE (N/A) | 0.04 | 0.0010 | 0.0010 | ||||||
| US90269A5341 / UBSW (LUV) (conv) 4.25% 2/6/2020 | 0.04 | 0.0009 | 0.0009 | ||||||
| BA.C / Bank of America Corporation - Depositary Receipt (Common Stock) | 0.03 | 0.0007 | 0.0007 | ||||||
| US90269A5341 / UBSW (LUV) (conv) 4.25% 2/6/2020 | 0.02 | 0.0006 | 0.0006 | ||||||
| BOUGHT EUR/SOLD USD / DFE (N/A) | 0.02 | 0.0006 | 0.0006 | ||||||
| GVMXX / State Street Institutional Investment Trust - State Street Institutional US Govt Money Market Fnd Premier Cls | 0.02 | -38.00 | 0.02 | -38.89 | 0.0006 | -0.0003 | |||
| US90269A5341 / UBSW (LUV) (conv) 4.25% 2/6/2020 | 0.02 | 0.0006 | 0.0006 | ||||||
| US90269A5341 / UBSW (LUV) (conv) 4.25% 2/6/2020 | 0.02 | 0.0006 | 0.0006 | ||||||
| US90269A5341 / UBSW (LUV) (conv) 4.25% 2/6/2020 | 0.02 | 0.0004 | 0.0004 | ||||||
| BOUGHT EUR/SOLD USD / DFE (N/A) | 0.01 | 0.0004 | 0.0004 | ||||||
| BA.C / Bank of America Corporation - Depositary Receipt (Common Stock) | 0.01 | 0.0004 | 0.0004 | ||||||
| US90269A5341 / UBSW (LUV) (conv) 4.25% 2/6/2020 | 0.01 | 0.0003 | 0.0003 | ||||||
| BA.C / Bank of America Corporation - Depositary Receipt (Common Stock) | 0.00 | 0.0001 | 0.0001 | ||||||
| BA.C / Bank of America Corporation - Depositary Receipt (Common Stock) | 0.00 | 0.0001 | 0.0001 | ||||||
| BA.C / Bank of America Corporation - Depositary Receipt (Common Stock) | 0.00 | 0.0001 | 0.0001 | ||||||
| SOLD DKK/BOUGHT USD / DFE (N/A) | 0.00 | 0.0000 | 0.0000 | ||||||
| SOLD DKK/BOUGHT USD / DFE (N/A) | 0.00 | 0.0000 | 0.0000 | ||||||
| SOLD DKK/BOUGHT USD / DFE (N/A) | 0.00 | 0.0000 | 0.0000 | ||||||
| BOUGHT EUR/SOLD USD / DFE (N/A) | -0.00 | -0.0001 | -0.0001 | ||||||
| BOUGHT EUR/SOLD USD / DFE (N/A) | -0.00 | -0.0001 | -0.0001 | ||||||
| BOUGHT DKK/SOLD USD / DFE (N/A) | -0.00 | -0.0001 | -0.0001 | ||||||
| BOUGHT DKK/SOLD USD / DFE (N/A) | -0.00 | -0.0001 | -0.0001 | ||||||
| BOUGHT DKK/SOLD USD / DFE (N/A) | -0.00 | -0.0001 | -0.0001 | ||||||
| BA.C / Bank of America Corporation - Depositary Receipt (Common Stock) | -0.02 | -0.0004 | -0.0004 | ||||||
| SOLD EUR/BOUGHT USD / DFE (N/A) | -0.21 | -0.0055 | -0.0055 | ||||||
| BA.C / Bank of America Corporation - Depositary Receipt (Common Stock) | -0.21 | -0.0055 | -0.0055 | ||||||
| SOLD EUR/BOUGHT USD / DFE (N/A) | -0.21 | -0.0055 | -0.0055 | ||||||
| US90269A5341 / UBSW (LUV) (conv) 4.25% 2/6/2020 | -0.21 | -0.0055 | -0.0055 | ||||||
| US90269A5341 / UBSW (LUV) (conv) 4.25% 2/6/2020 | -0.64 | -0.0166 | -0.0166 |