Mga Batayang Estadistika
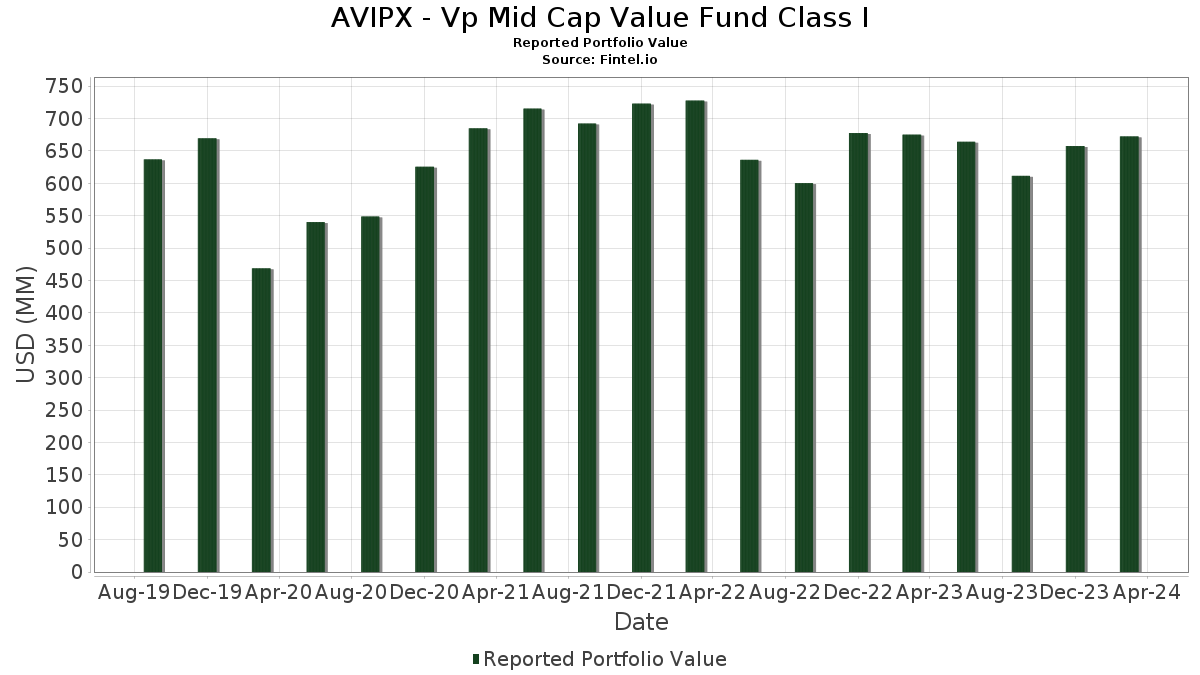
| Nilai Portofolio | $ 672,297,531 |
| Posisi Saat Ini | 110 |
Kepemilikan Terbaru, Kinerja, AUM (dari 13F, 13D)
AVIPX - Vp Mid Cap Value Fund Class I telah mengungkapkan total kepemilikan 110 dalam pengajuan SEC terbaru mereka. Nilai portofolio terbaru dihitung sebesar $ 672,297,531 USD. Aset yang Dikelola (AUM) sebenarnya adalah nilai ini ditambah kas (yang tidak diungkapkan). Aset-aset utama AVIPX - Vp Mid Cap Value Fund Class I adalah Zimmer Biomet Holdings, Inc. (US:ZBH) , Conagra Brands, Inc. (US:CAG) , Northern Trust Corporation (US:NTRS) , The Bank of New York Mellon Corporation (US:BK) , and Enterprise Products Partners L.P. - Limited Partnership (US:EPD) . Posisi baru AVIPX - Vp Mid Cap Value Fund Class I meliputi: Equity Residential (US:EQR) , GE HealthCare Technologies Inc. (US:GEHC) , Darden Restaurants, Inc. (US:DRI) , Cabot Oil & Gas Corp. (US:COG) , and Pernod Ricard SA - Depositary Receipt (Common Stock) (US:PRNDY) .
Peningkatan Tertinggi Kuartal Ini
Kami menggunakan perubahan dalam alokasi portofolio karena ini adalah metrik yang paling bermakna. Perubahan dapat disebabkan oleh perdagangan atau perubahan harga saham.
| Keamanan | Saham (MM) |
Nilai (Juta Dolar AS) |
Portfolio % | ΔPorsyento ng Portfolio |
|---|---|---|---|---|
| 8.49 | 1.2610 | 1.2610 | ||
| 0.08 | 4.88 | 0.7254 | 0.7254 | |
| 0.03 | 4.38 | 0.6504 | 0.6504 | |
| 0.05 | 4.12 | 0.6123 | 0.6123 | |
| 0.34 | 7.29 | 1.0829 | 0.6011 | |
| 0.02 | 3.67 | 0.5454 | 0.5454 | |
| 0.01 | 3.62 | 0.5374 | 0.5374 | |
| 0.02 | 3.60 | 0.5350 | 0.5350 | |
| 0.12 | 3.47 | 0.5152 | 0.5152 | |
| 0.02 | 3.44 | 0.5105 | 0.5105 |
Penurunan Tertinggi Kuartal Ini
Kami menggunakan perubahan dalam alokasi portofolio karena ini adalah metrik yang paling bermakna. Perubahan dapat disebabkan oleh perdagangan atau perubahan harga saham.
| Keamanan | Saham (MM) |
Nilai (Juta Dolar AS) |
Portfolio % | ΔPorsyento ng Portfolio |
|---|---|---|---|---|
| 0.01 | 3.14 | 0.4671 | -0.7815 | |
| 0.02 | 4.51 | 0.6701 | -0.7127 | |
| 0.00 | 0.00 | -0.6900 | ||
| 0.53 | 5.03 | 0.7479 | -0.5748 | |
| 0.07 | 11.80 | 1.7526 | -0.5162 | |
| 0.14 | 4.10 | 0.6096 | -0.4746 | |
| 0.02 | 1.50 | 0.2233 | -0.4477 | |
| 0.13 | 7.83 | 1.1640 | -0.4370 | |
| 0.07 | 9.45 | 1.4042 | -0.3661 | |
| 0.03 | 6.72 | 0.9983 | -0.3134 |
Pengajuan 13F dan Dana
Formulir ini diajukan pada 2024-05-29 untuk periode pelaporan 2024-03-31. Klik ikon tautan untuk melihat riwayat transaksi selengkapnya.
Tingkatkan ke versi premium untuk membuka data premium dan ekspor ke Excel. ![]() .
.
| Keamanan | Ketik | Harga Saham Rata-rata | Saham (MM) |
ΔSaham (%) |
ΔSaham (%) |
Nilai ($MM) |
Portpolyo (%) |
ΔPortofolio (%) |
|
|---|---|---|---|---|---|---|---|---|---|
| ZBH / Zimmer Biomet Holdings, Inc. | 0.16 | -7.14 | 20.53 | 0.71 | 3.0509 | -0.0380 | |||
| CAG / Conagra Brands, Inc. | 0.54 | -1.16 | 16.08 | 2.22 | 2.3894 | 0.0060 | |||
| NTRS / Northern Trust Corporation | 0.17 | -2.61 | 14.69 | 2.63 | 2.1823 | 0.0142 | |||
| BK / The Bank of New York Mellon Corporation | 0.25 | -9.60 | 14.17 | 0.07 | 2.1056 | -0.0398 | |||
| EPD / Enterprise Products Partners L.P. - Limited Partnership | 0.47 | -0.59 | 13.60 | 10.08 | 2.0202 | 0.1491 | |||
| KMB / Kimberly-Clark Corporation | 0.10 | 7.86 | 13.41 | 14.83 | 1.9931 | 0.2232 | |||
| HSIC / Henry Schein, Inc. | 0.18 | -10.17 | 13.37 | -10.39 | 1.9863 | -0.2739 | |||
| DGX / Quest Diagnostics Incorporated | 0.10 | 7.92 | 13.18 | 4.19 | 1.9581 | 0.0418 | |||
| ADRNY / Koninklijke Ahold Delhaize N.V. - Depositary Receipt (Common Stock) | 0.42 | 0.00 | 12.45 | 3.99 | 1.8504 | 0.0362 | |||
| ALL / The Allstate Corporation | 0.07 | -36.27 | 11.80 | -21.24 | 1.7526 | -0.5162 | |||
| EIX / Edison International | 0.15 | 17.68 | 10.83 | 16.43 | 1.6091 | 0.1999 | |||
| NSC / Norfolk Southern Corporation | 0.04 | -19.01 | 10.48 | -12.67 | 1.5570 | -0.2609 | |||
| NWE / NorthWestern Energy Group, Inc. | 0.21 | 0.00 | 10.48 | 0.08 | 1.5569 | -0.0293 | |||
| DUK / Duke Energy Corporation | 0.11 | 10.55 | 10.33 | 10.17 | 1.5349 | 0.1144 | |||
| WTW / Willis Towers Watson Public Limited Company | 0.04 | 21.35 | 10.21 | 38.36 | 1.5177 | 0.3992 | |||
| O / Realty Income Corporation | 0.19 | 0.00 | 10.06 | -5.78 | 1.4943 | -0.1229 | |||
| EMR / Emerson Electric Co. | 0.09 | -21.41 | 10.03 | -8.42 | 1.4906 | -0.1690 | |||
| UHS / Universal Health Services, Inc. | 0.05 | -27.03 | 10.00 | -12.65 | 1.4854 | -0.2486 | |||
| TFC / Truist Financial Corporation | 0.25 | 15.60 | 9.86 | 22.06 | 1.4656 | 0.2412 | |||
| RGA / Reinsurance Group of America, Incorporated | 0.05 | -17.47 | 9.45 | -1.61 | 1.4045 | -0.0510 | |||
| DLTR / Dollar Tree, Inc. | 0.07 | -13.72 | 9.45 | -19.12 | 1.4042 | -0.3661 | |||
| Fixed Income Clearing Corp 5.30 04/01/2024 / RA (RPEN0ASS8) | 8.49 | 1.2610 | 1.2610 | ||||||
| TROW / T. Rowe Price Group, Inc. | 0.07 | -18.16 | 8.33 | -7.34 | 1.2373 | -0.1244 | |||
| FFIV / F5, Inc. | 0.04 | -6.06 | 8.32 | -0.49 | 1.2359 | -0.0305 | |||
| IPG / The Interpublic Group of Companies, Inc. | 0.25 | 7.29 | 8.20 | 7.26 | 1.2181 | 0.0601 | |||
| OXY / Occidental Petroleum Corporation | 0.13 | 9.50 | 8.13 | 19.19 | 1.2082 | 0.1746 | |||
| GIS / General Mills, Inc. | 0.11 | 9.65 | 8.03 | 17.79 | 1.1926 | 0.1601 | |||
| LUV / Southwest Airlines Co. | 0.27 | -17.29 | 7.90 | -16.39 | 1.1732 | -0.2577 | |||
| DOX / Amdocs Limited | 0.09 | -8.87 | 7.89 | -6.30 | 1.1718 | -0.1034 | |||
| SR / Spire Inc. | 0.13 | -24.70 | 7.83 | -25.86 | 1.1640 | -0.4370 | |||
| VCISY / Vinci SA - Depositary Receipt (Common Stock) | 0.06 | 1.20 | 7.81 | 3.20 | 1.1608 | 0.0138 | |||
| DOC / Healthpeak Properties, Inc. | 0.41 | 0.00 | 7.66 | -5.31 | 1.1376 | -0.0873 | |||
| PKG / Packaging Corporation of America | 0.04 | -9.05 | 7.62 | 5.95 | 1.1324 | 0.0427 | |||
| CAH / Cardinal Health, Inc. | 0.07 | 5.50 | 7.40 | 17.11 | 1.0996 | 0.1422 | |||
| EVRG / Evergy, Inc. | 0.14 | 2.12 | 7.34 | 4.44 | 1.0908 | 0.0258 | |||
| AKZOY / Akzo Nobel N.V. - Depositary Receipt (Common Stock) | 0.10 | -0.76 | 7.34 | -10.47 | 1.0907 | -0.1513 | |||
| BECN / Beacon Roofing Supply, Inc. | 0.07 | -4.12 | 7.32 | 7.99 | 1.0883 | 0.0608 | |||
| KVUE / Kenvue Inc. | 0.34 | 129.95 | 7.29 | 129.25 | 1.0829 | 0.6011 | |||
| BKR / Baker Hughes Company | 0.21 | 56.41 | 7.19 | 53.30 | 1.0688 | 0.3579 | |||
| PSA / Public Storage | 0.02 | -5.55 | 7.09 | -10.18 | 1.0532 | -0.1423 | |||
| HPQ / HP Inc. | 0.23 | 8.94 | 7.08 | 9.41 | 1.0519 | 0.0716 | |||
| ES / Eversource Energy | 0.12 | 12.59 | 6.97 | 9.05 | 1.0353 | 0.0671 | |||
| REG / Regency Centers Corporation | 0.11 | -8.07 | 6.90 | -16.92 | 1.0253 | -0.2329 | |||
| LH / Labcorp Holdings Inc. | 0.03 | -19.26 | 6.72 | -22.41 | 0.9983 | -0.3134 | |||
| PNW / Pinnacle West Capital Corporation | 0.09 | 19.60 | 6.47 | 24.39 | 0.9615 | 0.1735 | |||
| BUZ1 / Bunzl plc | 0.17 | -16.03 | 6.46 | -20.48 | 0.9603 | -0.2712 | |||
| TEL / TE Connectivity plc | 0.04 | -17.08 | 6.35 | -14.29 | 0.9432 | -0.1788 | |||
| OSK / Oshkosh Corporation | 0.05 | -21.02 | 6.24 | -9.16 | 0.9272 | -0.1134 | |||
| WEC / WEC Energy Group, Inc. | 0.08 | 14.84 | 6.22 | 12.04 | 0.9235 | 0.0831 | |||
| HOLX / Hologic, Inc. | 0.08 | 7.36 | 6.05 | 17.15 | 0.8982 | 0.1163 | |||
| CMS / CMS Energy Corporation | 0.10 | 0.00 | 6.02 | 3.90 | 0.8940 | 0.0167 | |||
| CBSH / Commerce Bancshares, Inc. | 0.11 | 51.79 | 5.90 | 51.22 | 0.8761 | 0.2853 | |||
| BWA / BorgWarner Inc. | 0.16 | -14.23 | 5.72 | -16.89 | 0.8498 | -0.1927 | |||
| EQT / EQT Corporation | 0.15 | 23.96 | 5.44 | 18.86 | 0.8090 | 0.1150 | |||
| THG / The Hanover Insurance Group, Inc. | 0.04 | 0.06 | 5.41 | 12.23 | 0.8031 | 0.0734 | |||
| SON / Sonoco Products Company | 0.09 | 17.06 | 5.32 | 21.18 | 0.7900 | 0.1253 | |||
| HENOY / Henkel AG & Co. KGaA - Depositary Receipt (Common Stock) | 0.07 | 0.00 | 5.30 | -0.08 | 0.7880 | -0.0161 | |||
| TER / Teradyne, Inc. | 0.05 | 61.63 | 5.29 | 68.04 | 0.7853 | 0.3088 | |||
| JCI / Johnson Controls International plc | 0.08 | 1.33 | 5.25 | 14.84 | 0.7798 | 0.0874 | |||
| MSM / MSC Industrial Direct Co., Inc. | 0.05 | -4.03 | 5.16 | -8.04 | 0.7662 | -0.0833 | |||
| HEINY / Heineken N.V. - Depositary Receipt (Common Stock) | 0.05 | 101.67 | 5.14 | 91.40 | 0.7642 | 0.3570 | |||
| APTV / Aptiv PLC | 0.06 | 12.39 | 5.08 | -0.24 | 0.7549 | -0.0166 | |||
| GOB / Compagnie de Saint-Gobain S.A. | 0.07 | -20.01 | 5.06 | -15.81 | 0.7517 | -0.1588 | |||
| BDX / Becton, Dickinson and Company | 0.02 | 34.34 | 5.04 | 36.36 | 0.7484 | 0.1887 | |||
| AMCR / Amcor plc | 0.53 | -41.56 | 5.03 | -42.35 | 0.7479 | -0.5748 | |||
| EQR / Equity Residential | 0.08 | 4.88 | 0.7254 | 0.7254 | |||||
| BCE / BCE Inc. | 0.14 | 3.38 | 4.88 | -10.79 | 0.7252 | -0.1035 | |||
| JNPR / Juniper Networks, Inc. | 0.13 | -27.46 | 4.86 | -8.82 | 0.7218 | -0.0853 | |||
| CNC / Centene Corporation | 0.06 | 2.74 | 4.76 | 8.63 | 0.7071 | 0.0435 | |||
| HII / Huntington Ingalls Industries, Inc. | 0.02 | -55.99 | 4.51 | -50.60 | 0.6701 | -0.7127 | |||
| MHK / Mohawk Industries, Inc. | 0.03 | 4.38 | 0.6504 | 0.6504 | |||||
| AFL / Aflac Incorporated | 0.05 | 8.76 | 4.22 | 13.19 | 0.6272 | 0.0622 | |||
| OGS / ONE Gas, Inc. | 0.07 | 23.22 | 4.21 | 24.79 | 0.6254 | 0.1144 | |||
| GEHC / GE HealthCare Technologies Inc. | 0.05 | 4.12 | 0.6123 | 0.6123 | |||||
| NVST / Envista Holdings Corporation | 0.19 | 2.46 | 4.12 | -8.97 | 0.6121 | -0.0734 | |||
| FOX / Fox Corporation | 0.14 | -44.61 | 4.10 | -42.68 | 0.6096 | -0.4746 | |||
| VICI / VICI Properties Inc. | 0.14 | 0.00 | 4.04 | -6.58 | 0.5996 | -0.0547 | |||
| XRAY / DENTSPLY SIRONA Inc. | 0.12 | 0.00 | 4.00 | -6.76 | 0.5949 | -0.0555 | |||
| RSG / Republic Services, Inc. | 0.02 | -2.24 | 3.90 | 13.49 | 0.5801 | 0.0589 | |||
| DRI / Darden Restaurants, Inc. | 0.02 | 3.67 | 0.5454 | 0.5454 | |||||
| AMP / Ameriprise Financial, Inc. | 0.01 | 3.62 | 0.5374 | 0.5374 | |||||
| PNC / The PNC Financial Services Group, Inc. | 0.02 | 3.60 | 0.5350 | 0.5350 | |||||
| COG / Cabot Oil & Gas Corp. | 0.12 | 3.47 | 0.5152 | 0.5152 | |||||
| PRNDY / Pernod Ricard SA - Depositary Receipt (Common Stock) | 0.02 | 3.44 | 0.5105 | 0.5105 | |||||
| WABC / Westamerica Bancorporation | 0.07 | 23.14 | 3.41 | 6.70 | 0.5066 | 0.0225 | |||
| FHB / First Hawaiian, Inc. | 0.16 | -3.97 | 3.41 | -7.75 | 0.5061 | -0.0533 | |||
| CMI / Cummins Inc. | 0.01 | -32.20 | 3.39 | -16.62 | 0.5033 | -0.1121 | |||
| TKR / The Timken Company | 0.04 | 3.35 | 0.4973 | 0.4973 | |||||
| ESS / Essex Property Trust, Inc. | 0.01 | -61.37 | 3.14 | -61.86 | 0.4671 | -0.7815 | |||
| CTSH / Cognizant Technology Solutions Corporation | 0.04 | 3.10 | 0.4606 | 0.4606 | |||||
| USB / U.S. Bancorp | 0.07 | 0.00 | 2.99 | 3.29 | 0.4437 | 0.0057 | |||
| GD / General Dynamics Corporation | 0.01 | -26.98 | 2.67 | -20.58 | 0.3963 | -0.1124 | |||
| COR / Cencora, Inc. | 0.01 | 65.07 | 2.61 | 95.36 | 0.3875 | 0.1852 | |||
| MGDDY / Compagnie Générale des Établissements Michelin Société en commandite par actions - Depositary Receipt (Common Stock) | 0.06 | -45.88 | 2.39 | -42.27 | 0.3551 | -0.2721 | |||
| SDXAY / Sodexo S.A. - Depositary Receipt (Common Stock) | 0.03 | 54.38 | 2.34 | 20.21 | 0.3474 | 0.0545 | |||
| HTLD / Heartland Express, Inc. | 0.19 | -29.56 | 2.29 | -41.03 | 0.3409 | -0.2485 | |||
| AB / AllianceBernstein Holding L.P. - Limited Partnership | 0.06 | 1.96 | 0.2909 | 0.2909 | |||||
| EA / Electronic Arts Inc. | 0.01 | -24.98 | 1.93 | -27.27 | 0.2863 | -0.1149 | |||
| ATKR / Atkore Inc. | 0.01 | 1.92 | 0.2848 | 0.2848 | |||||
| TD.PFA / The Toronto-Dominion Bank - Preferred Security | 1.88 | 0.2793 | 0.2793 | ||||||
| OMC / Omnicom Group Inc. | 0.02 | -69.66 | 1.50 | -66.06 | 0.2233 | -0.4477 | |||
| DOV / Dover Corporation | 0.01 | 1.33 | 0.1969 | 0.1969 | |||||
| JETD / MAX Airlines -3X Inverse Leveraged ETNs due May 28, 2043 - Structured Product | 0.47 | 0.0691 | 0.0691 | ||||||
| SOLD EUR/BOUGHT USD / DFE (N/A) | 0.07 | 0.0098 | 0.0098 | ||||||
| BA.C / Bank of America Corporation - Depositary Receipt (Common Stock) | 0.06 | 0.0092 | 0.0092 | ||||||
| XS1450864779 / China Government Bond - JPMorgan Chase | 0.06 | 0.0087 | 0.0087 | ||||||
| GVMXX / State Street Institutional Investment Trust - State Street Institutional US Govt Money Market Fnd Premier Cls | 0.03 | -91.79 | 0.03 | -91.80 | 0.0045 | -0.0510 | |||
| SOLD GBP/BOUGHT USD / DFE (N/A) | 0.01 | 0.0017 | 0.0017 | ||||||
| BA.C / Bank of America Corporation - Depositary Receipt (Common Stock) | 0.00 | 0.0005 | 0.0005 | ||||||
| FANG / Diamondback Energy, Inc. | 0.00 | -100.00 | 0.00 | -100.00 | -0.6900 | ||||
| SOLD CAD/BOUGHT USD / DFE (N/A) | -0.01 | -0.0018 | -0.0018 |