Mga Batayang Estadistika
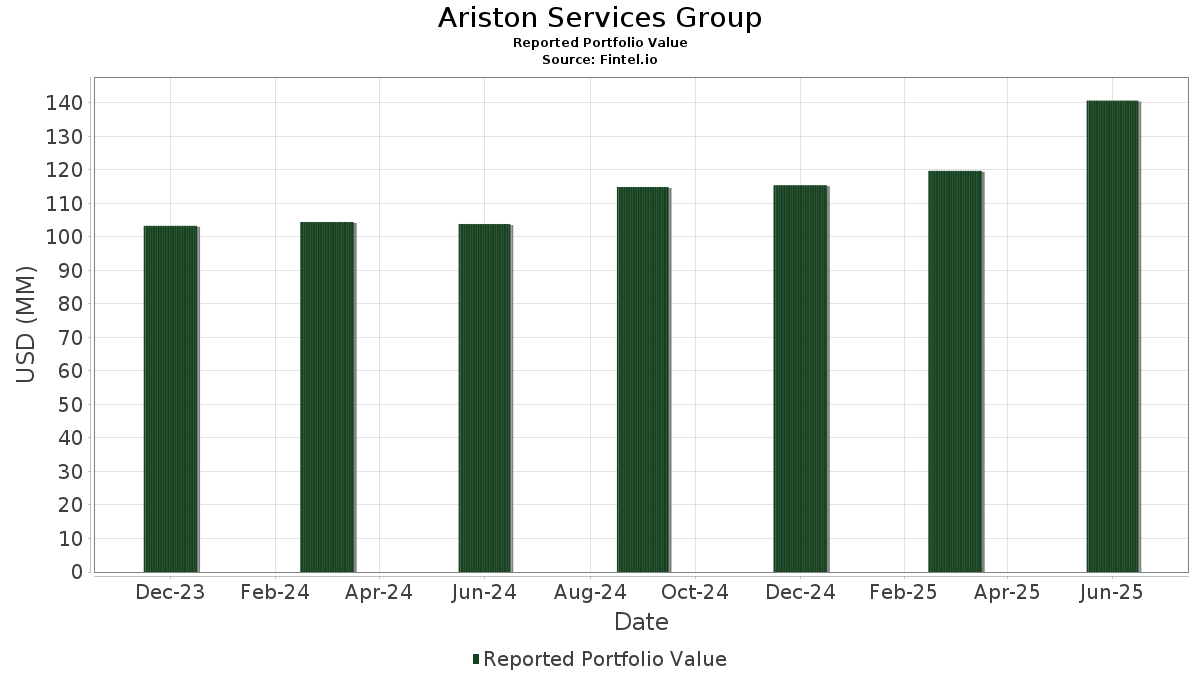
| Nilai Portofolio | $ 140,638,518 |
| Posisi Saat Ini | 71 |
Kepemilikan Terbaru, Kinerja, AUM (dari 13F, 13D)
Ariston Services Group telah mengungkapkan total kepemilikan 71 dalam pengajuan SEC terbaru mereka. Nilai portofolio terbaru dihitung sebesar $ 140,638,518 USD. Aset yang Dikelola (AUM) sebenarnya adalah nilai ini ditambah kas (yang tidak diungkapkan). Aset-aset utama Ariston Services Group adalah Vanguard Specialized Funds - Vanguard Dividend Appreciation ETF (US:VIG) , Vanguard Whitehall Funds - Vanguard High Dividend Yield ETF (US:VYM) , Tesla, Inc. (US:TSLA) , Vanguard International Equity Index Funds - Vanguard FTSE Emerging Markets ETF (US:VWO) , and iShares Gold Trust (US:IAU) . Posisi baru Ariston Services Group meliputi: Blackstone Inc. (US:BX) , .
Peningkatan Tertinggi Kuartal Ini
Kami menggunakan perubahan dalam alokasi portofolio karena ini adalah metrik yang paling bermakna. Perubahan dapat disebabkan oleh perdagangan atau perubahan harga saham.
| Keamanan | Saham (MM) |
Nilai (Juta Dolar AS) |
Portfolio % | ΔPorsyento ng Portfolio |
|---|---|---|---|---|
| 0.04 | 13.25 | 9.4244 | 9.1537 | |
| 0.01 | 1.29 | 0.9153 | 0.9153 | |
| 0.02 | 4.66 | 3.3101 | 0.8324 | |
| 0.10 | 1.83 | 1.2979 | 0.6081 | |
| 0.00 | 0.26 | 0.1818 | 0.1818 | |
| 0.00 | 0.22 | 0.1559 | 0.1559 | |
| 0.00 | 0.21 | 0.1474 | 0.1474 | |
| 0.01 | 0.95 | 0.6749 | 0.1308 | |
| 0.00 | 1.06 | 0.7513 | 0.1131 | |
| 0.00 | 0.53 | 0.3737 | 0.1122 |
Penurunan Tertinggi Kuartal Ini
Kami menggunakan perubahan dalam alokasi portofolio karena ini adalah metrik yang paling bermakna. Perubahan dapat disebabkan oleh perdagangan atau perubahan harga saham.
| Keamanan | Saham (MM) |
Nilai (Juta Dolar AS) |
Portfolio % | ΔPorsyento ng Portfolio |
|---|---|---|---|---|
| 0.13 | 7.88 | 5.6037 | -2.3046 | |
| 0.15 | 19.85 | 14.1143 | -1.9059 | |
| 0.11 | 23.00 | 16.3506 | -1.8610 | |
| 0.02 | 4.66 | 3.3123 | -1.0830 | |
| 0.08 | 6.82 | 4.8463 | -0.9415 | |
| 0.19 | 9.25 | 6.5783 | -0.4957 | |
| 0.08 | 7.34 | 5.2175 | -0.4253 | |
| 0.09 | 6.95 | 4.9435 | -0.3767 | |
| 0.02 | 2.93 | 2.0840 | -0.2872 | |
| 0.00 | 0.00 | -0.2422 |
Pengajuan 13F dan Dana
Formulir ini diajukan pada 2025-07-29 untuk periode pelaporan 2025-06-30. Klik ikon tautan untuk melihat riwayat transaksi selengkapnya.
Tingkatkan ke versi premium untuk membuka data premium dan ekspor ke Excel. ![]() .
.
| Keamanan | Ketik | Harga Saham Rata-rata | Saham (MM) |
ΔSaham (%) |
ΔSaham (%) |
Nilai ($MM) |
Portpolyo (%) |
ΔPortofolio (%) |
|
|---|---|---|---|---|---|---|---|---|---|
| VIG / Vanguard Specialized Funds - Vanguard Dividend Appreciation ETF | 0.11 | 0.00 | 23.00 | 5.51 | 16.3506 | -1.8610 | |||
| VYM / Vanguard Whitehall Funds - Vanguard High Dividend Yield ETF | 0.15 | 0.16 | 19.85 | 3.54 | 14.1143 | -1.9059 | |||
| TSLA / Tesla, Inc. | 0.04 | 3,238.00 | 13.25 | 4,003.41 | 9.4244 | 9.1537 | |||
| VWO / Vanguard International Equity Index Funds - Vanguard FTSE Emerging Markets ETF | 0.19 | 0.00 | 9.25 | 9.29 | 6.5783 | -0.4957 | |||
| IAU / iShares Gold Trust | 0.13 | -21.27 | 7.88 | -16.74 | 5.6037 | -2.3046 | |||
| VIGI / Vanguard Whitehall Funds - Vanguard International Dividend Appreciation ETF | 0.08 | 0.00 | 7.34 | 8.65 | 5.2175 | -0.4253 | |||
| VYMI / Vanguard Whitehall Funds - Vanguard International High Dividend Yield ETF | 0.09 | 0.44 | 6.95 | 9.19 | 4.9435 | -0.3767 | |||
| VNQ / Vanguard Specialized Funds - Vanguard Real Estate ETF | 0.08 | 0.03 | 6.82 | -1.60 | 4.8463 | -0.9415 | |||
| VOO / Vanguard Index Funds - Vanguard S&P 500 ETF | 0.01 | 0.16 | 5.46 | 10.69 | 3.8799 | -0.2387 | |||
| GLD / SPDR Gold Trust | 0.02 | -16.29 | 4.66 | -11.44 | 3.3123 | -1.0830 | |||
| VB / Vanguard Index Funds - Vanguard Small-Cap ETF | 0.02 | 46.90 | 4.66 | 57.00 | 3.3101 | 0.8324 | |||
| IWO / iShares Trust - iShares Russell 2000 Growth ETF | 0.01 | 0.00 | 3.38 | 11.90 | 2.4005 | -0.1211 | |||
| VPU / Vanguard World Fund - Vanguard Utilities ETF | 0.02 | -0.05 | 2.93 | 3.28 | 2.0840 | -0.2872 | |||
| ET / Energy Transfer LP - Limited Partnership | 0.10 | 126.72 | 1.83 | 121.21 | 1.2979 | 0.6081 | |||
| BX / Blackstone Inc. | 0.01 | 1.29 | 0.9153 | 0.9153 | |||||
| NFLX / Netflix, Inc. | 0.00 | -3.66 | 1.06 | 38.40 | 0.7513 | 0.1131 | |||
| NVDA / NVIDIA Corporation | 0.01 | 0.00 | 0.95 | 45.78 | 0.6749 | 0.1308 | |||
| GOOGL / Alphabet Inc. | 0.00 | 0.00 | 0.87 | 13.97 | 0.6208 | -0.0194 | |||
| JPM / JPMorgan Chase & Co. | 0.00 | 0.00 | 0.81 | 18.21 | 0.5727 | 0.0033 | |||
| GOOG / Alphabet Inc. | 0.00 | 0.00 | 0.72 | 13.52 | 0.5140 | -0.0180 | |||
| CMF / iShares Trust - iShares California Muni Bond ETF | 0.01 | 0.00 | 0.72 | -0.97 | 0.5100 | -0.0951 | |||
| XOM / Exxon Mobil Corporation | 0.01 | 25.24 | 0.70 | 13.56 | 0.4944 | -0.0174 | |||
| VTV / Vanguard Index Funds - Vanguard Value ETF | 0.00 | 5.06 | 0.63 | 7.46 | 0.4512 | -0.0421 | |||
| QCOM / QUALCOMM Incorporated | 0.00 | -0.28 | 0.57 | 3.28 | 0.4031 | -0.0551 | |||
| SSP / The E.W. Scripps Company | 0.19 | 0.00 | 0.55 | -0.54 | 0.3926 | -0.0719 | |||
| SRE / Sempra | 0.01 | 0.00 | 0.54 | 6.25 | 0.3869 | -0.0413 | |||
| VTEC / Vanguard California Tax-Free Funds - Vanguard California Tax-Exempt Bond ETF | 0.01 | 0.42 | 0.53 | -0.38 | 0.3779 | -0.0679 | |||
| VTEB / Vanguard Municipal Bond Funds - Vanguard Tax-Exempt Bond ETF | 0.01 | 0.52 | 0.53 | -0.75 | 0.3767 | -0.0690 | |||
| BA / The Boeing Company | 0.00 | 36.68 | 0.53 | 68.27 | 0.3737 | 0.1122 | |||
| VTI / Vanguard Index Funds - Vanguard Total Stock Market ETF | 0.00 | 7.65 | 0.46 | 19.07 | 0.3285 | 0.0042 | |||
| APD / Air Products and Chemicals, Inc. | 0.00 | 0.00 | 0.45 | -4.51 | 0.3171 | -0.0725 | |||
| MCHP / Microchip Technology Incorporated | 0.01 | 4.22 | 0.43 | 51.75 | 0.3088 | 0.0693 | |||
| MCK / McKesson Corporation | 0.00 | 0.00 | 0.42 | 9.11 | 0.2980 | -0.0236 | |||
| ORLY / O'Reilly Automotive, Inc. | 0.00 | 1,400.00 | 0.38 | -5.67 | 0.2730 | -0.0669 | |||
| WMB / The Williams Companies, Inc. | 0.01 | -23.85 | 0.38 | -20.13 | 0.2714 | -0.1271 | |||
| V / Visa Inc. | 0.00 | 0.00 | 0.37 | 1.10 | 0.2631 | -0.0421 | |||
| SCHW / The Charles Schwab Corporation | 0.00 | 0.00 | 0.36 | 16.83 | 0.2568 | -0.0021 | |||
| DE / Deere & Company | 0.00 | 33.65 | 0.35 | 44.67 | 0.2513 | 0.0474 | |||
| PH / Parker-Hannifin Corporation | 0.00 | 0.00 | 0.35 | 15.03 | 0.2503 | -0.0057 | |||
| BRK.B / Berkshire Hathaway Inc. | 0.00 | 17.11 | 0.34 | 6.88 | 0.2435 | -0.0244 | |||
| BAC / Bank of America Corporation | 0.01 | 0.00 | 0.34 | 13.38 | 0.2411 | -0.0088 | |||
| AVGO / Broadcom Inc. | 0.00 | 0.00 | 0.33 | 64.53 | 0.2379 | 0.0681 | |||
| TRV / The Travelers Companies, Inc. | 0.00 | 0.00 | 0.32 | 1.25 | 0.2306 | -0.0373 | |||
| INTC / Intel Corporation | 0.01 | 0.00 | 0.32 | -1.25 | 0.2250 | -0.0431 | |||
| CVS / CVS Health Corporation | 0.00 | 13.14 | 0.31 | 15.07 | 0.2230 | -0.0045 | |||
| UNH / UnitedHealth Group Incorporated | 0.00 | 13.59 | 0.30 | -32.35 | 0.2114 | -0.1558 | |||
| COP / ConocoPhillips | 0.00 | -0.09 | 0.28 | -14.46 | 0.2020 | -0.0761 | |||
| MLM / Martin Marietta Materials, Inc. | 0.00 | 0.00 | 0.28 | 15.04 | 0.2014 | -0.0047 | |||
| XPO / XPO, Inc. | 0.00 | 0.00 | 0.28 | 17.37 | 0.1975 | -0.0002 | |||
| SHW / The Sherwin-Williams Company | 0.00 | 9.14 | 0.27 | 7.45 | 0.1953 | -0.0186 | |||
| BDX / Becton, Dickinson and Company | 0.00 | 0.00 | 0.27 | -25.00 | 0.1927 | -0.1084 | |||
| AXP / American Express Company | 0.00 | -22.75 | 0.27 | -8.47 | 0.1926 | -0.0545 | |||
| MSI / Motorola Solutions, Inc. | 0.00 | 0.00 | 0.26 | -4.00 | 0.1880 | -0.0421 | |||
| HYMB / SPDR Series Trust - SPDR Nuveen ICE High Yield Municipal Bond ETF | 0.01 | 0.71 | 0.26 | -0.76 | 0.1856 | -0.0348 | |||
| CVX / Chevron Corporation | 0.00 | 0.00 | 0.26 | -14.52 | 0.1846 | -0.0688 | |||
| MSFT / Microsoft Corporation | 0.00 | 0.26 | 0.1818 | 0.1818 | |||||
| MMC / Marsh & McLennan Companies, Inc. | 0.00 | 8.25 | 0.26 | -3.04 | 0.1816 | -0.0384 | |||
| JNJ / Johnson & Johnson | 0.00 | 0.00 | 0.25 | -8.00 | 0.1803 | -0.0497 | |||
| WEC / WEC Energy Group, Inc. | 0.00 | 8.01 | 0.25 | 3.31 | 0.1779 | -0.0245 | |||
| NOC / Northrop Grumman Corporation | 0.00 | -25.75 | 0.25 | -27.78 | 0.1763 | -0.1095 | |||
| HD / The Home Depot, Inc. | 0.00 | 8.33 | 0.25 | 8.33 | 0.1762 | -0.0149 | |||
| PFE / Pfizer Inc. | 0.01 | 0.00 | 0.24 | -4.33 | 0.1730 | -0.0395 | |||
| RTX / RTX Corporation | 0.00 | -12.89 | 0.24 | -3.97 | 0.1727 | -0.0386 | |||
| PGR / The Progressive Corporation | 0.00 | 0.00 | 0.24 | -5.88 | 0.1713 | -0.0422 | |||
| COF / Capital One Financial Corporation | 0.00 | -24.65 | 0.23 | -10.67 | 0.1610 | -0.0506 | |||
| META / Meta Platforms, Inc. | 0.00 | 0.22 | 0.1559 | 0.1559 | |||||
| HLN / Haleon plc - Depositary Receipt (Common Stock) | 0.02 | 0.00 | 0.21 | 0.47 | 0.1528 | -0.0254 | |||
| TMO / Thermo Fisher Scientific Inc. | 0.00 | 0.00 | 0.21 | -18.39 | 0.1516 | -0.0671 | |||
| CMCSA / Comcast Corporation | 0.01 | 0.00 | 0.21 | -3.18 | 0.1515 | -0.0326 | |||
| USB / U.S. Bancorp | 0.00 | 0.21 | 0.1474 | 0.1474 | |||||
| F / Ford Motor Company | 0.02 | 0.00 | 0.20 | 7.73 | 0.1393 | -0.0120 | |||
| PEP / PepsiCo, Inc. | 0.00 | -100.00 | 0.00 | -100.00 | -0.2422 | ||||
| EIX / Edison International | 0.00 | -100.00 | 0.00 | 0.0000 |