Mga Batayang Estadistika
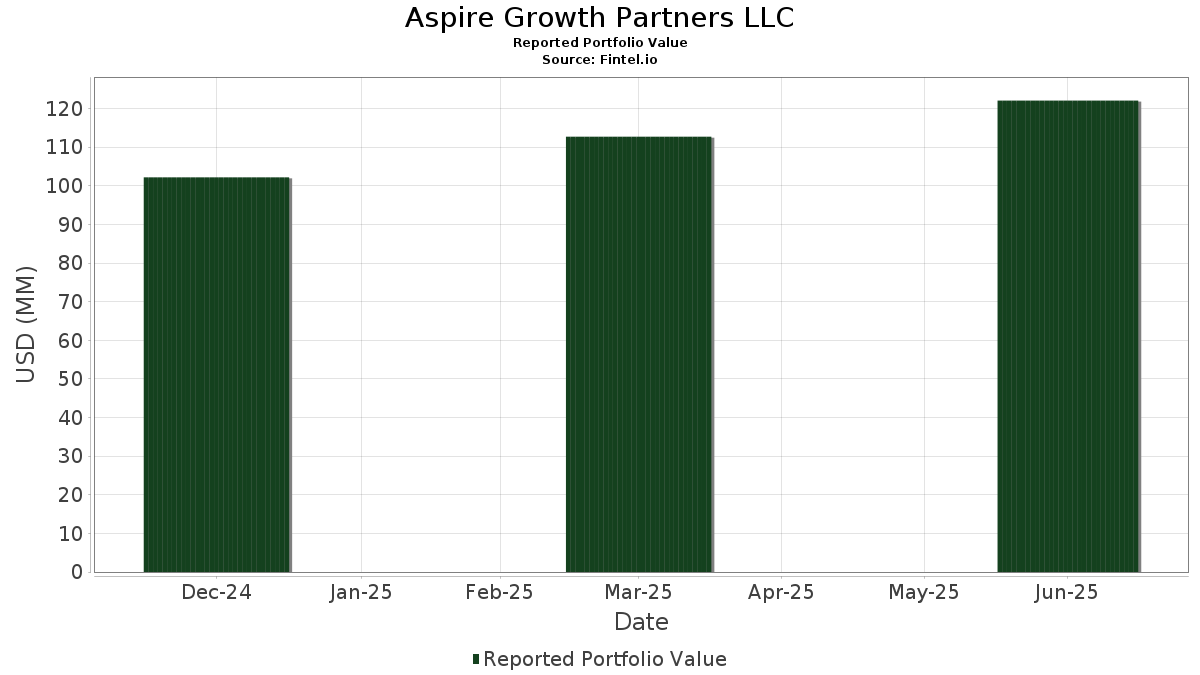
| Nilai Portofolio | $ 122,061,893 |
| Posisi Saat Ini | 114 |
Kepemilikan Terbaru, Kinerja, AUM (dari 13F, 13D)
Aspire Growth Partners LLC telah mengungkapkan total kepemilikan 114 dalam pengajuan SEC terbaru mereka. Nilai portofolio terbaru dihitung sebesar $ 122,061,893 USD. Aset yang Dikelola (AUM) sebenarnya adalah nilai ini ditambah kas (yang tidak diungkapkan). Aset-aset utama Aspire Growth Partners LLC adalah Vanguard Index Funds - Vanguard S&P 500 ETF (US:VOO) , Apple Inc. (US:AAPL) , Vanguard Admiral Funds - Vanguard S&P 500 Value ETF (US:VOOV) , Microsoft Corporation (US:MSFT) , and Invesco Exchange-Traded Fund Trust II - Invesco NASDAQ 100 ETF (US:QQQM) . Posisi baru Aspire Growth Partners LLC meliputi: GE Vernova Inc. (US:GEV) , iShares Bitcoin Trust ETF (US:IBIT) , Capital Group Fixed Income ETF Trust - Capital Group Core Plus Income ETF (US:CGCP) , Gilead Sciences, Inc. (US:GILD) , and .
Peningkatan Tertinggi Kuartal Ini
Kami menggunakan perubahan dalam alokasi portofolio karena ini adalah metrik yang paling bermakna. Perubahan dapat disebabkan oleh perdagangan atau perubahan harga saham.
| Keamanan | Saham (MM) |
Nilai (Juta Dolar AS) |
Portfolio % | ΔPorsyento ng Portfolio |
|---|---|---|---|---|
| 0.13 | 4.71 | 3.8603 | 0.6033 | |
| 0.02 | 12.91 | 10.5791 | 0.5542 | |
| 0.00 | 0.62 | 0.5120 | 0.5120 | |
| 0.02 | 5.04 | 4.1314 | 0.4938 | |
| 0.10 | 3.77 | 3.0883 | 0.3842 | |
| 0.04 | 8.54 | 6.9938 | 0.3517 | |
| 0.01 | 0.37 | 0.3009 | 0.3009 | |
| 0.02 | 0.35 | 0.2895 | 0.2895 | |
| 0.00 | 0.21 | 0.1734 | 0.1734 | |
| 0.01 | 2.86 | 2.3395 | 0.1459 |
Penurunan Tertinggi Kuartal Ini
Kami menggunakan perubahan dalam alokasi portofolio karena ini adalah metrik yang paling bermakna. Perubahan dapat disebabkan oleh perdagangan atau perubahan harga saham.
| Keamanan | Saham (MM) |
Nilai (Juta Dolar AS) |
Portfolio % | ΔPorsyento ng Portfolio |
|---|---|---|---|---|
| 0.01 | 0.81 | 0.6624 | -0.4755 | |
| 0.00 | 0.47 | 0.3810 | -0.3306 | |
| 0.00 | 0.24 | 0.1987 | -0.3283 | |
| 0.02 | 2.36 | 1.9341 | -0.2018 | |
| 0.00 | 0.68 | 0.5563 | -0.1955 | |
| 0.04 | 7.33 | 6.0060 | -0.1779 | |
| 0.00 | 1.14 | 0.9320 | -0.1539 | |
| 0.01 | 0.89 | 0.7277 | -0.1439 | |
| 0.00 | 0.65 | 0.5315 | -0.1340 | |
| 0.00 | 0.43 | 0.3558 | -0.1255 |
Pengajuan 13F dan Dana
Formulir ini diajukan pada 2025-08-13 untuk periode pelaporan 2025-06-30. Klik ikon tautan untuk melihat riwayat transaksi selengkapnya.
Tingkatkan ke versi premium untuk membuka data premium dan ekspor ke Excel. ![]() .
.
| Keamanan | Ketik | Harga Saham Rata-rata | Saham (MM) |
ΔSaham (%) |
ΔSaham (%) |
Nilai ($MM) |
Portpolyo (%) |
ΔPortofolio (%) |
|
|---|---|---|---|---|---|---|---|---|---|
| VOO / Vanguard Index Funds - Vanguard S&P 500 ETF | 0.02 | 3.79 | 12.91 | 14.28 | 10.5791 | 0.5542 | |||
| AAPL / Apple Inc. | 0.04 | 9.30 | 8.54 | 14.03 | 6.9938 | 0.3517 | |||
| VOOV / Vanguard Admiral Funds - Vanguard S&P 500 Value ETF | 0.04 | -0.49 | 7.33 | 5.18 | 6.0060 | -0.1779 | |||
| MSFT / Microsoft Corporation | 0.01 | -3.82 | 6.74 | 10.62 | 5.5200 | 0.1162 | |||
| QQQM / Invesco Exchange-Traded Fund Trust II - Invesco NASDAQ 100 ETF | 0.02 | 7.78 | 5.04 | 23.01 | 4.1314 | 0.4938 | |||
| CGUS / Capital Group Core Equity ETF | 0.13 | 15.88 | 4.71 | 28.33 | 3.8603 | 0.6033 | |||
| CGDV / Capital Group Dividend Value ETF | 0.10 | 10.90 | 3.77 | 23.70 | 3.0883 | 0.3842 | |||
| VTI / Vanguard Index Funds - Vanguard Total Stock Market ETF | 0.01 | -0.78 | 3.08 | 9.22 | 2.5238 | 0.0212 | |||
| JPM / JPMorgan Chase & Co. | 0.01 | -0.73 | 2.86 | 15.49 | 2.3395 | 0.1459 | |||
| CGXU / Capital Group International Focus Equity ETF | 0.09 | 0.21 | 2.50 | 7.70 | 2.0509 | -0.0111 | |||
| WMT / Walmart Inc. | 0.02 | -0.88 | 2.36 | -1.95 | 1.9341 | -0.2018 | |||
| IBM / International Business Machines Corporation | 0.01 | -9.87 | 2.09 | 5.73 | 1.7084 | -0.0414 | |||
| AMZN / Amazon.com, Inc. | 0.01 | -7.64 | 2.04 | 7.35 | 1.6750 | -0.0146 | |||
| USMV / iShares Trust - iShares MSCI USA Min Vol Factor ETF | 0.02 | 0.34 | 1.62 | 1.51 | 1.3243 | -0.0890 | |||
| XOM / Exxon Mobil Corporation | 0.01 | 9.80 | 1.61 | 13.19 | 1.3216 | 0.0567 | |||
| MPC / Marathon Petroleum Corporation | 0.01 | -0.84 | 1.55 | 13.85 | 1.2739 | 0.0621 | |||
| QQQ / Invesco QQQ Trust, Series 1 | 0.00 | 0.00 | 1.32 | 14.16 | 1.0835 | 0.0555 | |||
| V / Visa Inc. | 0.00 | -2.03 | 1.30 | -0.53 | 1.0671 | -0.0952 | |||
| GOOG / Alphabet Inc. | 0.01 | -2.50 | 1.24 | 15.08 | 1.0196 | 0.0601 | |||
| ETN / Eaton Corporation plc | 0.00 | -0.15 | 1.22 | 17.99 | 0.9998 | 0.0818 | |||
| TT / Trane Technologies plc | 0.00 | -0.87 | 1.20 | 6.41 | 0.9796 | -0.0168 | |||
| GOOGL / Alphabet Inc. | 0.01 | -7.25 | 1.16 | 8.01 | 0.9506 | -0.0029 | |||
| LMT / Lockheed Martin Corporation | 0.00 | 4.94 | 1.15 | 3.05 | 0.9430 | -0.0474 | |||
| BRK.B / Berkshire Hathaway Inc. | 0.00 | -0.85 | 1.14 | -7.11 | 0.9320 | -0.1539 | |||
| SHY / iShares Trust - iShares 1-3 Year Treasury Bond ETF | 0.01 | -4.08 | 1.09 | -3.80 | 0.8932 | -0.1122 | |||
| T / AT&T Inc. | 0.04 | -2.09 | 1.08 | 0.84 | 0.8871 | -0.0656 | |||
| CGGR / Capital Group Growth ETF | 0.03 | -8.15 | 1.08 | 4.86 | 0.8848 | -0.0286 | |||
| HD / The Home Depot, Inc. | 0.00 | -0.80 | 1.01 | 0.30 | 0.8244 | -0.0661 | |||
| MSI / Motorola Solutions, Inc. | 0.00 | -1.07 | 0.93 | 0.21 | 0.7646 | -0.0618 | |||
| IJJ / iShares Trust - iShares S&P Mid-Cap 400 Value ETF | 0.01 | 2.95 | 0.92 | 9.52 | 0.7538 | 0.0080 | |||
| CRM / Salesforce, Inc. | 0.00 | -4.41 | 0.90 | -6.32 | 0.7407 | -0.1155 | |||
| LLY / Eli Lilly and Company | 0.00 | -4.46 | 0.90 | -4.14 | 0.7395 | -0.0955 | |||
| FI / Fiserv, Inc. | 0.01 | -4.45 | 0.89 | -9.57 | 0.7277 | -0.1439 | |||
| IEMG / iShares, Inc. - iShares Core MSCI Emerging Markets ETF | 0.01 | 7.09 | 0.88 | 16.36 | 0.7229 | 0.0502 | |||
| EUSA / iShares, Inc. - iShares MSCI USA Equal Weighted ETF | 0.01 | -40.74 | 0.81 | -36.97 | 0.6624 | -0.4755 | |||
| CGDG / Capital Group Dividend Growers ETF | 0.02 | 0.00 | 0.80 | 5.96 | 0.6560 | -0.0145 | |||
| ADI / Analog Devices, Inc. | 0.00 | 0.03 | 0.76 | 19.06 | 0.6198 | 0.0562 | |||
| UPGD / Invesco Exchange-Traded Fund Trust - Invesco Bloomberg Analyst Rating Improvers ETF | 0.01 | 0.00 | 0.74 | 3.67 | 0.6028 | -0.0269 | |||
| HAL / Halliburton Company | 0.04 | -1.41 | 0.73 | 3.87 | 0.5942 | -0.0258 | |||
| APD / Air Products and Chemicals, Inc. | 0.00 | -0.56 | 0.70 | 6.03 | 0.5764 | -0.0125 | |||
| RSP / Invesco Exchange-Traded Fund Trust - Invesco S&P 500 Equal Weight ETF | 0.00 | 0.34 | 0.70 | 6.55 | 0.5730 | -0.0095 | |||
| VZ / Verizon Communications Inc. | 0.02 | -1.94 | 0.68 | -3.41 | 0.5569 | -0.0669 | |||
| CME / CME Group Inc. | 0.00 | -17.21 | 0.68 | -19.95 | 0.5563 | -0.1955 | |||
| SPY / SPDR S&P 500 ETF | 0.00 | 0.75 | 0.66 | 11.09 | 0.5416 | 0.0129 | |||
| F / Ford Motor Company | 0.06 | 3.99 | 0.66 | 9.83 | 0.5400 | 0.0072 | |||
| AVGO / Broadcom Inc. | 0.00 | -39.31 | 0.65 | -13.60 | 0.5315 | -0.1340 | |||
| GEV / GE Vernova Inc. | 0.00 | 0.62 | 0.5120 | 0.5120 | |||||
| DRI / Darden Restaurants, Inc. | 0.00 | -2.09 | 0.60 | 7.69 | 0.4937 | -0.0023 | |||
| MTUM / iShares Trust - iShares MSCI USA Momentum Factor ETF | 0.00 | 0.20 | 0.59 | 11.79 | 0.4819 | 0.0145 | |||
| STE / STERIS plc | 0.00 | -1.11 | 0.58 | 5.67 | 0.4739 | -0.0121 | |||
| MDT / Medtronic plc | 0.01 | -1.58 | 0.57 | 3.25 | 0.4682 | -0.0233 | |||
| GM / General Motors Company | 0.01 | -1.34 | 0.56 | 6.69 | 0.4576 | -0.0065 | |||
| PFE / Pfizer Inc. | 0.02 | 2.69 | 0.56 | 9.25 | 0.4554 | 0.0039 | |||
| VB / Vanguard Index Funds - Vanguard Small-Cap ETF | 0.00 | 4.98 | 0.56 | 13.27 | 0.4547 | 0.0193 | |||
| UNP / Union Pacific Corporation | 0.00 | -0.51 | 0.53 | 7.03 | 0.4372 | -0.0052 | |||
| MRK / Merck & Co., Inc. | 0.01 | -1.23 | 0.53 | -1.31 | 0.4325 | -0.0415 | |||
| WCC / WESCO International, Inc. | 0.00 | -0.04 | 0.52 | 16.48 | 0.4232 | 0.0298 | |||
| JNJ / Johnson & Johnson | 0.00 | -0.54 | 0.50 | -3.45 | 0.4127 | -0.0499 | |||
| ABBV / AbbVie Inc. | 0.00 | -1.21 | 0.50 | -2.34 | 0.4097 | -0.0453 | |||
| NUE / Nucor Corporation | 0.00 | -14.93 | 0.50 | -4.41 | 0.4092 | -0.0539 | |||
| CB / Chubb Limited | 0.00 | -0.64 | 0.50 | -1.00 | 0.4070 | -0.0377 | |||
| VIG / Vanguard Specialized Funds - Vanguard Dividend Appreciation ETF | 0.00 | 47.60 | 0.49 | 57.56 | 0.4015 | 0.1251 | |||
| SHW / The Sherwin-Williams Company | 0.00 | -4.64 | 0.48 | -6.99 | 0.3928 | -0.0643 | |||
| TJX / The TJX Companies, Inc. | 0.00 | 29.70 | 0.48 | 24.42 | 0.3927 | 0.0510 | |||
| ALL / The Allstate Corporation | 0.00 | -1.14 | 0.47 | -2.48 | 0.3865 | -0.0428 | |||
| CGIE / Capital Group International Equity ETF | 0.01 | 0.00 | 0.47 | 5.90 | 0.3832 | -0.0088 | |||
| VOOG / Vanguard Admiral Funds - Vanguard S&P 500 Growth ETF | 0.00 | -50.06 | 0.47 | -42.02 | 0.3810 | -0.3306 | |||
| META / Meta Platforms, Inc. | 0.00 | -7.40 | 0.45 | 14.43 | 0.3709 | 0.0204 | |||
| PG / The Procter & Gamble Company | 0.00 | 1.51 | 0.45 | 1.58 | 0.3690 | -0.0247 | |||
| UNH / UnitedHealth Group Incorporated | 0.00 | 0.36 | 0.43 | -19.93 | 0.3558 | -0.1255 | |||
| DXCM / DexCom, Inc. | 0.00 | -1.32 | 0.42 | 3.17 | 0.3473 | -0.0166 | |||
| CAT / Caterpillar Inc. | 0.00 | 0.37 | 0.42 | 21.93 | 0.3418 | 0.0376 | |||
| IVV / iShares Trust - iShares Core S&P 500 ETF | 0.00 | 0.31 | 0.40 | 10.25 | 0.3267 | 0.0065 | |||
| VO / Vanguard Index Funds - Vanguard Mid-Cap ETF | 0.00 | 0.00 | 0.39 | 7.38 | 0.3224 | -0.0025 | |||
| SCHX / Schwab Strategic Trust - Schwab U.S. Large-Cap ETF | 0.02 | 0.30 | 0.38 | 10.47 | 0.3117 | 0.0061 | |||
| AMD / Advanced Micro Devices, Inc. | 0.00 | -14.04 | 0.37 | 21.31 | 0.3039 | 0.0325 | |||
| NXPI / NXP Semiconductors N.V. | 0.00 | -1.28 | 0.37 | 15.26 | 0.3038 | 0.0187 | |||
| CVS / CVS Health Corporation | 0.01 | -6.30 | 0.37 | -3.17 | 0.3011 | -0.0358 | |||
| IBIT / iShares Bitcoin Trust ETF | 0.01 | 0.37 | 0.3009 | 0.3009 | |||||
| CMCSA / Comcast Corporation | 0.01 | -4.25 | 0.36 | -0.83 | 0.2948 | -0.0265 | |||
| CGCP / Capital Group Fixed Income ETF Trust - Capital Group Core Plus Income ETF | 0.02 | 0.35 | 0.2895 | 0.2895 | |||||
| TSLA / Tesla, Inc. | 0.00 | -3.51 | 0.34 | 11.48 | 0.2792 | 0.0084 | |||
| FANG / Diamondback Energy, Inc. | 0.00 | -4.37 | 0.34 | 1.19 | 0.2785 | -0.0189 | |||
| IJR / iShares Trust - iShares Core S&P Small-Cap ETF | 0.00 | 0.36 | 0.34 | 7.72 | 0.2747 | -0.0014 | |||
| GE / General Electric Company | 0.00 | -1.47 | 0.33 | 20.66 | 0.2686 | 0.0278 | |||
| REGN / Regeneron Pharmaceuticals, Inc. | 0.00 | 0.16 | 0.33 | -6.30 | 0.2683 | -0.0416 | |||
| RGS / Regis Corporation | 0.01 | 14.54 | 0.33 | 36.97 | 0.2676 | 0.0558 | |||
| DIS / The Walt Disney Company | 0.00 | -13.33 | 0.33 | 5.52 | 0.2668 | -0.0068 | |||
| COST / Costco Wholesale Corporation | 0.00 | -9.27 | 0.32 | -10.89 | 0.2616 | -0.0566 | |||
| IWF / iShares Trust - iShares Russell 1000 Growth ETF | 0.00 | 0.00 | 0.32 | 14.39 | 0.2607 | 0.0133 | |||
| BA / The Boeing Company | 0.00 | -2.08 | 0.32 | 10.49 | 0.2591 | 0.0053 | |||
| FIS / Fidelity National Information Services, Inc. | 0.00 | -4.80 | 0.31 | 2.66 | 0.2539 | -0.0140 | |||
| MCD / McDonald's Corporation | 0.00 | -9.71 | 0.30 | -16.85 | 0.2426 | -0.0735 | |||
| BBY / Best Buy Co., Inc. | 0.00 | -0.53 | 0.28 | -2.12 | 0.2271 | -0.0248 | |||
| MGV / Vanguard World Fund - Vanguard Mega Cap Value ETF | 0.00 | 0.00 | 0.27 | 5.58 | 0.2175 | -0.0057 | |||
| O / Realty Income Corporation | 0.00 | -16.78 | 0.26 | -15.48 | 0.2147 | -0.0605 | |||
| GGG / Graco Inc. | 0.00 | 0.00 | 0.26 | 4.82 | 0.2141 | -0.0070 | |||
| MU / Micron Technology, Inc. | 0.00 | -32.07 | 0.26 | -0.39 | 0.2122 | -0.0182 | |||
| CGGO / Capital Group Global Growth Equity ETF | 0.01 | 0.00 | 0.26 | 9.87 | 0.2098 | 0.0028 | |||
| RJF / Raymond James Financial, Inc. | 0.00 | 0.00 | 0.25 | 6.93 | 0.2027 | -0.0023 | |||
| EW / Edwards Lifesciences Corporation | 0.00 | -2.02 | 0.24 | 2.11 | 0.1991 | -0.0120 | |||
| LHX / L3Harris Technologies, Inc. | 0.00 | -64.54 | 0.24 | -59.26 | 0.1987 | -0.3283 | |||
| BP / BP p.l.c. - Depositary Receipt (Common Stock) | 0.01 | -1.24 | 0.24 | 5.38 | 0.1926 | -0.0059 | |||
| CTMX / CytomX Therapeutics, Inc. | 0.10 | 10.84 | 0.23 | 163.64 | 0.1902 | 0.1115 | |||
| DIVO / Amplify ETF Trust - Amplify CWP Enhanced Dividend Income ETF | 0.01 | 0.83 | 0.23 | 6.54 | 0.1870 | -0.0036 | |||
| SYK / Stryker Corporation | 0.00 | -14.77 | 0.23 | -11.97 | 0.1869 | -0.0437 | |||
| QCOM / QUALCOMM Incorporated | 0.00 | -1.99 | 0.22 | 7.88 | 0.1799 | -0.0002 | |||
| NEE / NextEra Energy, Inc. | 0.00 | 0.25 | 0.22 | 3.32 | 0.1792 | -0.0087 | |||
| CMG / Chipotle Mexican Grill, Inc. | 0.00 | -0.87 | 0.22 | 7.46 | 0.1777 | -0.0008 | |||
| SPGI / S&P Global Inc. | 0.00 | -20.19 | 0.22 | -16.92 | 0.1776 | -0.0537 | |||
| GILD / Gilead Sciences, Inc. | 0.00 | 0.21 | 0.1734 | 0.1734 | |||||
| HWM / Howmet Aerospace Inc. | 0.00 | -18.09 | 0.21 | -2.83 | 0.1691 | -0.0196 | |||
| CI / The Cigna Group | 0.00 | -17.35 | 0.21 | -18.25 | 0.1691 | -0.0550 | |||
| JPC / Nuveen Preferred & Income Opportunities Fund | 0.01 | 0.84 | 0.10 | 3.26 | 0.0780 | -0.0037 | |||
| PGR / The Progressive Corporation | 0.00 | -100.00 | 0.00 | 0.0000 | |||||
| AZO / AutoZone, Inc. | 0.00 | -100.00 | 0.00 | 0.0000 | |||||
| MA / Mastercard Incorporated | 0.00 | -100.00 | 0.00 | 0.0000 |