Mga Batayang Estadistika
| Nilai Portofolio | $ 217,495 |
| Posisi Saat Ini | 34 |
Kepemilikan Terbaru, Kinerja, AUM (dari 13F, 13D)
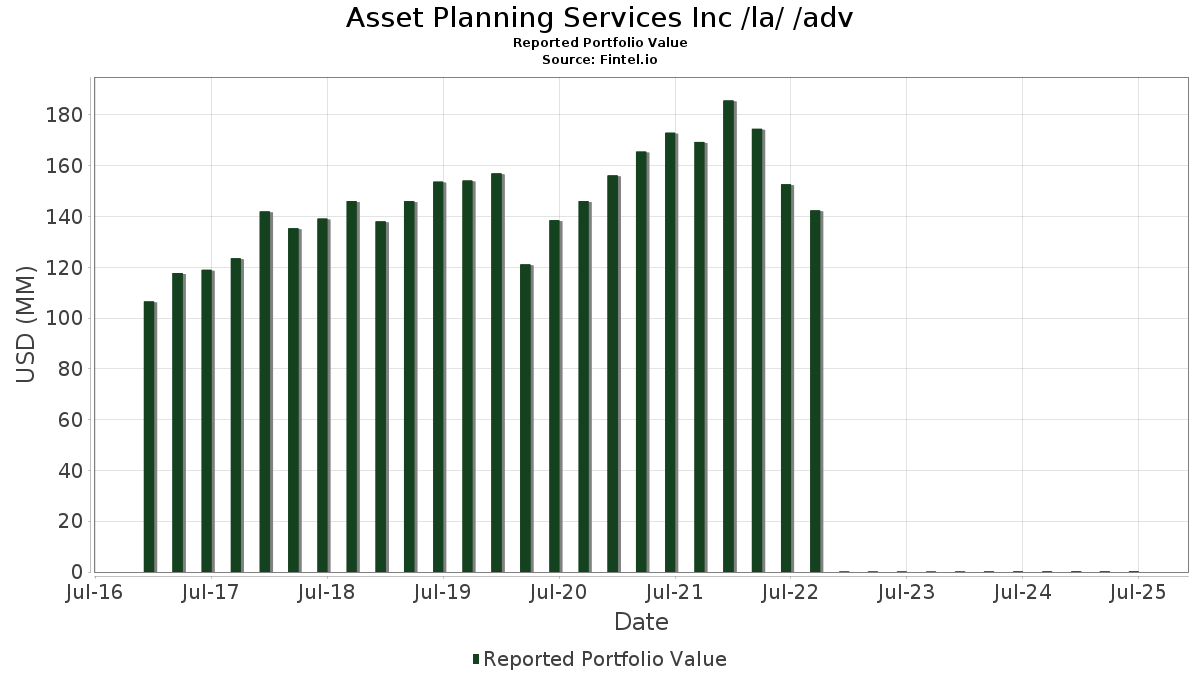
Asset Planning Services Inc /la/ /adv telah mengungkapkan total kepemilikan 34 dalam pengajuan SEC terbaru mereka. Nilai portofolio terbaru dihitung sebesar $ 217,495 USD. Aset yang Dikelola (AUM) sebenarnya adalah nilai ini ditambah kas (yang tidak diungkapkan). Aset-aset utama Asset Planning Services Inc /la/ /adv adalah NVIDIA Corporation (US:NVDA) , Microsoft Corporation (US:MSFT) , JPMorgan Chase & Co. (US:JPM) , Walmart Inc. (US:WMT) , and Amazon.com, Inc. (US:AMZN) .
Peningkatan Tertinggi Kuartal Ini
Kami menggunakan perubahan dalam alokasi portofolio karena ini adalah metrik yang paling bermakna. Perubahan dapat disebabkan oleh perdagangan atau perubahan harga saham.
| Keamanan | Saham (MM) |
Nilai (Juta Dolar AS) |
Portfolio % | ΔPorsyento ng Portfolio |
|---|---|---|---|---|
| 0.25 | 0.04 | 18.3825 | 4.3395 | |
| 0.05 | 0.02 | 11.1097 | 1.7824 | |
| 0.04 | 0.01 | 5.5859 | 0.3307 | |
| 0.02 | 0.01 | 2.6971 | 0.2167 | |
| 0.10 | 0.00 | 0.3030 | 0.1881 | |
| 0.03 | 0.01 | 3.1458 | 0.1352 | |
| 0.05 | 0.01 | 4.3900 | 0.1333 | |
| 0.04 | 0.01 | 4.3950 | 0.1058 | |
| 0.04 | 0.01 | 3.2217 | 0.0738 | |
| 0.18 | 0.00 | 2.0506 | 0.0705 |
Penurunan Tertinggi Kuartal Ini
Kami menggunakan perubahan dalam alokasi portofolio karena ini adalah metrik yang paling bermakna. Perubahan dapat disebabkan oleh perdagangan atau perubahan harga saham.
| Keamanan | Saham (MM) |
Nilai (Juta Dolar AS) |
Portfolio % | ΔPorsyento ng Portfolio |
|---|---|---|---|---|
| 0.04 | 0.01 | 2.8773 | -0.8298 | |
| 0.05 | 0.01 | 2.5407 | -0.5233 | |
| 0.04 | 0.01 | 2.6433 | -0.4995 | |
| 0.13 | 0.00 | 1.8364 | -0.4076 | |
| 0.01 | 0.01 | 2.8088 | -0.3732 | |
| 0.02 | 0.01 | 3.2028 | -0.3324 | |
| 0.02 | 0.01 | 2.6401 | -0.3040 | |
| 0.02 | 0.01 | 3.4401 | -0.2558 | |
| 0.11 | 0.00 | 1.2216 | -0.2095 | |
| 0.00 | 0.00 | 0.2382 | -0.1019 |
Pengajuan 13F dan Dana
Formulir ini diajukan pada 2025-07-22 untuk periode pelaporan 2025-06-30. Klik ikon tautan untuk melihat riwayat transaksi selengkapnya.
Tingkatkan ke versi premium untuk membuka data premium dan ekspor ke Excel. ![]() .
.
| Keamanan | Ketik | Harga Saham Rata-rata | Saham (MM) |
ΔSaham (%) |
ΔSaham (%) |
Nilai ($MM) |
Portpolyo (%) |
ΔPortofolio (%) |
|
|---|---|---|---|---|---|---|---|---|---|
| NVDA / NVIDIA Corporation | 0.25 | -0.71 | 0.04 | 44.44 | 18.3825 | 4.3395 | |||
| MSFT / Microsoft Corporation | 0.05 | -0.61 | 0.02 | 33.33 | 11.1097 | 1.7824 | |||
| JPM / JPMorgan Chase & Co. | 0.04 | -0.56 | 0.01 | 20.00 | 5.5859 | 0.3307 | |||
| WMT / Walmart Inc. | 0.10 | -0.27 | 0.01 | 12.50 | 4.4442 | 0.0198 | |||
| AMZN / Amazon.com, Inc. | 0.04 | -1.75 | 0.01 | 12.50 | 4.3950 | 0.1058 | |||
| PM / Philip Morris International Inc. | 0.05 | -0.62 | 0.01 | 12.50 | 4.3900 | 0.1333 | |||
| RTX / RTX Corporation | 0.06 | -0.62 | 0.01 | 0.00 | 4.0764 | -0.0379 | |||
| C.WSA / Citigroup, Inc. | 0.01 | -0.75 | 0.01 | 14.29 | 3.8116 | -0.0191 | |||
| LMT / Lockheed Martin Corporation | 0.02 | -0.74 | 0.01 | 0.00 | 3.4401 | -0.2558 | |||
| CSCO / Cisco Systems, Inc. | 0.11 | -0.87 | 0.01 | 16.67 | 3.4387 | 0.0270 | |||
| GOOGL / Alphabet Inc. | 0.04 | -0.70 | 0.01 | 16.67 | 3.2217 | 0.0738 | |||
| HD / The Home Depot, Inc. | 0.02 | 0.13 | 0.01 | 0.00 | 3.2028 | -0.3324 | |||
| TXN / Texas Instruments Incorporated | 0.03 | 0.00 | 0.01 | 20.00 | 3.1458 | 0.1352 | |||
| CVX / Chevron Corporation | 0.04 | 0.26 | 0.01 | -14.29 | 2.8773 | -0.8298 | |||
| NOC / Northrop Grumman Corporation | 0.01 | -0.04 | 0.01 | 0.00 | 2.8088 | -0.3732 | |||
| BAC / Bank of America Corporation | 0.13 | -0.55 | 0.01 | 20.00 | 2.7775 | 0.0541 | |||
| LHX / L3Harris Technologies, Inc. | 0.02 | 0.32 | 0.01 | 25.00 | 2.6971 | 0.2167 | |||
| JNJ / Johnson & Johnson | 0.04 | 0.98 | 0.01 | -16.67 | 2.6433 | -0.4995 | |||
| PSA / Public Storage | 0.02 | 1.14 | 0.01 | 0.00 | 2.6401 | -0.3040 | |||
| XOM / Exxon Mobil Corporation | 0.05 | 1.15 | 0.01 | -16.67 | 2.5407 | -0.5233 | |||
| SCHX / Schwab Strategic Trust - Schwab U.S. Large-Cap ETF | 0.18 | 3.44 | 0.00 | 33.33 | 2.0506 | 0.0705 | |||
| EPD / Enterprise Products Partners L.P. - Limited Partnership | 0.13 | -0.39 | 0.00 | -25.00 | 1.8364 | -0.4076 | |||
| PFE / Pfizer Inc. | 0.11 | -1.31 | 0.00 | 0.00 | 1.2216 | -0.2095 | |||
| LIN / Linde plc | 0.00 | -0.36 | 0.00 | 0.00 | 0.5945 | -0.0598 | |||
| GJR / Strats Trust For Procter & Gambel Security - Preferred Security | 0.01 | 0.00 | 0.00 | -100.00 | 0.4455 | -0.0817 | |||
| BRK.B / Berkshire Hathaway Inc. | 0.00 | 0.00 | 0.00 | -100.00 | 0.4391 | -0.0932 | |||
| SCHA / Schwab Strategic Trust - Schwab U.S. Small-Cap ETF | 0.03 | -6.26 | 0.00 | 0.3306 | -0.0304 | ||||
| NVTS / Navitas Semiconductor Corporation | 0.10 | -8.80 | 0.00 | 0.3030 | 0.1881 | ||||
| QQQ / Invesco QQQ Trust, Series 1 | 0.00 | 3.43 | 0.00 | 0.2451 | 0.0229 | ||||
| SCHM / Schwab Strategic Trust - Schwab U.S. Mid-Cap ETF | 0.02 | -1.04 | 0.00 | 0.2391 | -0.0100 | ||||
| SPY / SPDR S&P 500 ETF | 0.00 | -29.85 | 0.00 | 0.2382 | -0.1019 | ||||
| XLK / The Select Sector SPDR Trust - The Technology Select Sector SPDR Fund | 0.00 | 0.00 | 0.00 | 0.1807 | 0.0180 | ||||
| AAPL / Apple Inc. | 0.00 | 0.07 | 0.00 | 0.1329 | -0.0262 | ||||
| BFST / Business First Bancshares, Inc. | 0.01 | 0.00 | 0.00 | 0.1136 | -0.0105 | ||||
| UNH / UnitedHealth Group Incorporated | 0.00 | -100.00 | 0.00 | 0.0000 |