Mga Batayang Estadistika
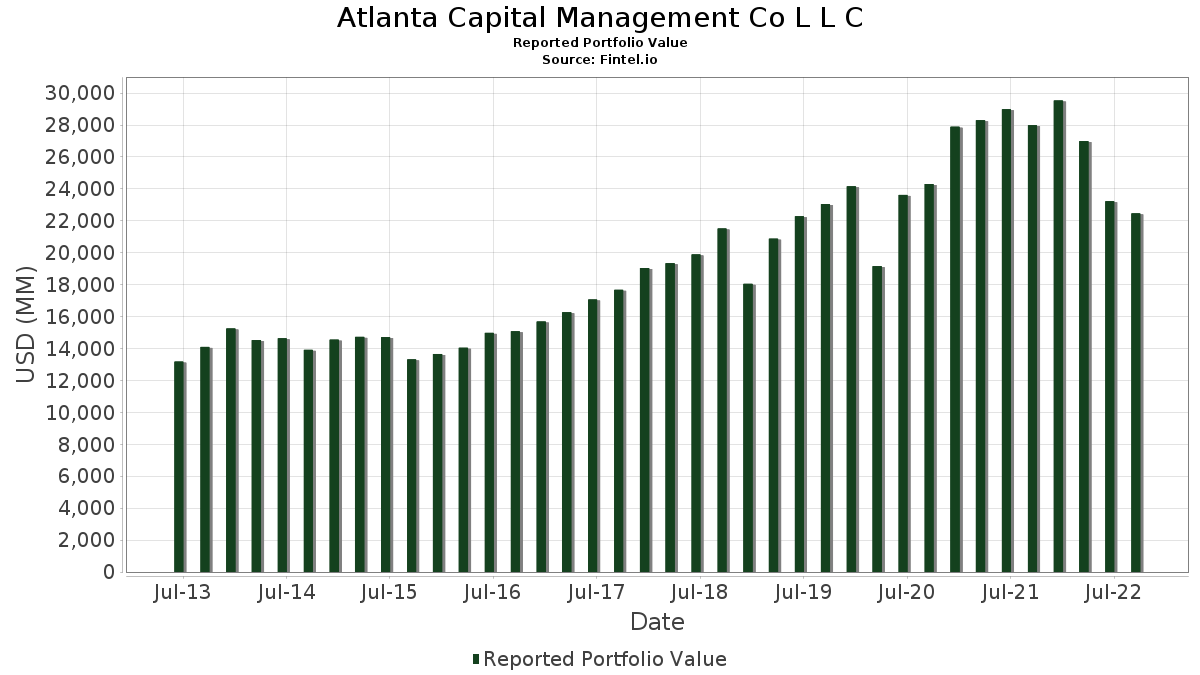
| Nilai Portofolio | $ 22,460,866,000 |
| Posisi Saat Ini | 161 |
Kepemilikan Terbaru, Kinerja, AUM (dari 13F, 13D)
Atlanta Capital Management Co L L C telah mengungkapkan total kepemilikan 161 dalam pengajuan SEC terbaru mereka. Nilai portofolio terbaru dihitung sebesar $ 22,460,866,000 USD. Aset yang Dikelola (AUM) sebenarnya adalah nilai ini ditambah kas (yang tidak diungkapkan). Aset-aset utama Atlanta Capital Management Co L L C adalah W. R. Berkley Corporation (US:WRB) , Gartner, Inc. (US:IT) , Carlisle Companies Incorporated (US:CSL) , Alphabet Inc. (US:GOOGL) , and Markel Group Inc. (US:MKL) .
Peningkatan Tertinggi Kuartal Ini
Kami menggunakan perubahan dalam alokasi portofolio karena ini adalah metrik yang paling bermakna. Perubahan dapat disebabkan oleh perdagangan atau perubahan harga saham.
| Keamanan | Saham (MM) |
Nilai (Juta Dolar AS) |
Portfolio % | ΔPorsyento ng Portfolio |
|---|---|---|---|---|
| 1.76 | 486.41 | 2.1656 | 0.3596 | |
| 6.61 | 410.82 | 1.8291 | 0.2979 | |
| 0.66 | 109.85 | 0.4891 | 0.1979 | |
| 1.50 | 300.28 | 1.3369 | 0.1760 | |
| 1.94 | 169.51 | 0.7547 | 0.1440 | |
| 3.49 | 326.38 | 1.4531 | 0.1432 | |
| 4.19 | 348.70 | 1.5525 | 0.1269 | |
| 0.33 | 229.19 | 1.0204 | 0.1222 | |
| 1.21 | 173.96 | 0.7745 | 0.1205 | |
| 0.41 | 129.02 | 0.5744 | 0.1175 |
Penurunan Tertinggi Kuartal Ini
Kami menggunakan perubahan dalam alokasi portofolio karena ini adalah metrik yang paling bermakna. Perubahan dapat disebabkan oleh perdagangan atau perubahan harga saham.
| Keamanan | Saham (MM) |
Nilai (Juta Dolar AS) |
Portfolio % | ΔPorsyento ng Portfolio |
|---|---|---|---|---|
| 1.73 | 484.21 | 2.1558 | -0.3466 | |
| 0.00 | 0.00 | -0.3093 | ||
| 0.40 | 434.79 | 1.9358 | -0.2757 | |
| 3.55 | 156.63 | 0.6973 | -0.2009 | |
| 2.19 | 126.17 | 0.5617 | -0.1987 | |
| 13.50 | 421.33 | 1.8758 | -0.1777 | |
| 10.47 | 343.60 | 1.5298 | -0.1744 | |
| 1.64 | 208.80 | 0.9296 | -0.1732 | |
| 0.00 | 0.00 | -0.1365 | ||
| 1.76 | 84.89 | 0.3779 | -0.1147 |
Pengajuan 13F dan Dana
Formulir ini diajukan pada 2022-11-14 untuk periode pelaporan 2022-09-30. Klik ikon tautan untuk melihat riwayat transaksi selengkapnya.
Tingkatkan ke versi premium untuk membuka data premium dan ekspor ke Excel. ![]() .
.
| Keamanan | Ketik | Harga Saham Rata-rata | Saham (MM) |
ΔSaham (%) |
ΔSaham (%) |
Nilai ($MM) |
Portpolyo (%) |
ΔPortofolio (%) |
|
|---|---|---|---|---|---|---|---|---|---|
| WRB / W. R. Berkley Corporation | 9.03 | 0.48 | 582.85 | -4.93 | 2.5949 | -0.0450 | |||
| IT / Gartner, Inc. | 1.76 | 1.36 | 486.41 | 15.97 | 2.1656 | 0.3596 | |||
| CSL / Carlisle Companies Incorporated | 1.73 | -29.10 | 484.21 | -16.68 | 2.1558 | -0.3466 | |||
| GOOGL / Alphabet Inc. | 4.57 | 1,996.95 | 439.81 | -7.83 | 1.9581 | -0.0965 | |||
| MKL / Markel Group Inc. | 0.40 | 0.98 | 434.79 | -15.34 | 1.9358 | -0.2757 | |||
| ARMK / Aramark | 13.50 | -13.27 | 421.33 | -11.65 | 1.8758 | -0.1777 | |||
| DHR / Danaher Corporation | 1.60 | 1.12 | 413.11 | 3.02 | 1.8392 | 0.1126 | |||
| TJX / The TJX Companies, Inc. | 6.61 | 3.87 | 410.82 | 15.53 | 1.8291 | 0.2979 | |||
| TMO / Thermo Fisher Scientific Inc. | 0.80 | 5.64 | 406.90 | -1.38 | 1.8116 | 0.0350 | |||
| V / Visa Inc. | 2.20 | 4.68 | 391.09 | -5.55 | 1.7412 | -0.0417 | |||
| GDDY / GoDaddy Inc. | 5.20 | 0.10 | 368.90 | 2.00 | 1.6424 | 0.0851 | |||
| BRO / Brown & Brown, Inc. | 6.06 | -0.15 | 366.28 | 3.51 | 1.6308 | 0.1071 | |||
| RPM / RPM International Inc. | 4.19 | -0.48 | 348.70 | 5.33 | 1.5525 | 0.1269 | |||
| NVST / Envista Holdings Corporation | 10.47 | 1.98 | 343.60 | -13.18 | 1.5298 | -0.1744 | |||
| FISV / Fiserv, Inc. | 3.49 | 2.01 | 326.38 | 7.28 | 1.4531 | 0.1432 | |||
| LSTR / Landstar System, Inc. | 2.25 | -0.64 | 324.53 | -1.36 | 1.4449 | 0.0282 | |||
| MSFT / Microsoft Corporation | 1.38 | 5.92 | 321.69 | -3.95 | 1.4322 | -0.0099 | |||
| VRSK / Verisk Analytics, Inc. | 1.88 | 4.71 | 320.60 | 3.17 | 1.4274 | 0.0893 | |||
| CACI / CACI International Inc | 1.23 | -0.13 | 319.93 | -7.47 | 1.4244 | -0.0644 | |||
| MA / Mastercard Incorporated | 1.07 | 6.97 | 302.95 | -3.58 | 1.3488 | -0.0042 | |||
| IEX / IDEX Corporation | 1.50 | 1.23 | 300.28 | 11.38 | 1.3369 | 0.1760 | |||
| CHH / Choice Hotels International, Inc. | 2.71 | -0.09 | 297.19 | -1.97 | 1.3231 | 0.0177 | |||
| BAH / Booz Allen Hamilton Holding Corporation | 3.16 | -0.10 | 291.92 | 2.10 | 1.2997 | 0.0686 | |||
| SEIC / SEI Investments Company | 5.95 | -0.13 | 291.73 | -9.31 | 1.2988 | -0.0864 | |||
| TFX / Teleflex Incorporated | 1.44 | 11.56 | 290.27 | -8.58 | 1.2924 | -0.0749 | |||
| LKQ / LKQ Corporation | 5.94 | -0.20 | 280.08 | -4.14 | 1.2470 | -0.0112 | |||
| ULTA / Ulta Beauty, Inc. | 0.69 | -1.15 | 275.47 | 2.87 | 1.2264 | 0.0734 | |||
| ATR / AptarGroup, Inc. | 2.88 | -0.11 | 274.08 | -8.02 | 1.2203 | -0.0629 | |||
| AMG / Affiliated Managers Group, Inc. | 2.44 | 0.42 | 272.93 | -3.67 | 1.2151 | -0.0049 | |||
| TMX / Terminix Global Holdings Inc | 6.84 | -0.22 | 261.73 | -6.01 | 1.1653 | -0.0338 | |||
| LII / Lennox International Inc. | 1.10 | -0.05 | 244.03 | 7.73 | 1.0865 | 0.1111 | |||
| DLB / Dolby Laboratories, Inc. | 3.74 | -0.04 | 243.51 | -8.99 | 1.0841 | -0.0680 | |||
| JBHT / J.B. Hunt Transport Services, Inc. | 1.53 | -5.09 | 239.93 | -5.72 | 1.0682 | -0.0276 | |||
| DG / Dollar General Corporation | 0.99 | 6.78 | 238.33 | 4.35 | 1.0611 | 0.0777 | |||
| KEX / Kirby Corporation | 3.91 | 0.08 | 237.31 | -0.03 | 1.0566 | 0.0344 | |||
| AMT / American Tower Corporation | 1.10 | 5.68 | 235.57 | -11.23 | 1.0488 | -0.0939 | |||
| COLM / Columbia Sportswear Company | 3.49 | 6.90 | 235.07 | 0.51 | 1.0466 | 0.0395 | |||
| ZTS / Zoetis Inc. | 1.58 | 5.62 | 234.33 | -8.88 | 1.0433 | -0.0640 | |||
| BKI / Black Knight Inc - Class A | 3.56 | -0.40 | 230.31 | -1.40 | 1.0254 | 0.0196 | |||
| ORLY / O'Reilly Automotive, Inc. | 0.33 | -1.31 | 229.19 | 9.88 | 1.0204 | 0.1222 | |||
| MORN / Morningstar, Inc. | 1.03 | 0.25 | 218.61 | -11.98 | 0.9733 | -0.0962 | |||
| SPGI / S&P Global Inc. | 0.70 | 15.60 | 213.37 | 4.72 | 0.9500 | 0.0726 | |||
| JLL / Jones Lang LaSalle Incorporated | 1.39 | 0.03 | 209.40 | -13.57 | 0.9323 | -0.1110 | |||
| WEX / WEX Inc. | 1.64 | -0.09 | 208.80 | -18.47 | 0.9296 | -0.1732 | |||
| ECL / Ecolab Inc. | 1.40 | 7.09 | 201.60 | 0.58 | 0.8976 | 0.0345 | |||
| ICE / Intercontinental Exchange, Inc. | 2.20 | 5.40 | 198.51 | 1.27 | 0.8838 | 0.0397 | |||
| APH / Amphenol Corporation | 2.85 | 7.01 | 191.17 | 11.29 | 0.8511 | 0.1115 | |||
| NDSN / Nordson Corporation | 0.90 | -0.16 | 190.76 | 4.69 | 0.8493 | 0.0647 | |||
| LIN / Linde plc | 0.69 | 6.97 | 186.18 | 0.30 | 0.8289 | 0.0296 | |||
| IAA / IAA Inc | 5.79 | -0.27 | 184.36 | -3.07 | 0.8208 | 0.0018 | |||
| CASY / Casey's General Stores, Inc. | 0.91 | -0.42 | 183.72 | 9.02 | 0.8180 | 0.0923 | |||
| HXL / Hexcel Corporation | 3.52 | -8.34 | 182.18 | -9.37 | 0.8111 | -0.0545 | |||
| BR / Broadridge Financial Solutions, Inc. | 1.21 | 13.14 | 173.96 | 14.54 | 0.7745 | 0.1205 | |||
| MMC / Marsh & McLennan Companies, Inc. | 1.14 | 6.47 | 170.25 | 2.38 | 0.7580 | 0.0420 | |||
| XYL / Xylem Inc. | 1.94 | 6.96 | 169.51 | 19.52 | 0.7547 | 0.1440 | |||
| WTM / White Mountains Insurance Group, Ltd. | 0.13 | -5.71 | 166.09 | -1.41 | 0.7395 | 0.0141 | |||
| BLKB / Blackbaud, Inc. | 3.55 | -1.04 | 156.63 | -24.92 | 0.6973 | -0.2009 | |||
| UMPQ / Umpqua Holdings Corp | 9.03 | -1.07 | 154.30 | 0.82 | 0.6870 | 0.0279 | |||
| PB / Prosperity Bancshares, Inc. | 2.31 | -0.21 | 153.99 | -2.54 | 0.6856 | 0.0052 | |||
| AYI / Acuity Inc. | 0.92 | -0.10 | 145.58 | 2.13 | 0.6481 | 0.0343 | |||
| JKHY / Jack Henry & Associates, Inc. | 0.75 | -0.50 | 136.01 | 0.75 | 0.6056 | 0.0242 | |||
| TECH / Bio-Techne Corporation | 0.47 | -0.05 | 134.19 | -18.11 | 0.5974 | -0.1082 | |||
| MANH / Manhattan Associates, Inc. | 1.01 | -0.84 | 133.73 | 15.11 | 0.5954 | 0.0951 | |||
| TRMB / Trimble Inc. | 2.40 | 16.44 | 129.99 | 8.52 | 0.5787 | 0.0630 | |||
| POOL / Pool Corporation | 0.41 | 0.14 | 129.28 | -9.27 | 0.5756 | -0.0380 | |||
| FDS / FactSet Research Systems Inc. | 0.32 | -0.34 | 129.22 | 3.69 | 0.5753 | 0.0387 | |||
| DECK / Deckers Outdoor Corporation | 0.41 | -0.68 | 129.02 | 21.59 | 0.5744 | 0.1175 | |||
| SCI / Service Corporation International | 2.19 | -14.47 | 126.17 | -28.56 | 0.5617 | -0.1987 | |||
| INTU / Intuit Inc. | 0.32 | 5.94 | 123.03 | 6.45 | 0.5477 | 0.0501 | |||
| ADBE / Adobe Inc. | 0.44 | 22.51 | 121.68 | -7.90 | 0.5417 | -0.0271 | |||
| GPN / Global Payments Inc. | 1.08 | 6.57 | 117.14 | 4.07 | 0.5215 | 0.0369 | |||
| GGG / Graco Inc. | 1.94 | -0.09 | 116.07 | 0.82 | 0.5168 | 0.0210 | |||
| WWD / Woodward, Inc. | 1.42 | 0.60 | 113.76 | -12.70 | 0.5065 | -0.0546 | |||
| FCN / FTI Consulting, Inc. | 0.66 | 77.30 | 109.85 | 62.45 | 0.4891 | 0.1979 | |||
| CDW / CDW Corporation | 0.69 | -0.23 | 108.05 | -1.16 | 0.4811 | 0.0103 | |||
| A / Agilent Technologies, Inc. | 0.84 | 19.10 | 102.42 | 21.88 | 0.4560 | 0.0942 | |||
| BURL / Burlington Stores, Inc. | 0.89 | 0.48 | 99.68 | -17.47 | 0.4438 | -0.0763 | |||
| EL / The Estée Lauder Companies Inc. | 0.46 | 4.42 | 98.84 | -11.48 | 0.4400 | -0.0407 | |||
| APD / Air Products and Chemicals, Inc. | 0.39 | 4.76 | 91.79 | 1.38 | 0.4087 | 0.0188 | |||
| SBUX / Starbucks Corporation | 1.07 | 4.49 | 89.99 | 15.26 | 0.4007 | 0.0644 | |||
| LOW / Lowe's Companies, Inc. | 0.47 | 4.45 | 88.17 | 12.31 | 0.3926 | 0.0545 | |||
| SCHW / The Charles Schwab Corporation | 1.20 | 4.48 | 86.30 | 18.85 | 0.3842 | 0.0716 | |||
| BALL / Ball Corporation | 1.76 | 5.61 | 84.89 | -25.80 | 0.3779 | -0.1147 | |||
| AON / Aon plc | 0.31 | 4.83 | 82.60 | 4.12 | 0.3678 | 0.0262 | |||
| KNSL / Kinsale Capital Group, Inc. | 0.32 | -18.68 | 82.20 | -9.55 | 0.3660 | -0.0253 | |||
| ROST / Ross Stores, Inc. | 0.94 | 3.44 | 79.05 | 24.12 | 0.3520 | 0.0777 | |||
| HSIC / Henry Schein, Inc. | 1.14 | 0.03 | 75.24 | -14.27 | 0.3350 | -0.0429 | |||
| EA / Electronic Arts Inc. | 0.63 | 4.95 | 73.43 | -0.17 | 0.3269 | 0.0102 | |||
| PYPL / PayPal Holdings, Inc. | 0.85 | 5.72 | 73.21 | 30.28 | 0.3259 | 0.0840 | |||
| WMS / Advanced Drainage Systems, Inc. | 0.59 | -0.06 | 72.78 | 37.99 | 0.3240 | 0.0969 | |||
| QLYS / Qualys, Inc. | 0.52 | -8.72 | 72.76 | 0.87 | 0.3240 | 0.0133 | |||
| CCI / Crown Castle Inc. | 0.50 | 4.46 | 72.09 | -10.33 | 0.3209 | -0.0252 | |||
| DEO / Diageo plc - Depositary Receipt (Common Stock) | 0.41 | -0.67 | 70.27 | -3.13 | 0.3129 | 0.0005 | |||
| FIS / Fidelity National Information Services, Inc. | 0.90 | 4.72 | 68.08 | -13.67 | 0.3031 | -0.0365 | |||
| MLM / Martin Marietta Materials, Inc. | 0.20 | 0.91 | 65.08 | 8.61 | 0.2897 | 0.0317 | |||
| SIGI / Selective Insurance Group, Inc. | 0.79 | -6.29 | 64.22 | -12.26 | 0.2859 | -0.0292 | |||
| IPAR / Interparfums, Inc. | 0.85 | -6.47 | 64.20 | -3.40 | 0.2858 | -0.0003 | |||
| TXN / Texas Instruments Incorporated | 0.41 | 4.65 | 63.60 | 5.42 | 0.2832 | 0.0234 | |||
| COST / Costco Wholesale Corporation | 0.13 | 5.42 | 63.47 | 3.88 | 0.2826 | 0.0195 | |||
| STE / STERIS plc | 0.37 | -3.54 | 61.17 | -22.20 | 0.2724 | -0.0662 | |||
| NKE / NIKE, Inc. | 0.73 | 4.48 | 60.98 | -15.02 | 0.2715 | -0.0375 | |||
| BECN / Beacon Roofing Supply, Inc. | 1.07 | -2.02 | 58.30 | 4.39 | 0.2595 | 0.0191 | |||
| TEL / TE Connectivity plc | 0.52 | 4.43 | 57.59 | 1.85 | 0.2564 | 0.0129 | |||
| MCO / Moody's Corporation | 0.23 | 5.77 | 55.55 | -5.45 | 0.2473 | -0.0057 | |||
| ICUI / ICU Medical, Inc. | 0.35 | -2.24 | 53.38 | -10.44 | 0.2377 | -0.0190 | |||
| CBZ / CBIZ, Inc. | 1.20 | -5.09 | 51.13 | 1.61 | 0.2276 | 0.0110 | |||
| ACN / Accenture plc | 0.20 | 4.45 | 50.47 | -3.20 | 0.2247 | 0.0002 | |||
| AME / AMETEK, Inc. | 0.44 | -2.60 | 49.88 | 0.52 | 0.2221 | 0.0084 | |||
| IDXX / IDEXX Laboratories, Inc. | 0.15 | 6.14 | 48.83 | -1.41 | 0.2174 | 0.0041 | |||
| DORM / Dorman Products, Inc. | 0.59 | -3.61 | 48.60 | -27.85 | 0.2164 | -0.0737 | |||
| FWRD / Forward Air Corporation | 0.53 | -4.87 | 47.70 | -6.63 | 0.2124 | -0.0076 | |||
| NSIT / Insight Enterprises, Inc. | 0.53 | 6.71 | 43.72 | 1.93 | 0.1946 | 0.0100 | |||
| JJSF / J&J Snack Foods Corp. | 0.33 | -5.34 | 43.16 | -12.25 | 0.1922 | -0.0196 | |||
| MOG.A / Moog Inc. | 0.61 | -7.44 | 42.95 | -17.98 | 0.1912 | -0.0342 | |||
| UNF / UniFirst Corporation | 0.24 | -6.57 | 40.55 | -8.71 | 0.1805 | -0.0107 | |||
| LH / Labcorp Holdings Inc. | 0.20 | 4.45 | 40.51 | -8.72 | 0.1803 | -0.0107 | |||
| NRCIA / National Research Corp. | 0.96 | 21.88 | 38.17 | 26.72 | 0.1700 | 0.0402 | |||
| IART / Integra LifeSciences Holdings Corporation | 0.90 | -2.09 | 38.17 | -23.24 | 0.1699 | -0.0442 | |||
| TRU / TransUnion | 0.64 | 2.41 | 38.02 | -23.83 | 0.1693 | -0.0457 | |||
| SLGN / Silgan Holdings Inc. | 0.90 | -4.22 | 37.99 | -2.63 | 0.1691 | 0.0011 | |||
| HURN / Huron Consulting Group Inc. | 0.57 | -7.55 | 37.54 | -5.76 | 0.1671 | -0.0044 | |||
| PRFT / Perficient, Inc. | 0.58 | 34.15 | 37.49 | -4.87 | 0.1669 | -0.0028 | |||
| SHW / The Sherwin-Williams Company | 0.18 | 0.09 | 37.04 | -8.48 | 0.1649 | -0.0094 | |||
| SSB / SouthState Corporation | 0.46 | -5.53 | 36.58 | -3.12 | 0.1628 | 0.0003 | |||
| RLI / RLI Corp. | 0.34 | -4.32 | 35.02 | -15.98 | 0.1559 | -0.0236 | |||
| HLI / Houlihan Lokey, Inc. | 0.46 | -4.05 | 34.98 | -8.36 | 0.1557 | -0.0086 | |||
| MGRC / McGrath RentCorp | 0.41 | 24.17 | 34.46 | 37.01 | 0.1534 | 0.0451 | |||
| TTGT / TechTarget, Inc. | 0.58 | 29.44 | 34.33 | 16.60 | 0.1528 | 0.0261 | |||
| NATI / National Instruments Corp. | 0.88 | -1.66 | 33.36 | 18.84 | 0.1485 | 0.0277 | |||
| ADSK / Autodesk, Inc. | 0.17 | -0.18 | 32.45 | 8.44 | 0.1445 | 0.0156 | |||
| EXPO / Exponent, Inc. | 0.37 | -4.90 | 32.18 | -8.85 | 0.1433 | -0.0087 | |||
| WWW / Wolverine World Wide, Inc. | 2.02 | -5.22 | 31.14 | -27.65 | 0.1386 | -0.0467 | |||
| ENV / Envestnet, Inc. | 0.70 | 2.15 | 30.89 | -14.06 | 0.1375 | -0.0172 | |||
| POWI / Power Integrations, Inc. | 0.46 | -1.87 | 29.73 | -15.86 | 0.1324 | -0.0198 | |||
| HLNE / Hamilton Lane Incorporated | 0.48 | 58.81 | 28.46 | 40.92 | 0.1267 | 0.0398 | |||
| SSD / Simpson Manufacturing Co., Inc. | 0.34 | -4.74 | 26.54 | -25.77 | 0.1181 | -0.0358 | |||
| APAM / Artisan Partners Asset Management Inc. | 0.98 | -5.40 | 26.35 | -28.38 | 0.1173 | -0.0411 | |||
| ALG / Alamo Group Inc. | 0.21 | -2.67 | 26.21 | 2.21 | 0.1167 | 0.0063 | |||
| SFM / Sprouts Farmers Market, Inc. | 0.92 | -4.87 | 25.47 | 4.26 | 0.1134 | 0.0082 | |||
| FUL / H.B. Fuller Company | 0.42 | -3.47 | 25.23 | -3.64 | 0.1123 | -0.0004 | |||
| ISRG / Intuitive Surgical, Inc. | 0.13 | 4.43 | 25.19 | -2.47 | 0.1122 | 0.0009 | |||
| PLUS / ePlus inc. | 0.61 | -5.82 | 25.19 | -26.35 | 0.1121 | -0.0351 | |||
| MNRO / Monro, Inc. | 0.58 | -4.06 | 25.00 | -2.76 | 0.1113 | 0.0006 | |||
| / Voya Prime Rate Trust | 1.15 | -1.46 | 24.07 | -20.45 | 0.1072 | -0.0231 | |||
| META / Meta Platforms, Inc. | 0.18 | 11.12 | 24.07 | -6.50 | 0.1072 | -0.0037 | |||
| LANC / Lancaster Colony Corporation | 0.16 | -3.85 | 24.00 | 12.20 | 0.1069 | 0.0147 | |||
| MLAB / Mesa Laboratories, Inc. | 0.17 | -3.43 | 23.28 | -33.31 | 0.1037 | -0.0467 | |||
| BCPC / Balchem Corporation | 0.19 | -4.63 | 22.62 | -10.63 | 0.1007 | -0.0083 | |||
| CENT / Central Garden & Pet Company | 0.62 | -4.18 | 22.23 | -18.60 | 0.0990 | -0.0186 | |||
| WABC / Westamerica Bancorporation | 0.41 | -7.42 | 21.21 | -13.02 | 0.0945 | -0.0106 | |||
| PNFP / Pinnacle Financial Partners, Inc. | 0.26 | -5.83 | 20.84 | 5.61 | 0.0928 | 0.0078 | |||
| SCL / Stepan Company | 0.21 | -4.38 | 19.69 | -11.63 | 0.0877 | -0.0083 | |||
| CVLT / Commvault Systems, Inc. | 0.34 | -3.94 | 18.02 | -19.00 | 0.0802 | -0.0156 | |||
| SBH / Sally Beauty Holdings, Inc. | 1.40 | -3.91 | 17.63 | 1.57 | 0.0785 | 0.0038 | |||
| AAON / AAON, Inc. | 0.32 | -6.07 | 17.40 | -7.58 | 0.0775 | -0.0036 | |||
| FTDR / Frontdoor, Inc. | 0.79 | -3.35 | 16.11 | -18.16 | 0.0717 | -0.0130 | |||
| KAR / OPENLANE, Inc. | 1.43 | -4.28 | 15.99 | -27.61 | 0.0712 | -0.0239 | |||
| PDCO / Patterson Companies, Inc. | 0.63 | -3.71 | 15.19 | -23.66 | 0.0676 | -0.0180 | |||
| IWM / iShares Trust - iShares Russell 2000 ETF | 0.07 | -10.15 | 11.13 | -12.51 | 0.0496 | -0.0052 | |||
| IWB / iShares Trust - iShares Russell 1000 ETF | 0.05 | -55.37 | 10.22 | -57.61 | 0.0455 | -0.0583 | |||
| IWF / iShares Trust - iShares Russell 1000 Growth ETF | 0.00 | -77.96 | 0.85 | -78.79 | 0.0038 | -0.0134 | |||
| CASS / Cass Information Systems, Inc. | 0.00 | -100.00 | 0.00 | -100.00 | -0.0376 | ||||
| USB / U.S. Bancorp | 0.00 | -100.00 | 0.00 | -100.00 | -0.3093 | ||||
| SPY / SPDR S&P 500 ETF | 0.00 | -100.00 | 0.00 | -100.00 | -0.0046 | ||||
| VV / Vanguard Index Funds - Vanguard Large-Cap ETF | 0.00 | -100.00 | 0.00 | -100.00 | -0.0013 | ||||
| ROG / Rogers Corporation | 0.00 | -100.00 | 0.00 | -100.00 | -0.1365 |