Mga Batayang Estadistika
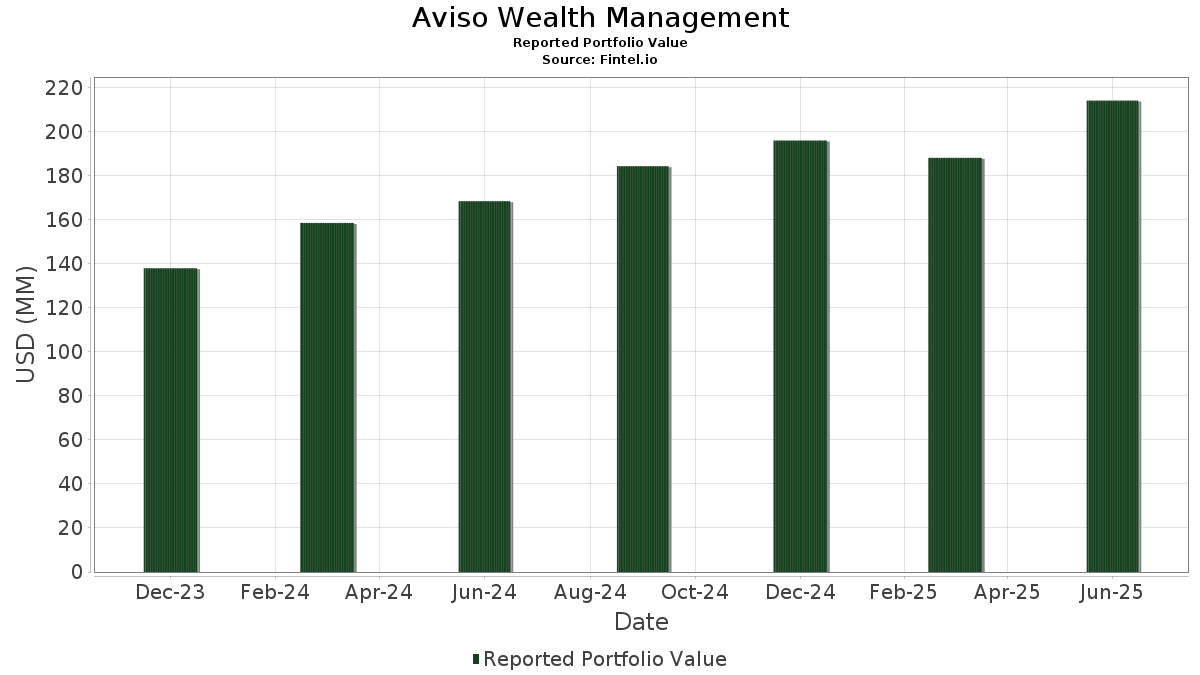
| Nilai Portofolio | $ 214,152,213 |
| Posisi Saat Ini | 144 |
Kepemilikan Terbaru, Kinerja, AUM (dari 13F, 13D)
Aviso Wealth Management telah mengungkapkan total kepemilikan 144 dalam pengajuan SEC terbaru mereka. Nilai portofolio terbaru dihitung sebesar $ 214,152,213 USD. Aset yang Dikelola (AUM) sebenarnya adalah nilai ini ditambah kas (yang tidak diungkapkan). Aset-aset utama Aviso Wealth Management adalah Apple Inc. (US:AAPL) , Netflix, Inc. (US:NFLX) , NVIDIA Corporation (US:NVDA) , Meta Platforms, Inc. (US:META) , and Microsoft Corporation (US:MSFT) . Posisi baru Aviso Wealth Management meliputi: Vanguard Index Funds - Vanguard Total Stock Market ETF (US:VTI) , Capital One Financial Corporation (US:COF) , Howmet Aerospace Inc. (US:HWM) , SPDR Series Trust - SPDR Portfolio S&P 1500 Composite Stock Market ETF (US:SPTM) , and Boston Scientific Corporation (US:BSX) .
Peningkatan Tertinggi Kuartal Ini
Kami menggunakan perubahan dalam alokasi portofolio karena ini adalah metrik yang paling bermakna. Perubahan dapat disebabkan oleh perdagangan atau perubahan harga saham.
| Keamanan | Saham (MM) |
Nilai (Juta Dolar AS) |
Portfolio % | ΔPorsyento ng Portfolio |
|---|---|---|---|---|
| 0.08 | 11.90 | 5.5577 | 1.1500 | |
| 0.01 | 12.91 | 6.0289 | 0.8201 | |
| 0.02 | 9.05 | 4.2260 | 0.7558 | |
| 0.01 | 10.39 | 4.8497 | 0.6407 | |
| 0.01 | 3.56 | 1.6628 | 0.5399 | |
| 0.00 | 2.85 | 1.3313 | 0.4268 | |
| 0.01 | 2.01 | 0.9364 | 0.3648 | |
| 0.00 | 2.62 | 1.2256 | 0.2891 | |
| 0.02 | 4.02 | 1.8750 | 0.2722 | |
| 0.00 | 1.41 | 0.6601 | 0.2380 |
Penurunan Tertinggi Kuartal Ini
Kami menggunakan perubahan dalam alokasi portofolio karena ini adalah metrik yang paling bermakna. Perubahan dapat disebabkan oleh perdagangan atau perubahan harga saham.
| Keamanan | Saham (MM) |
Nilai (Juta Dolar AS) |
Portfolio % | ΔPorsyento ng Portfolio |
|---|---|---|---|---|
| 0.08 | 16.38 | 7.6496 | -1.7210 | |
| 0.00 | 0.62 | 0.2912 | -0.6135 | |
| 0.00 | 0.54 | 0.2518 | -0.4932 | |
| 0.01 | 4.03 | 1.8818 | -0.3909 | |
| 0.00 | 1.08 | 0.5021 | -0.3209 | |
| 0.02 | 3.30 | 1.5412 | -0.3176 | |
| 0.02 | 2.71 | 1.2647 | -0.3164 | |
| 0.04 | 1.12 | 0.5237 | -0.2980 | |
| 0.02 | 1.04 | 0.4867 | -0.2869 | |
| 0.00 | 0.53 | 0.2476 | -0.2620 |
Pengajuan 13F dan Dana
Formulir ini diajukan pada 2025-08-11 untuk periode pelaporan 2025-06-30. Klik ikon tautan untuk melihat riwayat transaksi selengkapnya.
Tingkatkan ke versi premium untuk membuka data premium dan ekspor ke Excel. ![]() .
.
| Keamanan | Ketik | Harga Saham Rata-rata | Saham (MM) |
ΔSaham (%) |
ΔSaham (%) |
Nilai ($MM) |
Portpolyo (%) |
ΔPortofolio (%) |
|
|---|---|---|---|---|---|---|---|---|---|
| AAPL / Apple Inc. | 0.08 | 0.60 | 16.38 | -7.08 | 7.6496 | -1.7210 | |||
| NFLX / Netflix, Inc. | 0.01 | -8.26 | 12.91 | 31.73 | 6.0289 | 0.8201 | |||
| NVDA / NVIDIA Corporation | 0.08 | -1.55 | 11.90 | 43.51 | 5.5577 | 1.1500 | |||
| META / Meta Platforms, Inc. | 0.01 | 2.41 | 10.39 | 31.14 | 4.8497 | 0.6407 | |||
| MSFT / Microsoft Corporation | 0.02 | 4.61 | 9.05 | 38.61 | 4.2260 | 0.7558 | |||
| GOOGL / Alphabet Inc. | 0.04 | 1.32 | 7.90 | 15.47 | 3.6907 | 0.0527 | |||
| AMZN / Amazon.com, Inc. | 0.03 | 3.32 | 6.95 | 19.15 | 3.2456 | 0.1450 | |||
| BRK.B / Berkshire Hathaway Inc. | 0.01 | 3.33 | 4.03 | -5.78 | 1.8818 | -0.3909 | |||
| GE / General Electric Company | 0.02 | 3.54 | 4.02 | 33.17 | 1.8750 | 0.2722 | |||
| TFLR / T. Rowe Price Exchange-Traded Funds, Inc. - T. Rowe Price Floating Rate ETF | 0.07 | 8.13 | 3.85 | 8.95 | 1.7956 | -0.0802 | |||
| COST / Costco Wholesale Corporation | 0.00 | 18.51 | 3.70 | 24.08 | 1.7254 | 0.1421 | |||
| UBER / Uber Technologies, Inc. | 0.04 | -7.73 | 3.67 | 18.15 | 1.7148 | 0.0628 | |||
| GS / The Goldman Sachs Group, Inc. | 0.01 | 1.32 | 3.64 | 31.26 | 1.6982 | 0.2258 | |||
| TSLA / Tesla, Inc. | 0.01 | -1.58 | 3.58 | 20.63 | 1.6714 | 0.0944 | |||
| AVGO / Broadcom Inc. | 0.01 | 2.37 | 3.56 | 68.56 | 1.6628 | 0.5399 | |||
| ABBV / AbbVie Inc. | 0.02 | 6.52 | 3.30 | -5.63 | 1.5412 | -0.3176 | |||
| LLY / Eli Lilly and Company | 0.00 | 77.52 | 2.85 | 67.55 | 1.3313 | 0.4268 | |||
| JNJ / Johnson & Johnson | 0.02 | -1.15 | 2.71 | -8.94 | 1.2647 | -0.3164 | |||
| CVX / Chevron Corporation | 0.02 | 21.22 | 2.68 | 3.76 | 1.2511 | -0.1213 | |||
| MA / Mastercard Incorporated | 0.00 | 45.29 | 2.62 | 48.92 | 1.2256 | 0.2891 | |||
| ETN / Eaton Corporation plc | 0.01 | -3.93 | 2.51 | 26.15 | 1.1738 | 0.1149 | |||
| JPM / JPMorgan Chase & Co. | 0.01 | 3.74 | 2.15 | 22.62 | 1.0053 | 0.0721 | |||
| V / Visa Inc. | 0.01 | 0.51 | 2.10 | 1.84 | 0.9811 | -0.1156 | |||
| HD / The Home Depot, Inc. | 0.01 | 86.40 | 2.01 | 86.51 | 0.9364 | 0.3648 | |||
| QQQ / Invesco QQQ Trust, Series 1 | 0.00 | 1.85 | 1.97 | 19.79 | 0.9216 | 0.0461 | |||
| FSK / FS KKR Capital Corp. | 0.09 | -2.69 | 1.90 | -3.61 | 0.8858 | -0.1603 | |||
| WFC / Wells Fargo & Company | 0.02 | -2.44 | 1.88 | 8.84 | 0.8801 | -0.0400 | |||
| XOM / Exxon Mobil Corporation | 0.02 | 5.62 | 1.86 | -4.28 | 0.8680 | -0.1640 | |||
| SCHW / The Charles Schwab Corporation | 0.02 | 6.61 | 1.83 | 24.27 | 0.8563 | 0.0720 | |||
| TSM / Taiwan Semiconductor Manufacturing Company Limited - Depositary Receipt (Common Stock) | 0.01 | 3.87 | 1.80 | 41.69 | 0.8400 | 0.1654 | |||
| CRWD / CrowdStrike Holdings, Inc. | 0.00 | 3.22 | 1.78 | 49.16 | 0.8303 | 0.1965 | |||
| MSTR / Strategy Inc | 0.00 | 0.00 | 1.75 | 40.22 | 0.8173 | 0.1539 | |||
| NOC / Northrop Grumman Corporation | 0.00 | -3.22 | 1.74 | -5.47 | 0.8145 | -0.1664 | |||
| MRK / Merck & Co., Inc. | 0.02 | 5.27 | 1.63 | -7.17 | 0.7624 | -0.1723 | |||
| USB / U.S. Bancorp | 0.03 | -6.53 | 1.46 | 0.21 | 0.6822 | -0.0929 | |||
| BAC / Bank of America Corporation | 0.03 | 6.57 | 1.43 | 20.87 | 0.6657 | 0.0387 | |||
| CMCSA / Comcast Corporation | 0.04 | -9.40 | 1.41 | -12.39 | 0.6606 | -0.1975 | |||
| CEG / Constellation Energy Corporation | 0.00 | 11.22 | 1.41 | 77.96 | 0.6601 | 0.2380 | |||
| LADR / Ladder Capital Corp | 0.13 | -0.87 | 1.37 | -6.62 | 0.6393 | -0.1398 | |||
| NEE / NextEra Energy, Inc. | 0.02 | 7.89 | 1.35 | 5.64 | 0.6302 | -0.0488 | |||
| PWR / Quanta Services, Inc. | 0.00 | 0.00 | 1.33 | 48.77 | 0.6200 | 0.1456 | |||
| PEP / PepsiCo, Inc. | 0.01 | 1.92 | 1.22 | -10.27 | 0.5675 | -0.1522 | |||
| BXSL / Blackstone Secured Lending Fund | 0.04 | 0.04 | 1.21 | -4.93 | 0.5673 | -0.1119 | |||
| ORCL / Oracle Corporation | 0.01 | 24.85 | 1.21 | 95.46 | 0.5632 | 0.2349 | |||
| GEHC / GE HealthCare Technologies Inc. | 0.02 | -13.88 | 1.18 | -21.01 | 0.5500 | -0.2421 | |||
| VGT / Vanguard World Fund - Vanguard Information Technology ETF | 0.00 | 0.00 | 1.17 | 22.31 | 0.5482 | 0.0380 | |||
| EXC / Exelon Corporation | 0.03 | 3.40 | 1.16 | -2.61 | 0.5416 | -0.0911 | |||
| MU / Micron Technology, Inc. | 0.01 | 3.64 | 1.14 | 47.04 | 0.5328 | 0.1203 | |||
| KHC / The Kraft Heinz Company | 0.04 | -14.50 | 1.12 | -27.44 | 0.5237 | -0.2980 | |||
| TMO / Thermo Fisher Scientific Inc. | 0.00 | -14.78 | 1.08 | -30.56 | 0.5021 | -0.3209 | |||
| CAT / Caterpillar Inc. | 0.00 | 5.85 | 1.07 | 24.59 | 0.5019 | 0.0434 | |||
| GIS / General Mills, Inc. | 0.02 | -17.36 | 1.04 | -28.38 | 0.4867 | -0.2869 | |||
| STX / Seagate Technology Holdings plc | 0.01 | -2.08 | 1.04 | 66.56 | 0.4861 | 0.1536 | |||
| PFE / Pfizer Inc. | 0.04 | -15.09 | 1.03 | -18.77 | 0.4831 | -0.1939 | |||
| VUG / Vanguard Index Funds - Vanguard Growth ETF | 0.00 | -7.80 | 1.03 | 8.92 | 0.4795 | -0.0212 | |||
| URI / United Rentals, Inc. | 0.00 | 0.00 | 0.99 | 20.27 | 0.4602 | 0.0245 | |||
| UNP / Union Pacific Corporation | 0.00 | 0.05 | 0.98 | -2.59 | 0.4573 | -0.0769 | |||
| PG / The Procter & Gamble Company | 0.01 | 3.98 | 0.92 | -2.84 | 0.4317 | -0.0738 | |||
| NOW / ServiceNow, Inc. | 0.00 | 0.67 | 0.92 | 30.14 | 0.4316 | 0.0537 | |||
| VZ / Verizon Communications Inc. | 0.02 | 6.21 | 0.90 | 1.35 | 0.4201 | -0.0518 | |||
| ED / Consolidated Edison, Inc. | 0.01 | -2.97 | 0.88 | -11.99 | 0.4117 | -0.1205 | |||
| BX / Blackstone Inc. | 0.01 | 0.22 | 0.88 | 7.20 | 0.4103 | -0.0251 | |||
| MDLZ / Mondelez International, Inc. | 0.01 | -5.77 | 0.87 | -6.33 | 0.4079 | -0.0878 | |||
| BA / The Boeing Company | 0.00 | -0.05 | 0.86 | 22.78 | 0.4006 | 0.0293 | |||
| VCR / Vanguard World Fund - Vanguard Consumer Discretionary ETF | 0.00 | 0.00 | 0.82 | 11.34 | 0.3807 | -0.0086 | |||
| VOT / Vanguard Index Funds - Vanguard Mid-Cap Growth ETF | 0.00 | 0.00 | 0.79 | 16.20 | 0.3688 | 0.0077 | |||
| CRM / Salesforce, Inc. | 0.00 | 4.21 | 0.78 | 5.95 | 0.3658 | -0.0275 | |||
| PM / Philip Morris International Inc. | 0.00 | 6.44 | 0.78 | 22.10 | 0.3639 | 0.0248 | |||
| AXP / American Express Company | 0.00 | 0.46 | 0.76 | 19.19 | 0.3570 | 0.0158 | |||
| SBUX / Starbucks Corporation | 0.01 | -4.85 | 0.75 | -11.19 | 0.3525 | -0.0989 | |||
| HUBS / HubSpot, Inc. | 0.00 | -3.40 | 0.73 | -5.83 | 0.3396 | -0.0711 | |||
| HON / Honeywell International Inc. | 0.00 | -11.02 | 0.72 | -2.17 | 0.3380 | -0.0551 | |||
| CSCO / Cisco Systems, Inc. | 0.01 | 3.61 | 0.68 | 16.52 | 0.3197 | 0.0073 | |||
| ADBE / Adobe Inc. | 0.00 | -3.25 | 0.68 | -2.30 | 0.3176 | -0.0528 | |||
| LMT / Lockheed Martin Corporation | 0.00 | -0.49 | 0.66 | 3.27 | 0.3096 | -0.0320 | |||
| BKNG / Booking Holdings Inc. | 0.00 | -13.08 | 0.65 | 9.36 | 0.3055 | -0.0128 | |||
| HRB / H&R Block, Inc. | 0.01 | 0.00 | 0.65 | 0.00 | 0.3054 | -0.0423 | |||
| VBK / Vanguard Index Funds - Vanguard Small-Cap Growth ETF | 0.00 | 0.00 | 0.65 | 10.05 | 0.3020 | -0.0105 | |||
| OKE / ONEOK, Inc. | 0.01 | 2.57 | 0.63 | -15.69 | 0.2964 | -0.1034 | |||
| REGN / Regeneron Pharmaceuticals, Inc. | 0.00 | -55.74 | 0.62 | -63.40 | 0.2912 | -0.6135 | |||
| SPYG / SPDR Series Trust - SPDR Portfolio S&P 500 Growth ETF | 0.01 | 20.12 | 0.62 | 42.43 | 0.2902 | 0.0583 | |||
| AMGN / Amgen Inc. | 0.00 | -0.56 | 0.60 | -10.88 | 0.2795 | -0.0775 | |||
| LNG / Cheniere Energy, Inc. | 0.00 | -0.89 | 0.60 | 4.39 | 0.2780 | -0.0254 | |||
| C / Citigroup Inc. | 0.01 | 17.42 | 0.59 | 40.91 | 0.2751 | 0.0527 | |||
| GOOG / Alphabet Inc. | 0.00 | -14.48 | 0.58 | -2.87 | 0.2685 | -0.0462 | |||
| WMT / Walmart Inc. | 0.01 | 7.88 | 0.57 | 20.13 | 0.2680 | 0.0141 | |||
| SPYV / SPDR Series Trust - SPDR Portfolio S&P 500 Value ETF | 0.01 | 40.93 | 0.57 | 44.42 | 0.2659 | 0.0564 | |||
| CME / CME Group Inc. | 0.00 | -62.98 | 0.54 | -61.53 | 0.2518 | -0.4932 | |||
| UNH / UnitedHealth Group Incorporated | 0.00 | -7.15 | 0.53 | -44.68 | 0.2476 | -0.2620 | |||
| AMAT / Applied Materials, Inc. | 0.00 | -2.63 | 0.52 | 22.82 | 0.2439 | 0.0179 | |||
| VBR / Vanguard Index Funds - Vanguard Small-Cap Value ETF | 0.00 | 5.68 | 0.52 | 10.75 | 0.2407 | -0.0070 | |||
| VOE / Vanguard Index Funds - Vanguard Mid-Cap Value ETF | 0.00 | -3.71 | 0.49 | -1.40 | 0.2310 | -0.0356 | |||
| DIS / The Walt Disney Company | 0.00 | -4.36 | 0.48 | 20.25 | 0.2249 | 0.0119 | |||
| VTI / Vanguard Index Funds - Vanguard Total Stock Market ETF | 0.00 | 0.47 | 0.2177 | 0.2177 | |||||
| INTU / Intuit Inc. | 0.00 | -3.11 | 0.44 | 24.23 | 0.2063 | 0.0174 | |||
| GILD / Gilead Sciences, Inc. | 0.00 | 15.60 | 0.44 | 14.44 | 0.2037 | 0.0010 | |||
| UPS / United Parcel Service, Inc. | 0.00 | 0.43 | 0.2029 | 0.2029 | |||||
| KO / The Coca-Cola Company | 0.01 | -0.71 | 0.43 | -1.85 | 0.1987 | -0.0319 | |||
| RTX / RTX Corporation | 0.00 | -1.44 | 0.42 | 8.55 | 0.1958 | -0.0093 | |||
| IVE / iShares Trust - iShares S&P 500 Value ETF | 0.00 | 0.00 | 0.42 | 2.45 | 0.1955 | -0.0215 | |||
| COF / Capital One Financial Corporation | 0.00 | 0.42 | 0.1943 | 0.1943 | |||||
| SIMO / Silicon Motion Technology Corporation - Depositary Receipt (Common Stock) | 0.01 | 0.00 | 0.41 | 48.91 | 0.1909 | 0.0448 | |||
| VOO / Vanguard Index Funds - Vanguard S&P 500 ETF | 0.00 | 33.40 | 0.41 | 47.64 | 0.1897 | 0.0432 | |||
| PANW / Palo Alto Networks, Inc. | 0.00 | -23.55 | 0.40 | -8.28 | 0.1864 | -0.0450 | |||
| FSLR / First Solar, Inc. | 0.00 | -16.78 | 0.40 | 9.04 | 0.1860 | -0.0083 | |||
| QCOM / QUALCOMM Incorporated | 0.00 | 12.29 | 0.38 | 16.72 | 0.1794 | 0.0040 | |||
| TXT / Textron Inc. | 0.00 | -5.34 | 0.38 | 5.31 | 0.1761 | -0.0144 | |||
| ACN / Accenture plc | 0.00 | 3.40 | 0.35 | -1.12 | 0.1657 | -0.0247 | |||
| WM / Waste Management, Inc. | 0.00 | 2.86 | 0.35 | 1.73 | 0.1652 | -0.0198 | |||
| SYK / Stryker Corporation | 0.00 | -6.10 | 0.35 | -0.28 | 0.1650 | -0.0232 | |||
| AMD / Advanced Micro Devices, Inc. | 0.00 | -4.46 | 0.34 | 31.78 | 0.1592 | 0.0219 | |||
| SAIC / Science Applications International Corporation | 0.00 | 2.45 | 0.33 | 2.81 | 0.1537 | -0.0165 | |||
| MCD / McDonald's Corporation | 0.00 | 6.90 | 0.33 | 0.00 | 0.1522 | -0.0211 | |||
| APO / Apollo Global Management, Inc. | 0.00 | 0.00 | 0.32 | 3.54 | 0.1508 | -0.0149 | |||
| ISRG / Intuitive Surgical, Inc. | 0.00 | 0.86 | 0.32 | 10.73 | 0.1495 | -0.0043 | |||
| DD / DuPont de Nemours, Inc. | 0.00 | -13.72 | 0.31 | -20.77 | 0.1447 | -0.0631 | |||
| COP / ConocoPhillips | 0.00 | -7.09 | 0.30 | -20.68 | 0.1417 | -0.0614 | |||
| SPGI / S&P Global Inc. | 0.00 | 5.46 | 0.29 | 9.62 | 0.1333 | -0.0053 | |||
| KR / The Kroger Co. | 0.00 | 1.92 | 0.28 | 8.05 | 0.1317 | -0.0071 | |||
| HWM / Howmet Aerospace Inc. | 0.00 | 0.27 | 0.1274 | 0.1274 | |||||
| PPL / PPL Corporation | 0.01 | 1.00 | 0.27 | -5.24 | 0.1267 | -0.0254 | |||
| SPY / SPDR S&P 500 ETF | 0.00 | 0.25 | 0.1183 | 0.1183 | |||||
| IEUR / iShares Trust - iShares Core MSCI Europe ETF | 0.00 | 0.00 | 0.25 | 10.04 | 0.1180 | -0.0040 | |||
| LOW / Lowe's Companies, Inc. | 0.00 | 5.02 | 0.25 | 0.00 | 0.1171 | -0.0163 | |||
| HBAN / Huntington Bancshares Incorporated | 0.01 | -48.21 | 0.25 | -42.13 | 0.1168 | -0.1131 | |||
| SRE / Sempra | 0.00 | -7.57 | 0.25 | -1.97 | 0.1166 | -0.0186 | |||
| LIN / Linde plc | 0.00 | 7.31 | 0.24 | 8.07 | 0.1126 | -0.0059 | |||
| XLG / Invesco Exchange-Traded Fund Trust - Invesco S&P 500 Top 50 ETF | 0.00 | 1.16 | 0.24 | 14.29 | 0.1124 | 0.0007 | |||
| CRUS / Cirrus Logic, Inc. | 0.00 | 0.00 | 0.24 | 4.41 | 0.1110 | -0.0098 | |||
| CQP / Cheniere Energy Partners, L.P. - Limited Partnership | 0.00 | 0.00 | 0.24 | -15.05 | 0.1109 | -0.0378 | |||
| SLYG / SPDR Series Trust - SPDR S&P 600 Small Cap Growth ETF | 0.00 | 0.23 | 0.1082 | 0.1082 | |||||
| ODFL / Old Dominion Freight Line, Inc. | 0.00 | 2.61 | 0.23 | 0.88 | 0.1071 | -0.0140 | |||
| AMP / Ameriprise Financial, Inc. | 0.00 | 0.23 | 0.1059 | 0.1059 | |||||
| SPTM / SPDR Series Trust - SPDR Portfolio S&P 1500 Composite Stock Market ETF | 0.00 | 0.23 | 0.1056 | 0.1056 | |||||
| BSX / Boston Scientific Corporation | 0.00 | 0.23 | 0.1054 | 0.1054 | |||||
| KLAC / KLA Corporation | 0.00 | 0.22 | 0.1046 | 0.1046 | |||||
| MDYV / SPDR Series Trust - SPDR S&P 400 Mid Cap Value ETF | 0.00 | -1.02 | 0.21 | 1.90 | 0.1003 | -0.0116 | |||
| MDYG / SPDR Series Trust - SPDR S&P 400 Mid Cap Growth ETF | 0.00 | 0.21 | 0.0997 | 0.0997 | |||||
| ECL / Ecolab Inc. | 0.00 | -23.42 | 0.21 | -18.75 | 0.0976 | -0.0387 | |||
| XPRO / Expro Group Holdings N.V. | 0.00 | 0.21 | 0.0963 | 0.0963 | |||||
| VNQ / Vanguard Specialized Funds - Vanguard Real Estate ETF | 0.00 | 0.00 | 0.21 | -1.44 | 0.0959 | -0.0151 | |||
| NTAP / NetApp, Inc. | 0.00 | -54.49 | 0.20 | -45.01 | 0.0957 | -0.1016 | |||
| CION / CION Investment Corporation | 0.02 | -0.21 | 0.17 | -8.20 | 0.0789 | -0.0184 | |||
| ADCT / ADC Therapeutics SA | 0.01 | 0.00 | 0.03 | 92.86 | 0.0129 | 0.0052 | |||
| BMY / Bristol-Myers Squibb Company | 0.00 | -100.00 | 0.00 | 0.0000 | |||||
| DFS / Discover Financial Services | 0.00 | -100.00 | 0.00 | 0.0000 | |||||
| ELV / Elevance Health, Inc. | 0.00 | -100.00 | 0.00 | 0.0000 | |||||
| PGR / The Progressive Corporation | 0.00 | -100.00 | 0.00 | 0.0000 |