Mga Batayang Estadistika
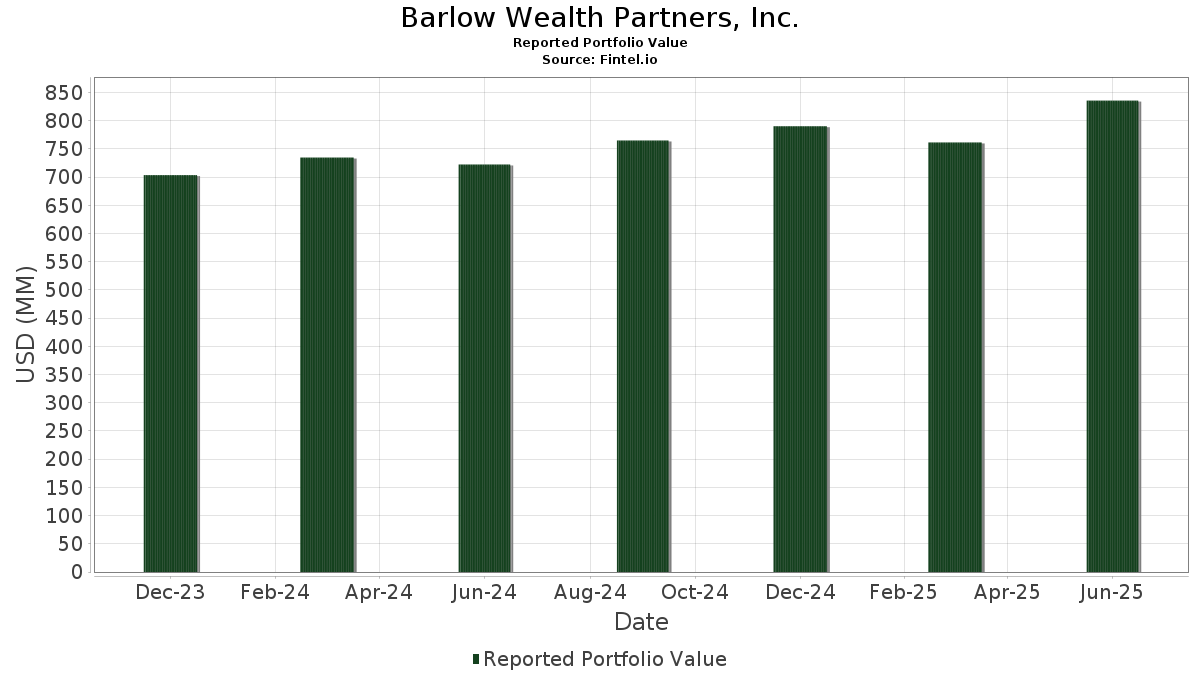
| Nilai Portofolio | $ 835,650,436 |
| Posisi Saat Ini | 134 |
Kepemilikan Terbaru, Kinerja, AUM (dari 13F, 13D)
Barlow Wealth Partners, Inc. telah mengungkapkan total kepemilikan 134 dalam pengajuan SEC terbaru mereka. Nilai portofolio terbaru dihitung sebesar $ 835,650,436 USD. Aset yang Dikelola (AUM) sebenarnya adalah nilai ini ditambah kas (yang tidak diungkapkan). Aset-aset utama Barlow Wealth Partners, Inc. adalah Microsoft Corporation (US:MSFT) , Alphabet Inc. (US:GOOG) , Houlihan Lokey, Inc. (US:HLI) , Visa Inc. (US:V) , and NVIDIA Corporation (US:NVDA) . Posisi baru Barlow Wealth Partners, Inc. meliputi: TechnipFMC plc (US:FTI) , Capital One Financial Corporation (US:COF) , The Goldman Sachs Group, Inc. (US:GS) , .
Peningkatan Tertinggi Kuartal Ini
Kami menggunakan perubahan dalam alokasi portofolio karena ini adalah metrik yang paling bermakna. Perubahan dapat disebabkan oleh perdagangan atau perubahan harga saham.
| Keamanan | Saham (MM) |
Nilai (Juta Dolar AS) |
Portfolio % | ΔPorsyento ng Portfolio |
|---|---|---|---|---|
| 0.08 | 19.03 | 2.2778 | 2.2025 | |
| 0.24 | 16.55 | 1.9802 | 1.9802 | |
| 0.38 | 13.04 | 1.5605 | 1.5605 | |
| 0.22 | 34.86 | 4.1712 | 1.4173 | |
| 0.01 | 12.55 | 1.5016 | 1.3923 | |
| 0.42 | 12.17 | 1.4566 | 1.2650 | |
| 0.03 | 24.04 | 2.8770 | 0.9340 | |
| 0.10 | 47.59 | 5.6953 | 0.7676 | |
| 0.29 | 24.47 | 2.9278 | 0.7528 | |
| 0.02 | 6.89 | 0.8244 | 0.6982 |
Penurunan Tertinggi Kuartal Ini
Kami menggunakan perubahan dalam alokasi portofolio karena ini adalah metrik yang paling bermakna. Perubahan dapat disebabkan oleh perdagangan atau perubahan harga saham.
| Keamanan | Saham (MM) |
Nilai (Juta Dolar AS) |
Portfolio % | ΔPorsyento ng Portfolio |
|---|---|---|---|---|
| 0.00 | 0.74 | 0.0885 | -2.3934 | |
| 0.03 | 8.12 | 0.9716 | -1.6378 | |
| 0.02 | 2.28 | 0.2732 | -1.3904 | |
| 0.02 | 1.79 | 0.2141 | -1.2493 | |
| 0.08 | 18.31 | 2.1913 | -0.7600 | |
| 0.12 | 25.55 | 3.0577 | -0.4916 | |
| 0.05 | 23.29 | 2.7870 | -0.4619 | |
| 0.03 | 33.12 | 3.9631 | -0.3325 | |
| 0.20 | 25.51 | 3.0526 | -0.3050 | |
| 0.11 | 20.32 | 2.4313 | -0.2038 |
Pengajuan 13F dan Dana
Formulir ini diajukan pada 2025-07-29 untuk periode pelaporan 2025-06-30. Klik ikon tautan untuk melihat riwayat transaksi selengkapnya.
Tingkatkan ke versi premium untuk membuka data premium dan ekspor ke Excel. ![]() .
.
| Keamanan | Ketik | Harga Saham Rata-rata | Saham (MM) |
ΔSaham (%) |
ΔSaham (%) |
Nilai ($MM) |
Portpolyo (%) |
ΔPortofolio (%) |
|
|---|---|---|---|---|---|---|---|---|---|
| MSFT / Microsoft Corporation | 0.10 | 1.21 | 47.59 | 26.84 | 5.6953 | 0.7676 | |||
| GOOG / Alphabet Inc. | 0.26 | 0.98 | 47.51 | 10.79 | 5.6848 | 0.0533 | |||
| HLI / Houlihan Lokey, Inc. | 0.21 | 0.87 | 37.72 | 16.19 | 4.5135 | 0.2503 | |||
| V / Visa Inc. | 0.11 | 1.41 | 37.30 | 7.17 | 4.4636 | -0.1072 | |||
| NVDA / NVIDIA Corporation | 0.22 | 17.35 | 34.86 | 66.23 | 4.1712 | 1.4173 | |||
| COST / Costco Wholesale Corporation | 0.03 | 0.71 | 33.12 | 1.25 | 3.9631 | -0.3325 | |||
| AAPL / Apple Inc. | 0.12 | -6.86 | 25.55 | -5.45 | 3.0577 | -0.4916 | |||
| TJX / The TJX Companies, Inc. | 0.20 | 0.77 | 25.51 | -0.22 | 3.0526 | -0.3050 | |||
| JPM / JPMorgan Chase & Co. | 0.09 | -1.42 | 25.04 | 18.19 | 2.9965 | 0.2140 | |||
| MLI / Mueller Industries, Inc. | 0.29 | 29.72 | 24.47 | 47.73 | 2.9278 | 0.7528 | |||
| META / Meta Platforms, Inc. | 0.03 | 24.63 | 24.04 | 62.51 | 2.8770 | 0.9340 | |||
| ASML / ASML Holding N.V. - Depositary Receipt (Common Stock) | 0.03 | 13.98 | 23.93 | 34.56 | 2.8631 | 0.5280 | |||
| VRTX / Vertex Pharmaceuticals Incorporated | 0.05 | 1.73 | 23.29 | -5.85 | 2.7870 | -0.4619 | |||
| TKO / TKO Group Holdings, Inc. | 0.13 | 0.80 | 22.56 | 13.86 | 2.7000 | 0.0976 | |||
| PNFP / Pinnacle Financial Partners, Inc. | 0.18 | 0.82 | 21.37 | 17.63 | 2.5568 | 0.1714 | |||
| CEG / Constellation Energy Corporation | 0.07 | -25.04 | 20.95 | 3.08 | 2.5065 | -0.1623 | |||
| EME / EMCOR Group, Inc. | 0.04 | 1.19 | 20.69 | 33.65 | 2.4763 | 0.4428 | |||
| RGLD / Royal Gold, Inc. | 0.11 | 1.02 | 20.32 | 1.26 | 2.4313 | -0.2038 | |||
| TSM / Taiwan Semiconductor Manufacturing Company Limited - Depositary Receipt (Common Stock) | 0.08 | 2,246.83 | 19.03 | 3,221.82 | 2.2778 | 2.2025 | |||
| WRB / W. R. Berkley Corporation | 0.26 | 0.79 | 18.48 | 1.19 | 2.2110 | -0.1869 | |||
| PAYC / Paycom Software, Inc. | 0.08 | -18.70 | 18.31 | -18.52 | 2.1913 | -0.7600 | |||
| FTNT / Fortinet, Inc. | 0.18 | 0.92 | 18.26 | 1.33 | 2.1855 | -0.1816 | |||
| NVO / Novo Nordisk A/S - Depositary Receipt (Common Stock) | 0.24 | 16.55 | 1.9802 | 1.9802 | |||||
| ACN / Accenture plc | 0.05 | 0.32 | 16.03 | 3.37 | 1.9188 | -0.1185 | |||
| GRMN / Garmin Ltd. | 0.07 | 1.24 | 15.66 | 8.58 | 1.8745 | -0.0202 | |||
| MORN / Morningstar, Inc. | 0.05 | 33.63 | 15.24 | 47.85 | 1.8234 | 0.4700 | |||
| GWW / W.W. Grainger, Inc. | 0.01 | 1.96 | 14.68 | 4.12 | 1.7570 | -0.0950 | |||
| INTU / Intuit Inc. | 0.02 | 1.12 | 13.65 | 25.36 | 1.6331 | 0.2033 | |||
| ADBE / Adobe Inc. | 0.04 | 5.79 | 13.55 | 8.89 | 1.6217 | -0.0128 | |||
| FTI / TechnipFMC plc | 0.38 | 13.04 | 1.5605 | 1.5605 | |||||
| MELI / MercadoLibre, Inc. | 0.01 | 1,257.22 | 12.55 | 1,408.17 | 1.5016 | 1.3923 | |||
| BFB / Brown-Forman Corp. - Class B | 0.42 | 887.06 | 12.17 | 734.77 | 1.4566 | 1.2650 | |||
| FICO / Fair Isaac Corporation | 0.00 | 1.67 | 8.95 | -4.03 | 1.0711 | -0.1538 | |||
| UNH / UnitedHealth Group Incorporated | 0.03 | -44.38 | 8.12 | -59.14 | 0.9716 | -1.6378 | |||
| ELV / Elevance Health, Inc. | 0.02 | 762.72 | 6.89 | 616.86 | 0.8244 | 0.6982 | |||
| SYBT / Stock Yards Bancorp, Inc. | 0.06 | 0.00 | 5.03 | 9.47 | 0.6017 | -0.0015 | |||
| JNJ / Johnson & Johnson | 0.03 | -0.52 | 3.98 | 0.13 | 0.4765 | -0.0459 | |||
| BRK.A / Berkshire Hathaway Inc. | 0.00 | 0.00 | 3.60 | -9.45 | 0.4311 | -0.0914 | |||
| BRK.B / Berkshire Hathaway Inc. | 0.01 | 3.66 | 3.54 | -6.20 | 0.4238 | -0.0720 | |||
| GOOGL / Alphabet Inc. | 0.02 | -0.23 | 3.08 | 10.05 | 0.3684 | 0.0010 | |||
| TT / Trane Technologies plc | 0.01 | 0.00 | 2.80 | 24.38 | 0.3352 | 0.0394 | |||
| AMZN / Amazon.com, Inc. | 0.01 | 0.35 | 2.76 | 16.78 | 0.3307 | 0.0199 | |||
| XOM / Exxon Mobil Corporation | 0.02 | -82.38 | 2.28 | -81.98 | 0.2732 | -1.3904 | |||
| AMGN / Amgen Inc. | 0.01 | -2.17 | 2.03 | 3.41 | 0.2431 | -0.0149 | |||
| PNC / The PNC Financial Services Group, Inc. | 0.01 | 0.13 | 2.03 | 23.69 | 0.2425 | 0.0273 | |||
| CHDN / Churchill Downs Incorporated | 0.02 | -86.48 | 1.79 | -83.95 | 0.2141 | -1.2493 | |||
| MCD / McDonald's Corporation | 0.01 | -1.16 | 1.63 | -8.07 | 0.1951 | -0.0378 | |||
| ADP / Automatic Data Processing, Inc. | 0.00 | -5.15 | 1.47 | -0.81 | 0.1755 | -0.0187 | |||
| PG / The Procter & Gamble Company | 0.01 | -1.86 | 1.43 | -1.72 | 0.1709 | -0.0200 | |||
| KR / The Kroger Co. | 0.02 | -5.08 | 1.31 | -4.72 | 0.1571 | -0.0239 | |||
| SPGI / S&P Global Inc. | 0.00 | -5.89 | 1.20 | 3.09 | 0.1437 | -0.0093 | |||
| ITW / Illinois Tool Works Inc. | 0.00 | -4.30 | 1.18 | 2.52 | 0.1414 | -0.0100 | |||
| IVV / iShares Trust - iShares Core S&P 500 ETF | 0.00 | 14.60 | 1.16 | 29.21 | 0.1388 | 0.0208 | |||
| ALL / The Allstate Corporation | 0.01 | 0.00 | 1.15 | 0.97 | 0.1370 | -0.0120 | |||
| KO / The Coca-Cola Company | 0.02 | 1.20 | 1.12 | -0.18 | 0.1336 | -0.0133 | |||
| SYK / Stryker Corporation | 0.00 | -5.78 | 1.05 | 1.15 | 0.1262 | -0.0107 | |||
| FSLR / First Solar, Inc. | 0.01 | -12.95 | 1.03 | 4.67 | 0.1235 | -0.0060 | |||
| TRMK / Trustmark Corporation | 0.03 | 0.00 | 1.03 | 14.53 | 0.1227 | 0.0050 | |||
| SPY / SPDR S&P 500 ETF | 0.00 | 0.07 | 0.91 | 12.69 | 0.1085 | 0.0029 | |||
| AMAT / Applied Materials, Inc. | 0.00 | 0.00 | 0.89 | 25.39 | 0.1070 | 0.0133 | |||
| CVX / Chevron Corporation | 0.01 | -2.40 | 0.86 | 4.12 | 0.1030 | -0.0056 | |||
| VT / Vanguard International Equity Index Funds - Vanguard Total World Stock ETF | 0.01 | 0.00 | 0.84 | 11.52 | 0.1008 | 0.0016 | |||
| HON / Honeywell International Inc. | 0.00 | 0.00 | 0.78 | 20.09 | 0.0930 | 0.0080 | |||
| MS / Morgan Stanley | 0.01 | -1.83 | 0.77 | 21.01 | 0.0917 | 0.0085 | |||
| LLY / Eli Lilly and Company | 0.00 | -95.56 | 0.74 | -96.09 | 0.0885 | -2.3934 | |||
| MRK / Merck & Co., Inc. | 0.01 | 0.00 | 0.71 | -0.42 | 0.0849 | -0.0087 | |||
| VTI / Vanguard Index Funds - Vanguard Total Stock Market ETF | 0.00 | 0.00 | 0.70 | 12.88 | 0.0840 | 0.0023 | |||
| ABBV / AbbVie Inc. | 0.00 | 2.86 | 0.69 | 5.38 | 0.0822 | -0.0033 | |||
| NFLX / Netflix, Inc. | 0.00 | -4.09 | 0.66 | 11.82 | 0.0793 | 0.0015 | |||
| MA / Mastercard Incorporated | 0.00 | 0.17 | 0.65 | 5.49 | 0.0782 | -0.0032 | |||
| HUM / Humana Inc. | 0.00 | -4.88 | 0.63 | -12.36 | 0.0756 | -0.0190 | |||
| ORLY / O'Reilly Automotive, Inc. | 0.01 | 1,400.00 | 0.62 | -0.48 | 0.0747 | -0.0077 | |||
| CL / Colgate-Palmolive Company | 0.01 | 0.00 | 0.62 | -1.59 | 0.0740 | -0.0085 | |||
| NEE / NextEra Energy, Inc. | 0.01 | 0.00 | 0.61 | 10.47 | 0.0733 | 0.0005 | |||
| GD / General Dynamics Corporation | 0.00 | 0.00 | 0.59 | 7.92 | 0.0702 | -0.0011 | |||
| PM / Philip Morris International Inc. | 0.00 | 0.00 | 0.53 | 3.33 | 0.0632 | -0.0039 | |||
| AZO / AutoZone, Inc. | 0.00 | 0.00 | 0.52 | 2.15 | 0.0626 | -0.0047 | |||
| GLD / SPDR Gold Trust | 0.00 | 0.54 | 0.52 | 1.96 | 0.0623 | -0.0047 | |||
| QQQ / Invesco QQQ Trust, Series 1 | 0.00 | 0.00 | 0.52 | 16.37 | 0.0622 | 0.0036 | |||
| SHOP / Shopify Inc. | 0.00 | 0.00 | 0.51 | 18.18 | 0.0608 | 0.0043 | |||
| WMT / Walmart Inc. | 0.00 | 1.98 | 0.49 | 4.73 | 0.0583 | -0.0028 | |||
| BFA / Brown-Forman Corp. - Class A | 0.02 | 0.00 | 0.47 | -13.41 | 0.0557 | -0.0149 | |||
| VIVA.X / Vanguard Index Funds - Vanguard Value ETF | 0.00 | 0.00 | 0.46 | 8.57 | 0.0546 | -0.0006 | |||
| SCHG / Schwab Strategic Trust - Schwab U.S. Large-Cap Growth ETF | 0.02 | 0.00 | 0.45 | 15.31 | 0.0542 | 0.0026 | |||
| DIS / The Walt Disney Company | 0.00 | 0.80 | 0.45 | 37.31 | 0.0538 | 0.0108 | |||
| CINF / Cincinnati Financial Corporation | 0.00 | 0.00 | 0.43 | 9.34 | 0.0518 | -0.0002 | |||
| COF / Capital One Financial Corporation | 0.00 | 0.43 | 0.0517 | 0.0517 | |||||
| DOV / Dover Corporation | 0.00 | 0.00 | 0.39 | 11.46 | 0.0466 | 0.0007 | |||
| LMT / Lockheed Martin Corporation | 0.00 | 0.00 | 0.38 | -3.33 | 0.0452 | -0.0060 | |||
| PEP / PepsiCo, Inc. | 0.00 | -3.31 | 0.37 | -1.07 | 0.0444 | -0.0048 | |||
| COR / Cencora, Inc. | 0.00 | -5.30 | 0.37 | -3.40 | 0.0442 | -0.0061 | |||
| BLK / BlackRock, Inc. | 0.00 | 0.00 | 0.36 | 17.92 | 0.0434 | 0.0030 | |||
| AVGE / American Century ETF Trust - Avantis All Equity Markets ETF | 0.00 | 0.00 | 0.35 | 11.82 | 0.0419 | 0.0007 | |||
| VV / Vanguard Index Funds - Vanguard Large-Cap ETF | 0.00 | 0.00 | 0.35 | 12.94 | 0.0418 | 0.0012 | |||
| DE / Deere & Company | 0.00 | 0.00 | 0.34 | 13.16 | 0.0413 | 0.0013 | |||
| CAT / Caterpillar Inc. | 0.00 | 0.00 | 0.33 | 30.08 | 0.0399 | 0.0062 | |||
| GPC / Genuine Parts Company | 0.00 | 0.00 | 0.33 | 9.21 | 0.0398 | -0.0002 | |||
| ORCL / Oracle Corporation | 0.00 | 0.33 | 0.0392 | 0.0392 | |||||
| USB / U.S. Bancorp | 0.01 | 0.00 | 0.32 | 19.03 | 0.0383 | 0.0030 | |||
| MDLZ / Mondelez International, Inc. | 0.00 | -12.67 | 0.32 | -7.27 | 0.0382 | -0.0071 | |||
| VBR / Vanguard Index Funds - Vanguard Small-Cap Value ETF | 0.00 | 6.22 | 0.32 | 19.32 | 0.0377 | 0.0029 | |||
| TXN / Texas Instruments Incorporated | 0.00 | 0.21 | 0.31 | 32.91 | 0.0373 | 0.0064 | |||
| APD / Air Products and Chemicals, Inc. | 0.00 | 0.00 | 0.31 | 8.83 | 0.0369 | -0.0004 | |||
| AVGO / Broadcom Inc. | 0.00 | 6.15 | 0.30 | 48.50 | 0.0357 | 0.0094 | |||
| AXP / American Express Company | 0.00 | 0.00 | 0.29 | 22.78 | 0.0349 | 0.0038 | |||
| FTEC / Fidelity Covington Trust - Fidelity MSCI Information Technology Index ETF | 0.00 | 0.00 | 0.29 | 21.52 | 0.0345 | 0.0034 | |||
| TSLA / Tesla, Inc. | 0.00 | 0.00 | 0.29 | 10.81 | 0.0344 | 0.0003 | |||
| MO / Altria Group, Inc. | 0.00 | -7.71 | 0.28 | -6.35 | 0.0336 | -0.0057 | |||
| ONB / Old National Bancorp | 0.01 | 0.00 | 0.28 | 7.81 | 0.0331 | -0.0005 | |||
| FNB / F.N.B. Corporation | 0.02 | 0.87 | 0.27 | 16.24 | 0.0326 | 0.0019 | |||
| CB / Chubb Limited | 0.00 | 2.45 | 0.27 | 2.68 | 0.0322 | -0.0022 | |||
| VEU / Vanguard International Equity Index Funds - Vanguard FTSE All-World ex-US ETF | 0.00 | 0.00 | 0.27 | 8.98 | 0.0321 | -0.0002 | |||
| CRWD / CrowdStrike Holdings, Inc. | 0.00 | 0.00 | 0.27 | 16.67 | 0.0319 | 0.0019 | |||
| WPC / W. P. Carey Inc. | 0.00 | -16.70 | 0.27 | -13.07 | 0.0319 | -0.0083 | |||
| RBCAA / Republic Bancorp, Inc. | 0.00 | -11.42 | 0.27 | 0.38 | 0.0318 | -0.0029 | |||
| UPS / United Parcel Service, Inc. | 0.00 | 0.26 | 0.0316 | 0.0316 | |||||
| HD / The Home Depot, Inc. | 0.00 | 0.00 | 0.25 | 3.75 | 0.0299 | -0.0017 | |||
| MDT / Medtronic plc | 0.00 | 0.00 | 0.25 | 5.06 | 0.0299 | -0.0014 | |||
| IBM / International Business Machines Corporation | 0.00 | -20.25 | 0.24 | -1.23 | 0.0289 | -0.0032 | |||
| SO / The Southern Company | 0.00 | -1.24 | 0.24 | -0.42 | 0.0286 | -0.0029 | |||
| ABT / Abbott Laboratories | 0.00 | -17.76 | 0.24 | -14.18 | 0.0282 | -0.0080 | |||
| KMB / Kimberly-Clark Corporation | 0.00 | 0.00 | 0.23 | 0.43 | 0.0277 | -0.0025 | |||
| MKC / McCormick & Company, Incorporated | 0.00 | 0.00 | 0.23 | 2.74 | 0.0270 | -0.0019 | |||
| LOW / Lowe's Companies, Inc. | 0.00 | 0.00 | 0.23 | 2.74 | 0.0270 | -0.0018 | |||
| FCAP / First Capital, Inc. | 0.01 | 0.00 | 0.22 | -12.89 | 0.0267 | -0.0069 | |||
| STZ / Constellation Brands, Inc. | 0.00 | 0.00 | 0.22 | -6.03 | 0.0262 | -0.0044 | |||
| QCOM / QUALCOMM Incorporated | 0.00 | -1.85 | 0.22 | 7.50 | 0.0257 | -0.0006 | |||
| TSCO / Tractor Supply Company | 0.00 | 0.22 | 0.0257 | 0.0257 | |||||
| PECO / Phillips Edison & Company, Inc. | 0.01 | 0.88 | 0.21 | 0.95 | 0.0255 | -0.0023 | |||
| SHEL / Shell plc - Depositary Receipt (Common Stock) | 0.00 | -9.84 | 0.21 | -0.93 | 0.0255 | -0.0028 | |||
| WAT / Waters Corporation | 0.00 | -14.29 | 0.21 | -10.59 | 0.0253 | -0.0058 | |||
| HWC / Hancock Whitney Corporation | 0.00 | 0.21 | 0.0250 | 0.0250 | |||||
| GS / The Goldman Sachs Group, Inc. | 0.00 | 0.20 | 0.0245 | 0.0245 | |||||
| SYPR / Sypris Solutions, Inc. | 0.03 | 0.00 | 0.05 | 23.81 | 0.0063 | 0.0007 | |||
| LULU / lululemon athletica inc. | 0.00 | -100.00 | 0.00 | 0.0000 | |||||
| DFS / Discover Financial Services | 0.00 | -100.00 | 0.00 | 0.0000 | |||||
| HSY / The Hershey Company | 0.00 | -100.00 | 0.00 | 0.0000 | |||||
| NOW / ServiceNow, Inc. | 0.00 | -100.00 | 0.00 | 0.0000 | |||||
| SCHF / Schwab Strategic Trust - Schwab International Equity ETF | 0.00 | -100.00 | 0.00 | 0.0000 | |||||
| PYPL / PayPal Holdings, Inc. | 0.00 | -100.00 | 0.00 | 0.0000 | |||||
| CMI / Cummins Inc. | 0.00 | -100.00 | 0.00 | 0.0000 | |||||
| DECK / Deckers Outdoor Corporation | 0.00 | -100.00 | 0.00 | 0.0000 |