Mga Batayang Estadistika
| Nilai Portofolio | $ 28,784,000 |
| Posisi Saat Ini | 30 |
Kepemilikan Terbaru, Kinerja, AUM (dari 13F, 13D)
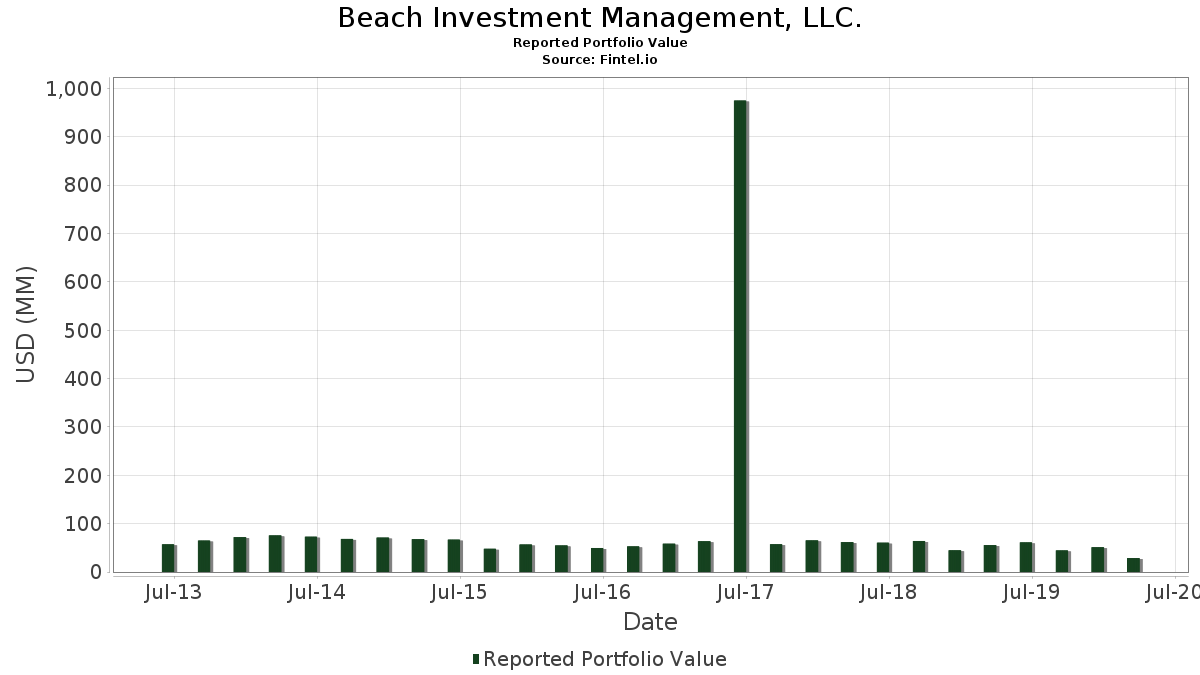
Beach Investment Management, LLC. telah mengungkapkan total kepemilikan 30 dalam pengajuan SEC terbaru mereka. Nilai portofolio terbaru dihitung sebesar $ 28,784,000 USD. Aset yang Dikelola (AUM) sebenarnya adalah nilai ini ditambah kas (yang tidak diungkapkan). Aset-aset utama Beach Investment Management, LLC. adalah XPLR Infrastructure, LP - Limited Partnership (US:NEP) , Visa Inc. (US:V) , Enterprise Products Partners L.P. - Limited Partnership (US:EPD) , Magellan Midstream Partners L.P. (US:MMP) , and Microsoft Corporation (US:MSFT) . Posisi baru Beach Investment Management, LLC. meliputi: Xcel Energy Inc. (US:XEL) , Uber Technologies, Inc. (US:UBER) , .
Peningkatan Tertinggi Kuartal Ini
Kami menggunakan perubahan dalam alokasi portofolio karena ini adalah metrik yang paling bermakna. Perubahan dapat disebabkan oleh perdagangan atau perubahan harga saham.
| Keamanan | Saham (MM) |
Nilai (Juta Dolar AS) |
Portfolio % | ΔPorsyento ng Portfolio |
|---|---|---|---|---|
| 0.11 | 4.60 | 15.9672 | 4.9853 | |
| 0.01 | 2.34 | 8.1191 | 2.5882 | |
| 0.01 | 0.62 | 2.1679 | 2.1679 | |
| 0.00 | 0.61 | 2.1123 | 2.1123 | |
| 0.00 | 1.32 | 4.5998 | 2.0529 | |
| 0.01 | 0.43 | 1.5113 | 1.5113 | |
| 0.00 | 0.42 | 1.4557 | 1.4557 | |
| 0.01 | 1.42 | 4.9437 | 1.4386 | |
| 0.01 | 0.89 | 3.0955 | 1.2687 | |
| 0.01 | 0.35 | 1.2055 | 1.2055 |
Penurunan Tertinggi Kuartal Ini
Kami menggunakan perubahan dalam alokasi portofolio karena ini adalah metrik yang paling bermakna. Perubahan dapat disebabkan oleh perdagangan atau perubahan harga saham.
| Keamanan | Saham (MM) |
Nilai (Juta Dolar AS) |
Portfolio % | ΔPorsyento ng Portfolio |
|---|---|---|---|---|
| 0.00 | 0.00 | -5.3690 | ||
| 0.00 | 0.00 | -2.9255 | ||
| 0.29 | 1.34 | 4.6623 | -2.6407 | |
| 0.00 | 0.00 | -2.3732 | ||
| 0.00 | 0.20 | 0.7053 | -1.3967 | |
| 0.00 | 0.00 | -1.3037 | ||
| 0.00 | 0.00 | -1.2159 | ||
| 0.00 | 0.00 | -1.0734 | ||
| 0.01 | 0.89 | 3.0816 | -1.0403 | |
| 0.16 | 2.27 | 7.8829 | -0.8351 |
Pengajuan 13F dan Dana
Formulir ini diajukan pada 2020-05-05 untuk periode pelaporan 2020-03-31. Klik ikon tautan untuk melihat riwayat transaksi selengkapnya.
Tingkatkan ke versi premium untuk membuka data premium dan ekspor ke Excel. ![]() .
.
| Keamanan | Ketik | Harga Saham Rata-rata | Saham (MM) |
ΔSaham (%) |
ΔSaham (%) |
Nilai ($MM) |
Portpolyo (%) |
ΔPortofolio (%) |
|
|---|---|---|---|---|---|---|---|---|---|
| NEP / XPLR Infrastructure, LP - Limited Partnership | 0.11 | 0.00 | 4.60 | -18.32 | 15.9672 | 4.9853 | |||
| V / Visa Inc. | 0.01 | -3.81 | 2.34 | -17.54 | 8.1191 | 2.5882 | |||
| EPD / Enterprise Products Partners L.P. - Limited Partnership | 0.16 | 0.00 | 2.27 | -49.21 | 7.8829 | -0.8351 | |||
| MMP / Magellan Midstream Partners L.P. | 0.05 | 0.00 | 1.76 | -41.98 | 6.1180 | 0.1948 | |||
| MSFT / Microsoft Corporation | 0.01 | -20.79 | 1.42 | -20.77 | 4.9437 | 1.4386 | |||
| 30064K105 / Exacttarget, Inc. | 0.29 | 0.00 | 1.34 | -64.14 | 4.6623 | -2.6407 | |||
| AMZN / Amazon.com, Inc. | 0.00 | -3.82 | 1.32 | 1.46 | 4.5998 | 2.0529 | |||
| JNJ / Johnson & Johnson | 0.01 | -16.04 | 1.12 | -24.48 | 3.8911 | 0.9968 | |||
| ABT / Abbott Laboratories | 0.01 | -16.88 | 1.09 | -24.50 | 3.7903 | 0.9702 | |||
| TGP / Teekay LNG Partners LP - Unit | 0.09 | 0.00 | 0.92 | -37.07 | 3.1788 | 0.3412 | |||
| NSRGY / Nestlé S.A. - Depositary Receipt (Common Stock) | 0.01 | 0.00 | 0.89 | -4.81 | 3.0955 | 1.2687 | |||
| META / Meta Platforms, Inc. | 0.01 | -48.31 | 0.89 | -58.00 | 3.0816 | -1.0403 | |||
| GOOGL / Alphabet Inc. | 0.00 | -46.40 | 0.87 | -53.49 | 3.0086 | -0.6253 | |||
| VST / Vistra Corp. | 0.04 | 13.86 | 0.68 | -21.03 | 2.3485 | 0.6779 | |||
| MDT / Medtronic plc | 0.01 | -21.57 | 0.65 | -37.60 | 2.2547 | 0.2250 | |||
| XEL / Xcel Energy Inc. | 0.01 | 0.62 | 2.1679 | 2.1679 | |||||
| UNH / UnitedHealth Group Incorporated | 0.00 | 0.61 | 2.1123 | 2.1123 | |||||
| NRG / NRG Energy, Inc. | 0.02 | -18.85 | 0.60 | -44.38 | 2.0984 | -0.0211 | |||
| JPM / JPMorgan Chase & Co. | 0.01 | -14.91 | 0.59 | -45.10 | 2.0636 | -0.0480 | |||
| KO / The Coca-Cola Company | 0.01 | 25.92 | 0.56 | 0.73 | 1.9282 | 0.8528 | |||
| BDX / Becton, Dickinson and Company | 0.00 | 7.14 | 0.50 | -9.42 | 1.7371 | 0.6598 | |||
| BRK.B / Berkshire Hathaway Inc. | 0.00 | -47.18 | 0.46 | -57.34 | 1.5842 | -0.5021 | |||
| LBRDA / Liberty Broadband Corporation | 0.00 | -21.29 | 0.45 | -29.22 | 1.5738 | 0.3247 | |||
| TMUS / T-Mobile US, Inc. | 0.01 | -23.22 | 0.43 | -17.92 | 1.5113 | 1.5113 | |||
| SYK / Stryker Corporation | 0.00 | 0.42 | 1.4557 | 1.4557 | |||||
| BAC / Bank of America Corporation | 0.02 | -16.38 | 0.39 | -49.62 | 1.3688 | -0.1574 | |||
| UBER / Uber Technologies, Inc. | 0.01 | 0.35 | 1.2055 | 1.2055 | |||||
| MET / MetLife, Inc. | 0.01 | -22.33 | 0.24 | -53.45 | 0.8442 | -0.1745 | |||
| C / Citigroup Inc. | 0.00 | -64.33 | 0.20 | -81.15 | 0.7053 | -1.3967 | |||
| DHI / D.R. Horton, Inc. | 0.01 | 0.00 | 0.20 | -35.46 | 0.7018 | 0.0909 | |||
| AL / Air Lease Corporation | 0.00 | -100.00 | 0.00 | -100.00 | -0.7533 | ||||
| FTAI / FTAI Aviation Ltd. | 0.00 | -100.00 | 0.00 | -100.00 | -1.2159 | ||||
| NEE / NextEra Energy, Inc. | 0.00 | -100.00 | 0.00 | -100.00 | -2.9255 | ||||
| DAL / Delta Air Lines, Inc. | 0.00 | -100.00 | 0.00 | -100.00 | -0.7026 | ||||
| DIS / The Walt Disney Company | 0.00 | -100.00 | 0.00 | -100.00 | -1.0734 | ||||
| T / AT&T Inc. | 0.00 | -100.00 | 0.00 | -100.00 | -0.7689 | ||||
| AAPL / Apple Inc. | 0.00 | -100.00 | 0.00 | -100.00 | -2.3732 | ||||
| JBHT / J.B. Hunt Transport Services, Inc. | 0.00 | -100.00 | 0.00 | -100.00 | -0.4938 | ||||
| PHM / PulteGroup, Inc. | 0.00 | -100.00 | 0.00 | -100.00 | -0.6655 | ||||
| CW / Curtiss-Wright Corporation | 0.00 | -100.00 | 0.00 | -100.00 | -1.3037 | ||||
| PEGI / Pattern Energy Group Inc. | 0.00 | -100.00 | 0.00 | -100.00 | -5.3690 |