Mga Batayang Estadistika
| Nilai Portofolio | $ 303,379 |
| Posisi Saat Ini | 55 |
Kepemilikan Terbaru, Kinerja, AUM (dari 13F, 13D)
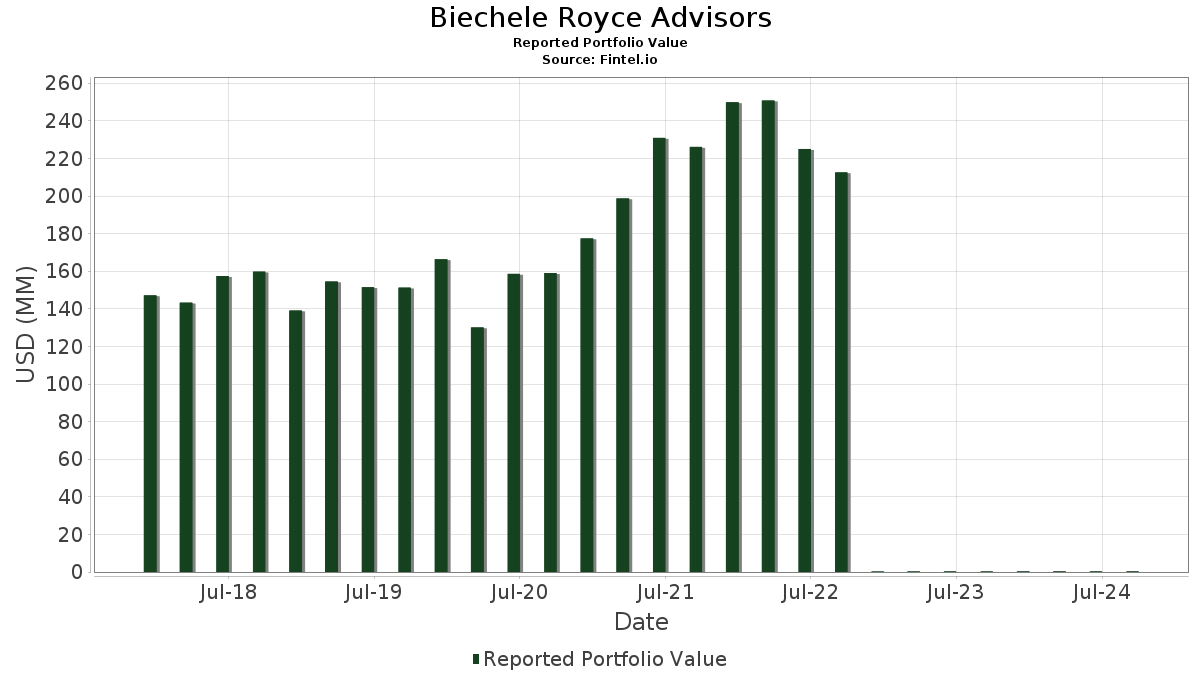
Biechele Royce Advisors telah mengungkapkan total kepemilikan 55 dalam pengajuan SEC terbaru mereka. Nilai portofolio terbaru dihitung sebesar $ 303,379 USD. Aset yang Dikelola (AUM) sebenarnya adalah nilai ini ditambah kas (yang tidak diungkapkan). Aset-aset utama Biechele Royce Advisors adalah Apple Inc. (US:AAPL) , The Bank of New York Mellon Corporation (US:BK) , Applied Materials, Inc. (US:AMAT) , Amgen Inc. (US:AMGN) , and Medtronic plc (US:MDT) . Posisi baru Biechele Royce Advisors meliputi: Reddit, Inc. (US:RDDT) , .
Peningkatan Tertinggi Kuartal Ini
Kami menggunakan perubahan dalam alokasi portofolio karena ini adalah metrik yang paling bermakna. Perubahan dapat disebabkan oleh perdagangan atau perubahan harga saham.
| Keamanan | Saham (MM) |
Nilai (Juta Dolar AS) |
Portfolio % | ΔPorsyento ng Portfolio |
|---|---|---|---|---|
| 0.02 | 0.01 | 2.0974 | 1.9876 | |
| 0.33 | 0.02 | 7.8404 | 1.0174 | |
| 0.20 | 0.02 | 5.8686 | 0.8150 | |
| 0.46 | 0.02 | 5.5198 | 0.7162 | |
| 0.03 | 0.00 | 0.5782 | 0.5782 | |
| 0.11 | 0.03 | 8.7745 | 0.5023 | |
| 0.23 | 0.02 | 5.1984 | 0.4451 | |
| 0.07 | 0.01 | 2.3525 | 0.3511 | |
| 0.11 | 0.01 | 4.9077 | 0.2493 | |
| 0.04 | 0.00 | 1.0442 | 0.2335 |
Penurunan Tertinggi Kuartal Ini
Kami menggunakan perubahan dalam alokasi portofolio karena ini adalah metrik yang paling bermakna. Perubahan dapat disebabkan oleh perdagangan atau perubahan harga saham.
| Keamanan | Saham (MM) |
Nilai (Juta Dolar AS) |
Portfolio % | ΔPorsyento ng Portfolio |
|---|---|---|---|---|
| 0.00 | 0.00 | -2.6510 | ||
| 0.12 | 0.02 | 7.7672 | -1.9266 | |
| 0.08 | 0.01 | 2.4586 | -1.2618 | |
| 0.23 | 0.01 | 1.7829 | -0.6571 | |
| 0.21 | 0.01 | 4.4973 | -0.2668 | |
| 0.05 | 0.01 | 2.2612 | -0.2305 | |
| 0.10 | 0.00 | 1.3185 | -0.2068 | |
| 0.06 | 0.02 | 6.8874 | -0.1891 | |
| 0.01 | 0.01 | 2.2849 | -0.1071 | |
| 0.00 | 0.00 | 0.3026 | -0.0867 |
Pengajuan 13F dan Dana
Formulir ini diajukan pada 2024-10-29 untuk periode pelaporan 2024-09-30. Klik ikon tautan untuk melihat riwayat transaksi selengkapnya.
Tingkatkan ke versi premium untuk membuka data premium dan ekspor ke Excel. ![]() .
.
| Keamanan | Ketik | Harga Saham Rata-rata | Saham (MM) |
ΔSaham (%) |
ΔSaham (%) |
Nilai ($MM) |
Portpolyo (%) |
ΔPortofolio (%) |
|
|---|---|---|---|---|---|---|---|---|---|
| AAPL / Apple Inc. | 0.11 | -1.77 | 0.03 | 8.33 | 8.7745 | 0.5023 | |||
| BK / The Bank of New York Mellon Corporation | 0.33 | -1.89 | 0.02 | 15.00 | 7.8404 | 1.0174 | |||
| AMAT / Applied Materials, Inc. | 0.12 | -4.13 | 0.02 | -17.86 | 7.7672 | -1.9266 | |||
| AMGN / Amgen Inc. | 0.06 | -3.32 | 0.02 | 0.00 | 6.8874 | -0.1891 | |||
| MDT / Medtronic plc | 0.20 | 4.00 | 0.02 | 21.43 | 5.8686 | 0.8150 | |||
| CVS / CVS Health Corporation | 0.27 | -1.07 | 0.02 | 6.25 | 5.6253 | 0.1541 | |||
| BWA / BorgWarner Inc. | 0.46 | 4.58 | 0.02 | 14.29 | 5.5198 | 0.7162 | |||
| RHI / Robert Half Inc. | 0.23 | 6.33 | 0.02 | 7.14 | 5.1984 | 0.4451 | |||
| UPS / United Parcel Service, Inc. | 0.11 | 8.33 | 0.01 | 7.69 | 4.9077 | 0.2493 | |||
| SLV / iShares Silver Trust | 0.48 | -1.71 | 0.01 | 0.00 | 4.5059 | 0.1139 | |||
| SCHW / The Charles Schwab Corporation | 0.21 | 9.96 | 0.01 | -7.14 | 4.4973 | -0.2668 | |||
| ON / ON Semiconductor Corporation | 0.15 | -1.43 | 0.01 | 0.00 | 3.6077 | 0.0683 | |||
| PNR / Pentair plc | 0.08 | -46.93 | 0.01 | -36.36 | 2.4586 | -1.2618 | |||
| DE / Deere & Company | 0.02 | 1.48 | 0.01 | 16.67 | 2.4092 | 0.2319 | |||
| CAT / Caterpillar Inc. | 0.02 | -4.77 | 0.01 | 16.67 | 2.3604 | 0.1977 | |||
| ZBH / Zimmer Biomet Holdings, Inc. | 0.07 | 21.05 | 0.01 | 40.00 | 2.3525 | 0.3511 | |||
| LLY / Eli Lilly and Company | 0.01 | 0.00 | 0.01 | -14.29 | 2.2849 | -0.1071 | |||
| NUE / Nucor Corporation | 0.05 | -2.25 | 0.01 | -14.29 | 2.2612 | -0.2305 | |||
| V / Visa Inc. | 0.02 | 1,770.74 | 0.01 | 2.0974 | 1.9876 | ||||
| INTC / Intel Corporation | 0.23 | -1.19 | 0.01 | -28.57 | 1.7829 | -0.6571 | |||
| SLB / Schlumberger Limited | 0.10 | -0.43 | 0.00 | 0.00 | 1.3185 | -0.2068 | |||
| K / Kellanova | 0.04 | -5.70 | 0.00 | 50.00 | 1.0442 | 0.2335 | |||
| T / AT&T Inc. | 0.12 | -5.94 | 0.00 | 0.00 | 0.8913 | 0.0481 | |||
| WBD / Warner Bros. Discovery, Inc. | 0.32 | -2.22 | 0.00 | 0.00 | 0.8587 | 0.0476 | |||
| AVY / Avery Dennison Corporation | 0.01 | -4.62 | 0.00 | 0.00 | 0.6269 | -0.0400 | |||
| RDDT / Reddit, Inc. | 0.03 | 0.00 | 0.5782 | 0.5782 | |||||
| MSFT / Microsoft Corporation | 0.00 | -3.06 | 0.00 | 0.00 | 0.5215 | -0.0509 | |||
| GJR / Strats Trust For Procter & Gambel Security - Preferred Security | 0.01 | -1.03 | 0.00 | 0.00 | 0.4954 | 0.0072 | |||
| BRK.A / Berkshire Hathaway Inc. | 0.00 | 0.99 | 0.00 | 0.00 | 0.4499 | 0.0468 | |||
| AMZN / Amazon.com, Inc. | 0.01 | 3.04 | 0.00 | 0.00 | 0.3560 | -0.0111 | |||
| IVV / iShares Trust - iShares Core S&P 500 ETF | 0.00 | -24.44 | 0.00 | -100.00 | 0.3026 | -0.0867 | |||
| ABNB / Airbnb, Inc. | 0.01 | 0.00 | 0.00 | -100.00 | 0.2947 | -0.0663 | |||
| GOOGL / Alphabet Inc. | 0.01 | 0.19 | 0.00 | 0.2831 | -0.0346 | ||||
| NVDA / NVIDIA Corporation | 0.01 | -1.68 | 0.00 | 0.2769 | -0.0166 | ||||
| UTG / Reaves Utility Income Fund | 0.02 | 0.00 | 0.00 | 0.2634 | 0.0388 | ||||
| GTLB / GitLab Inc. | 0.01 | 0.00 | 0.00 | 0.2410 | 0.0026 | ||||
| JEPI / J.P. Morgan Exchange-Traded Fund Trust - JPMorgan Equity Premium Income ETF | 0.01 | 4.32 | 0.00 | 0.2110 | 0.0138 | ||||
| WY / Weyerhaeuser Company | 0.02 | -5.09 | 0.00 | 0.1820 | 0.0175 | ||||
| WMT / Walmart Inc. | 0.01 | 0.32 | 0.00 | 0.1780 | 0.0257 | ||||
| VTI / Vanguard Index Funds - Vanguard Total Stock Market ETF | 0.00 | 0.80 | 0.00 | 0.1773 | 0.0072 | ||||
| HD / The Home Depot, Inc. | 0.00 | -0.09 | 0.00 | 0.1447 | 0.0184 | ||||
| META / Meta Platforms, Inc. | 0.00 | -5.51 | 0.00 | 0.1262 | 0.0057 | ||||
| GOOG / Alphabet Inc. | 0.00 | 0.00 | 0.00 | 0.1246 | -0.0152 | ||||
| COST / Costco Wholesale Corporation | 0.00 | -6.42 | 0.00 | 0.1108 | -0.0054 | ||||
| TJX / The TJX Companies, Inc. | 0.00 | 0.00 | 0.00 | 0.1058 | 0.0045 | ||||
| NSC / Norfolk Southern Corporation | 0.00 | 0.00 | 0.00 | 0.0992 | 0.0114 | ||||
| VWO / Vanguard International Equity Index Funds - Vanguard FTSE Emerging Markets ETF | 0.01 | -8.00 | 0.00 | 0.0959 | -0.0017 | ||||
| RTX / RTX Corporation | 0.00 | -11.91 | 0.00 | 0.0903 | 0.0032 | ||||
| PEP / PepsiCo, Inc. | 0.00 | -4.31 | 0.00 | 0.0897 | -0.0032 | ||||
| SRE / Sempra | 0.00 | 0.00 | 0.00 | 0.0864 | 0.0060 | ||||
| VIG / Vanguard Specialized Funds - Vanguard Dividend Appreciation ETF | 0.00 | -3.93 | 0.00 | 0.0781 | 0.0011 | ||||
| DBX / Dropbox, Inc. | 0.01 | 0.00 | 0.00 | 0.0768 | 0.0072 | ||||
| JNJ / Johnson & Johnson | 0.00 | -0.14 | 0.00 | 0.0742 | 0.0053 | ||||
| PDO / Pimco Dynamic Income Opportunities Fund | 0.02 | 0.00 | 0.00 | 0.0715 | 0.0023 | ||||
| OBDC / Blue Owl Capital Corporation | 0.01 | -6.60 | 0.00 | 0.0679 | -0.0108 | ||||
| BEN / Franklin Resources, Inc. | 0.00 | -100.00 | 0.00 | -100.00 | -2.6510 | ||||
| FSK / FS KKR Capital Corp. | 0.00 | -100.00 | 0.00 | 0.0000 | |||||
| SPH / Suburban Propane Partners, L.P. - Limited Partnership | 0.00 | -100.00 | 0.00 | 0.0000 | -0.0712 |