Mga Batayang Estadistika
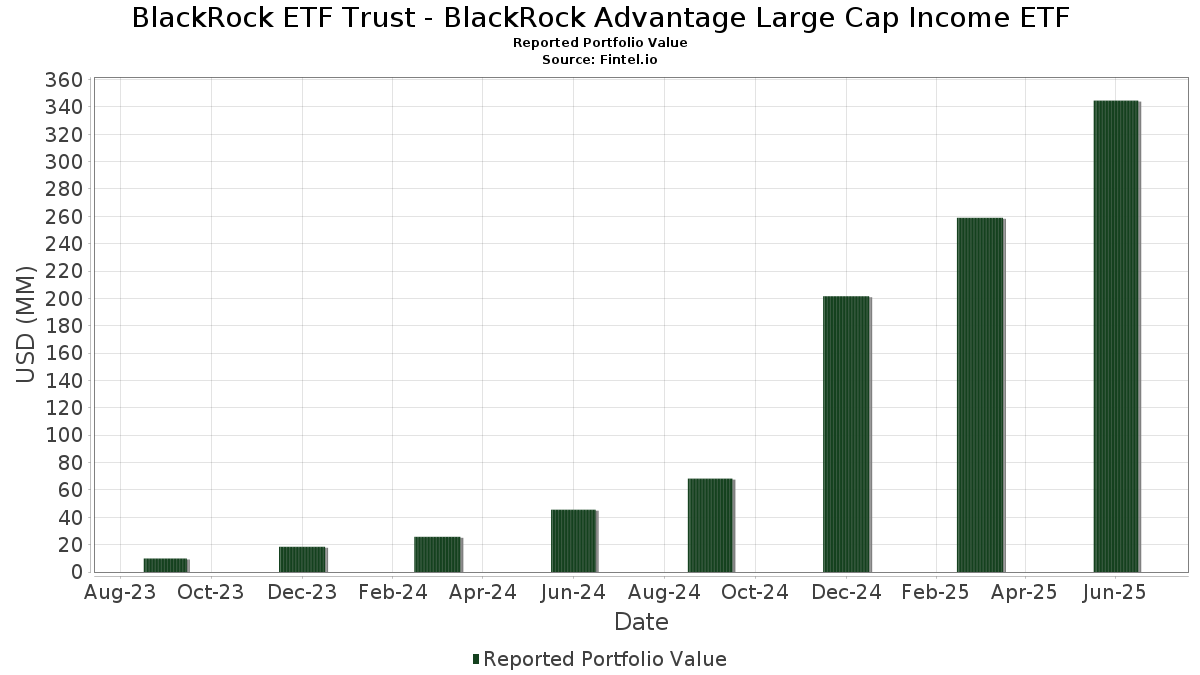
| Nilai Portofolio | $ 344,598,861 |
| Posisi Saat Ini | 184 |
Kepemilikan Terbaru, Kinerja, AUM (dari 13F, 13D)
BlackRock ETF Trust - BlackRock Advantage Large Cap Income ETF telah mengungkapkan total kepemilikan 184 dalam pengajuan SEC terbaru mereka. Nilai portofolio terbaru dihitung sebesar $ 344,598,861 USD. Aset yang Dikelola (AUM) sebenarnya adalah nilai ini ditambah kas (yang tidak diungkapkan). Aset-aset utama BlackRock ETF Trust - BlackRock Advantage Large Cap Income ETF adalah Microsoft Corporation (US:MSFT) , NVIDIA Corporation (US:NVDA) , Apple Inc. (US:AAPL) , Amazon.com, Inc. (US:AMZN) , and Alphabet Inc. (US:GOOGL) . Posisi baru BlackRock ETF Trust - BlackRock Advantage Large Cap Income ETF meliputi: Truist Financial Corporation (US:TFC) , The Charles Schwab Corporation (US:SCHW) , The Walt Disney Company (US:DIS) , Keurig Dr Pepper Inc. (US:KDP) , and Credicorp Ltd. (DE:D8V) .
Peningkatan Tertinggi Kuartal Ini
Kami menggunakan perubahan dalam alokasi portofolio karena ini adalah metrik yang paling bermakna. Perubahan dapat disebabkan oleh perdagangan atau perubahan harga saham.
| Keamanan | Saham (MM) |
Nilai (Juta Dolar AS) |
Portfolio % | ΔPorsyento ng Portfolio |
|---|---|---|---|---|
| 0.15 | 23.47 | 6.7062 | 1.4978 | |
| 0.06 | 28.19 | 8.0561 | 1.4545 | |
| 0.03 | 4.56 | 1.3042 | 1.2975 | |
| 3.47 | 3.47 | 0.9914 | 0.9914 | |
| 0.03 | 4.01 | 1.1466 | 0.9346 | |
| 0.04 | 4.09 | 1.1687 | 0.9151 | |
| 0.07 | 2.83 | 0.8096 | 0.8096 | |
| 2.77 | 0.7916 | 0.7916 | ||
| 0.02 | 4.69 | 1.3401 | 0.7796 | |
| 0.04 | 3.22 | 0.9196 | 0.7073 |
Penurunan Tertinggi Kuartal Ini
Kami menggunakan perubahan dalam alokasi portofolio karena ini adalah metrik yang paling bermakna. Perubahan dapat disebabkan oleh perdagangan atau perubahan harga saham.
| Keamanan | Saham (MM) |
Nilai (Juta Dolar AS) |
Portfolio % | ΔPorsyento ng Portfolio |
|---|---|---|---|---|
| 0.01 | 2.33 | 0.6645 | -1.0573 | |
| 0.01 | 2.81 | 0.8043 | -1.0240 | |
| 0.00 | 0.07 | 0.0189 | -0.9613 | |
| 0.00 | 0.62 | 0.1764 | -0.8761 | |
| 0.09 | 19.05 | 5.4435 | -0.8131 | |
| 0.00 | 0.69 | 0.1974 | -0.7142 | |
| 0.06 | 2.68 | 0.7668 | -0.7100 | |
| 0.00 | 1.56 | 0.4449 | -0.6377 | |
| 0.00 | 2.62 | 0.7495 | -0.6345 | |
| 0.00 | 0.14 | 0.0403 | -0.5623 |
Pengajuan 13F dan Dana
Formulir ini diajukan pada 2025-08-25 untuk periode pelaporan 2025-06-30. Klik ikon tautan untuk melihat riwayat transaksi selengkapnya.
Tingkatkan ke versi premium untuk membuka data premium dan ekspor ke Excel. ![]() .
.
| Keamanan | Ketik | Harga Saham Rata-rata | Saham (MM) |
ΔSaham (%) |
ΔSaham (%) |
Nilai ($MM) |
Portpolyo (%) |
ΔPortofolio (%) |
|
|---|---|---|---|---|---|---|---|---|---|
| MSFT / Microsoft Corporation | 0.06 | 27.88 | 28.19 | 69.45 | 8.0561 | 1.4545 | |||
| NVDA / NVIDIA Corporation | 0.15 | 22.65 | 23.47 | 78.79 | 6.7062 | 1.4978 | |||
| AAPL / Apple Inc. | 0.09 | 30.80 | 19.05 | 20.81 | 5.4435 | -0.8131 | |||
| AMZN / Amazon.com, Inc. | 0.07 | 30.80 | 16.20 | 50.84 | 4.6299 | 0.3674 | |||
| GOOGL / Alphabet Inc. | 0.06 | 30.87 | 10.09 | 49.14 | 2.8841 | 0.1990 | |||
| META / Meta Platforms, Inc. | 0.01 | 31.24 | 8.40 | 68.07 | 2.4014 | 0.4174 | |||
| WMT / Walmart Inc. | 0.07 | 30.78 | 6.45 | 45.69 | 1.8438 | 0.0862 | |||
| GOOG / Alphabet Inc. | 0.03 | 27.43 | 5.50 | 44.71 | 1.5725 | 0.0633 | |||
| HD / The Home Depot, Inc. | 0.01 | 43.63 | 5.25 | 43.71 | 1.5008 | 0.0505 | |||
| JPM / JPMorgan Chase & Co. | 0.02 | 29.15 | 4.89 | 52.64 | 1.3973 | 0.1262 | |||
| TXN / Texas Instruments Incorporated | 0.02 | 187.36 | 4.69 | 232.01 | 1.3401 | 0.7796 | |||
| JNJ / Johnson & Johnson | 0.03 | 29,190.20 | 4.56 | 28,418.75 | 1.3042 | 1.2975 | |||
| PFE / Pfizer Inc. | 0.19 | 45.96 | 4.56 | 39.63 | 1.3031 | 0.0072 | |||
| AVGO / Broadcom Inc. | 0.02 | 30.90 | 4.54 | 115.53 | 1.2973 | 0.4614 | |||
| ICE / Intercontinental Exchange, Inc. | 0.02 | 30.93 | 4.49 | 39.24 | 1.2840 | 0.0036 | |||
| GILD / Gilead Sciences, Inc. | 0.04 | 30.92 | 4.37 | 29.53 | 1.2477 | -0.0898 | |||
| MRK / Merck & Co., Inc. | 0.05 | 30.83 | 4.34 | 15.39 | 1.2412 | -0.2526 | |||
| TSLA / Tesla, Inc. | 0.01 | 35.44 | 4.27 | 66.01 | 1.2199 | 0.1995 | |||
| LMT / Lockheed Martin Corporation | 0.01 | 60.03 | 4.18 | 65.91 | 1.1951 | 0.1949 | |||
| UPS / United Parcel Service, Inc. | 0.04 | 597.38 | 4.09 | 540.91 | 1.1687 | 0.9151 | |||
| CME / CME Group Inc. | 0.01 | 19.60 | 4.07 | 24.27 | 1.1636 | -0.1367 | |||
| PEP / PepsiCo, Inc. | 0.03 | 752.76 | 4.01 | 651.12 | 1.1466 | 0.9346 | |||
| CAH / Cardinal Health, Inc. | 0.02 | 26.72 | 4.01 | 54.55 | 1.1458 | 0.1162 | |||
| CTAS / Cintas Corporation | 0.02 | 30.63 | 3.99 | 41.63 | 1.1417 | 0.0225 | |||
| MSI / Motorola Solutions, Inc. | 0.01 | 31.33 | 3.82 | 26.12 | 1.0931 | -0.1104 | |||
| WM / Waste Management, Inc. | 0.02 | 30.62 | 3.70 | 29.10 | 1.0586 | -0.0800 | |||
| BAC / Bank of America Corporation | 0.08 | 30.78 | 3.68 | 48.27 | 1.0520 | 0.0670 | |||
| BLACKROCK CASH FUNDS / STIV (000000000) | 3.47 | 3.47 | 0.9914 | 0.9914 | |||||
| WMB / The Williams Companies, Inc. | 0.05 | 51.47 | 3.41 | 59.21 | 0.9740 | 0.1245 | |||
| ETR / Entergy Corporation | 0.04 | 518.50 | 3.22 | 501.31 | 0.9196 | 0.7073 | |||
| LRCX / Lam Research Corporation | 0.03 | 30.86 | 2.95 | 75.25 | 0.8421 | 0.1747 | |||
| TFC / Truist Financial Corporation | 0.07 | 2.83 | 0.8096 | 0.8096 | |||||
| MA / Mastercard Incorporated | 0.01 | -40.42 | 2.81 | -38.91 | 0.8043 | -1.0240 | |||
| COST / Costco Wholesale Corporation | 0.00 | 226.91 | 2.80 | 242.12 | 0.8009 | 0.4759 | |||
| S&P500 EMINI / DE (000000000) | 2.77 | 0.7916 | 0.7916 | ||||||
| BRK.B / Berkshire Hathaway Inc. | 0.01 | 31.52 | 2.74 | 19.96 | 0.7833 | -0.1234 | |||
| MDT / Medtronic plc | 0.03 | 329.47 | 2.74 | 317.05 | 0.7831 | 0.5221 | |||
| CL / Colgate-Palmolive Company | 0.03 | -10.13 | 2.72 | -12.80 | 0.7771 | -0.4605 | |||
| VZ / Verizon Communications Inc. | 0.06 | -24.42 | 2.68 | -27.90 | 0.7668 | -0.7100 | |||
| CMCSA / Comcast Corporation | 0.07 | 3.40 | 2.67 | 0.00 | 0.7618 | -0.2959 | |||
| PGR / The Progressive Corporation | 0.01 | 1.01 | 2.64 | -4.76 | 0.7550 | -0.3457 | |||
| BKNG / Booking Holdings Inc. | 0.00 | -40.16 | 2.62 | -24.81 | 0.7495 | -0.6345 | |||
| ABBV / AbbVie Inc. | 0.01 | 30.29 | 2.59 | 15.41 | 0.7407 | -0.1503 | |||
| XOM / Exxon Mobil Corporation | 0.02 | 2,043.70 | 2.53 | 2,064.10 | 0.7239 | 0.6635 | |||
| ADBE / Adobe Inc. | 0.01 | 27.31 | 2.49 | 28.42 | 0.7118 | -0.0579 | |||
| UNH / UnitedHealth Group Incorporated | 0.01 | 63.89 | 2.48 | -2.40 | 0.7099 | -0.2998 | |||
| CSCO / Cisco Systems, Inc. | 0.04 | 30.64 | 2.47 | 46.90 | 0.7054 | 0.0385 | |||
| NOC / Northrop Grumman Corporation | 0.00 | 8.38 | 2.46 | 5.80 | 0.7042 | -0.2197 | |||
| SCHW / The Charles Schwab Corporation | 0.03 | 2.36 | 0.6755 | 0.6755 | |||||
| TRV / The Travelers Companies, Inc. | 0.01 | 38.80 | 2.35 | 40.44 | 0.6720 | 0.0075 | |||
| V / Visa Inc. | 0.01 | -47.10 | 2.33 | -46.40 | 0.6645 | -1.0573 | |||
| PKG / Packaging Corporation of America | 0.01 | 18.66 | 2.20 | 12.94 | 0.6285 | -0.1443 | |||
| TE Connectivity PLC / EC (IE000IVNQZ81) | 0.01 | -33.14 | 2.19 | -20.18 | 0.6251 | -0.4625 | |||
| DIS / The Walt Disney Company | 0.02 | 2.16 | 0.6181 | 0.6181 | |||||
| TJX / The TJX Companies, Inc. | 0.02 | 95.12 | 2.13 | 97.95 | 0.6076 | 0.1811 | |||
| PM / Philip Morris International Inc. | 0.01 | 31.11 | 2.04 | 50.44 | 0.5840 | 0.0449 | |||
| FTNT / Fortinet, Inc. | 0.02 | -35.59 | 1.95 | -29.29 | 0.5564 | -0.5357 | |||
| KDP / Keurig Dr Pepper Inc. | 0.06 | 1.94 | 0.5545 | 0.5545 | |||||
| D8V / Credicorp Ltd. | 0.01 | 1.80 | 0.5150 | 0.5150 | |||||
| CSA / Accenture plc | 0.01 | -19.81 | 1.76 | -23.22 | 0.5038 | -0.4070 | |||
| NFLX / Netflix, Inc. | 0.00 | 35.29 | 1.72 | 94.36 | 0.4929 | 0.1406 | |||
| EXPD / Expeditors International of Washington, Inc. | 0.01 | 44.71 | 1.71 | 37.54 | 0.4891 | -0.0049 | |||
| SPG / Simon Property Group, Inc. | 0.01 | 5.78 | 1.71 | 2.39 | 0.4891 | -0.1742 | |||
| YUM / Yum! Brands, Inc. | 0.01 | 1.70 | 0.4844 | 0.4844 | |||||
| CUBE / CubeSmart | 0.04 | 58.30 | 1.65 | 57.48 | 0.4723 | 0.0560 | |||
| 3EC / Eaton Corporation plc | 0.00 | 26.81 | 1.63 | 66.56 | 0.4671 | 0.0776 | |||
| LLY / Eli Lilly and Company | 0.00 | -39.54 | 1.56 | -42.94 | 0.4449 | -0.6377 | |||
| SPGI / S&P Global Inc. | 0.00 | 30.98 | 1.52 | 35.87 | 0.4333 | -0.0093 | |||
| TXRH / Texas Roadhouse, Inc. | 0.01 | 12.35 | 1.50 | 26.44 | 0.4278 | -0.0423 | |||
| APH / Amphenol Corporation | 0.02 | -25.01 | 1.48 | 12.95 | 0.4238 | -0.0974 | |||
| AME / AMETEK, Inc. | 0.01 | 2,070.05 | 1.47 | 2,193.75 | 0.4197 | 0.3942 | |||
| ED / Consolidated Edison, Inc. | 0.01 | 4,041.04 | 1.44 | 3,681.58 | 0.4109 | 0.3957 | |||
| CRM / Salesforce, Inc. | 0.01 | 11,852.38 | 1.37 | 12,336.36 | 0.3912 | 0.3745 | |||
| DUK / Duke Energy Corporation | 0.01 | 503.74 | 1.31 | 486.16 | 0.3754 | 0.2862 | |||
| UTHR / United Therapeutics Corporation | 0.00 | 32.02 | 1.29 | 23.04 | 0.3681 | -0.0473 | |||
| ORLY / O'Reilly Automotive, Inc. | 0.01 | 1.22 | 0.3488 | 0.3488 | |||||
| FOXA / Fox Corporation | 0.02 | 612.76 | 1.19 | 605.92 | 0.3410 | 0.2739 | |||
| CMI / Cummins Inc. | 0.00 | 31.16 | 1.12 | 37.09 | 0.3203 | -0.0042 | |||
| NOW / ServiceNow, Inc. | 0.00 | -22.10 | 1.08 | 0.56 | 0.3097 | -0.1178 | |||
| TTWO / Take-Two Interactive Software, Inc. | 0.00 | 1.08 | 0.3088 | 0.3088 | |||||
| VTR / Ventas, Inc. | 0.02 | -4.12 | 1.08 | -11.93 | 0.3082 | -0.1778 | |||
| TSN / Tyson Foods, Inc. | 0.02 | 30.58 | 1.07 | 14.47 | 0.3053 | -0.0650 | |||
| COP / ConocoPhillips | 0.01 | -10.11 | 1.03 | -23.16 | 0.2950 | -0.2383 | |||
| UBER / Uber Technologies, Inc. | 0.01 | -32.85 | 1.03 | 3.85 | 0.2933 | -0.2123 | |||
| EXR / Extra Space Storage Inc. | 0.01 | 30.94 | 1.02 | 29.97 | 0.2914 | -0.0198 | |||
| NLY / Annaly Capital Management, Inc. | 0.05 | -7.18 | 1.02 | -14.03 | 0.2909 | -0.1787 | |||
| BSX / Boston Scientific Corporation | 0.01 | 30.12 | 1.00 | 38.48 | 0.2871 | -0.0006 | |||
| INTU / Intuit Inc. | 0.00 | 2,348.08 | 1.00 | 2,936.36 | 0.2866 | 0.1564 | |||
| FDX / FedEx Corporation | 0.00 | 299.26 | 0.97 | 273.18 | 0.2786 | 0.1747 | |||
| NEM / Newmont Corporation | 0.02 | 0.96 | 0.2747 | 0.2747 | |||||
| KHC / The Kraft Heinz Company | 0.04 | 0.93 | 0.2648 | 0.2648 | |||||
| VRSN / VeriSign, Inc. | 0.00 | 0.93 | 0.2648 | 0.2648 | |||||
| PSA / Public Storage | 0.00 | 3,654.88 | 0.90 | 3,662.50 | 0.2582 | 0.2485 | |||
| 3E1 / Elastic N.V. | 0.01 | 2,597.43 | 0.88 | 2,500.00 | 0.2529 | 0.2391 | |||
| HAS / Hasbro, Inc. | 0.01 | -58.32 | 0.86 | -50.00 | 0.2454 | -0.4357 | |||
| CALM / Cal-Maine Foods, Inc. | 0.01 | 0.85 | 0.2439 | 0.2439 | |||||
| ADSK / Autodesk, Inc. | 0.00 | 35.24 | 0.84 | 59.85 | 0.2391 | 0.0315 | |||
| DVN / Devon Energy Corporation | 0.03 | 7,912.92 | 0.83 | 8,180.00 | 0.2368 | 0.2313 | |||
| HON / Honeywell International Inc. | 0.00 | 1,876.30 | 0.80 | 2,111.11 | 0.2276 | 0.2130 | |||
| JHG / Janus Henderson Group plc | 0.02 | 81.44 | 0.78 | 95.02 | 0.2241 | 0.0645 | |||
| NTRA / Natera, Inc. | 0.00 | 31.30 | 0.77 | 56.73 | 0.2197 | 0.0252 | |||
| BMY / Bristol-Myers Squibb Company | 0.02 | 30.42 | 0.75 | -1.05 | 0.2151 | -0.0866 | |||
| MRVL / Marvell Technology, Inc. | 0.01 | 37.84 | 0.75 | 73.21 | 0.2144 | 0.0426 | |||
| OKE / ONEOK, Inc. | 0.01 | 57.61 | 0.70 | 29.68 | 0.1999 | -0.0142 | |||
| QCOM / QUALCOMM Incorporated | 0.00 | -70.99 | 0.69 | -69.96 | 0.1974 | -0.7142 | |||
| PH / Parker-Hannifin Corporation | 0.00 | 5.22 | 0.69 | 20.88 | 0.1970 | -0.0292 | |||
| HBAN / Huntington Bancshares Incorporated | 0.04 | 0.68 | 0.1940 | 0.1940 | |||||
| CNA / CNA Financial Corporation | 0.01 | 70.93 | 0.67 | 56.67 | 0.1912 | 0.0217 | |||
| EME / EMCOR Group, Inc. | 0.00 | -34.79 | 0.64 | -5.64 | 0.1819 | -0.0858 | |||
| COR / Cencora, Inc. | 0.00 | 82.93 | 0.62 | 126.01 | 0.1764 | -0.8761 | |||
| ABNB / Airbnb, Inc. | 0.00 | 33.28 | 0.51 | 47.81 | 0.1450 | 0.0086 | |||
| AON / Aon plc | 0.00 | 0.47 | 0.1347 | 0.1347 | |||||
| BWA / BorgWarner Inc. | 0.01 | 89.53 | 0.44 | 122.11 | 0.1264 | 0.0471 | |||
| MS / Morgan Stanley | 0.00 | 31.98 | 0.39 | 59.09 | 0.1103 | 0.0142 | |||
| PNC / The PNC Financial Services Group, Inc. | 0.00 | -57.97 | 0.36 | -55.45 | 0.1042 | -0.2203 | |||
| GD / General Dynamics Corporation | 0.00 | -3.34 | 0.36 | 3.42 | 0.1039 | -0.0356 | |||
| OHI / Omega Healthcare Investors, Inc. | 0.01 | -37.54 | 0.35 | -39.86 | 0.1001 | -0.1311 | |||
| PLTR / Palantir Technologies Inc. | 0.00 | 0.35 | 0.0995 | 0.0995 | |||||
| MTZ / MasTec, Inc. | 0.00 | 50.34 | 0.31 | 119.42 | 0.0873 | 0.0321 | |||
| KMI / Kinder Morgan, Inc. | 0.01 | 617.84 | 0.29 | 653.85 | 0.0842 | 0.0684 | |||
| WDAY / Workday, Inc. | 0.00 | 0.29 | 0.0831 | 0.0831 | |||||
| DT / Dynatrace, Inc. | 0.01 | 0.29 | 0.0818 | 0.0818 | |||||
| RTX / RTX Corporation | 0.00 | 0.28 | 0.0792 | 0.0792 | |||||
| NEE / NextEra Energy, Inc. | 0.00 | 7,812.00 | 0.27 | 9,033.33 | 0.0785 | 0.0771 | |||
| EQIX / Equinix, Inc. | 0.00 | 8,400.00 | 0.27 | 8,900.00 | 0.0773 | 0.0721 | |||
| BFAM / Bright Horizons Family Solutions Inc. | 0.00 | 34.59 | 0.26 | 30.69 | 0.0757 | -0.0046 | |||
| NI / NiSource Inc. | 0.01 | 0.26 | 0.0739 | 0.0739 | |||||
| TMUS / T-Mobile US, Inc. | 0.00 | 0.25 | 0.0726 | 0.0726 | |||||
| INGR / Ingredion Incorporated | 0.00 | 29.54 | 0.25 | 30.16 | 0.0705 | -0.0048 | |||
| BMRN / BioMarin Pharmaceutical Inc. | 0.00 | 31.01 | 0.19 | 2.13 | 0.0550 | -0.0199 | |||
| TEAM / Atlassian Corporation | 0.00 | 0.19 | 0.0542 | 0.0542 | |||||
| DY / Dycom Industries, Inc. | 0.00 | 0.18 | 0.0525 | 0.0525 | |||||
| KIM / Kimco Realty Corporation | 0.01 | 85,690.00 | 0.18 | 0.0515 | 0.0515 | ||||
| GDDY / GoDaddy Inc. | 0.00 | 0.17 | 0.0480 | 0.0480 | |||||
| RELY / Remitly Global, Inc. | 0.01 | 0.17 | 0.0475 | 0.0475 | |||||
| WCN / Waste Connections, Inc. | 0.00 | 21.16 | 0.16 | 32.23 | 0.0458 | -0.0164 | |||
| RITM / Rithm Capital Corp. | 0.01 | -59.14 | 0.16 | -57.45 | 0.0450 | -0.1441 | |||
| REGN / Regeneron Pharmaceuticals, Inc. | 0.00 | 89.26 | 0.15 | 57.45 | 0.0423 | 0.0048 | |||
| GEY / Garmin Ltd. | 0.00 | 24.24 | 0.15 | 19.83 | 0.0416 | -0.0068 | |||
| CBOE / Cboe Global Markets, Inc. | 0.00 | 29.32 | 0.14 | 32.71 | 0.0409 | -0.0017 | |||
| TGT / Target Corporation | 0.00 | -90.17 | 0.14 | -90.71 | 0.0403 | -0.5623 | |||
| HRB / H&R Block, Inc. | 0.00 | 0.14 | 0.0398 | 0.0398 | |||||
| ONTO / Onto Innovation Inc. | 0.00 | 0.14 | 0.0391 | 0.0391 | |||||
| INCY / Incyte Corporation | 0.00 | 28.35 | 0.13 | 45.05 | 0.0378 | 0.0014 | |||
| PPC / Pilgrim's Pride Corporation | 0.00 | -88.13 | 0.13 | -90.21 | 0.0357 | -0.4711 | |||
| NYT / The New York Times Company | 0.00 | 14.24 | 0.12 | 28.89 | 0.0332 | -0.0026 | |||
| CI / The Cigna Group | 0.00 | -64.20 | 0.11 | -64.13 | 0.0324 | -0.0927 | |||
| FIX / Comfort Systems USA, Inc. | 0.00 | 0.11 | 0.0323 | 0.0323 | |||||
| INVH / Invitation Homes Inc. | 0.00 | 0.11 | 0.0303 | 0.0303 | |||||
| AZO / AutoZone, Inc. | 0.00 | 0.10 | 0.0286 | 0.0286 | |||||
| EXEL / Exelixis, Inc. | 0.00 | 34.33 | 0.10 | 60.66 | 0.0282 | 0.0038 | |||
| ORI / Old Republic International Corporation | 0.00 | -88.27 | 0.10 | -87.60 | 0.0273 | -0.3651 | |||
| FXI / Flex Ltd. | 0.00 | 13.95 | 0.08 | 48.08 | 0.0221 | -0.0046 | |||
| MKTX / MarketAxess Holdings Inc. | 0.00 | 0.08 | 0.0220 | 0.0220 | |||||
| BIIB / Biogen Inc. | 0.00 | 31.99 | 0.07 | 21.31 | 0.0212 | -0.0031 | |||
| NBIX / Neurocrine Biosciences, Inc. | 0.00 | -93.91 | 0.07 | -93.10 | 0.0209 | -0.3990 | |||
| EA / Electronic Arts Inc. | 0.00 | -72.39 | 0.07 | -68.56 | 0.0208 | -0.4778 | |||
| RL / Ralph Lauren Corporation | 0.00 | 196.63 | 0.07 | 278.95 | 0.0207 | 0.0129 | |||
| HEIA / Heico Corp. - Class A | 0.00 | 0.07 | 0.0204 | 0.0204 | |||||
| EHC / Encompass Health Corporation | 0.00 | -46.03 | 0.07 | -35.19 | 0.0203 | -0.0228 | |||
| T / AT&T Inc. | 0.00 | -92.01 | 0.07 | -91.91 | 0.0202 | -0.3233 | |||
| WELL / Welltower Inc. | 0.00 | 0.07 | 0.0196 | 0.0196 | |||||
| MCO / Moody's Corporation | 0.00 | 88.73 | 0.07 | 103.03 | 0.0192 | 0.0061 | |||
| CWAN / Clearwater Analytics Holdings, Inc. | 0.00 | 0.07 | 0.0191 | 0.0191 | |||||
| TRGP / Targa Resources Corp. | 0.00 | 107.57 | 0.07 | 78.38 | 0.0191 | 0.0044 | |||
| LYB / LyondellBasell Industries N.V. | 0.00 | -96.74 | 0.07 | -97.33 | 0.0189 | -0.9613 | |||
| CHRD / Chord Energy Corporation | 0.00 | 0.06 | 0.0186 | 0.0186 | |||||
| AOS / Amdocs Limited | 0.00 | 0.85 | 0.06 | 1.59 | 0.0186 | -0.2271 | |||
| BAH / Booz Allen Hamilton Holding Corporation | 0.00 | 0.06 | 0.0185 | 0.0185 | |||||
| NXT / Nextracker Inc. | 0.00 | 0.06 | 0.0182 | 0.0182 | |||||
| OMC / Omnicom Group Inc. | 0.00 | -6.35 | 0.06 | -19.23 | 0.0182 | -0.0129 | |||
| PLTK / Playtika Holding Corp. | 0.01 | 0.06 | 0.0181 | 0.0181 | |||||
| MAN / ManpowerGroup Inc. | 0.00 | 0.06 | 0.0180 | 0.0180 | |||||
| WK / Workiva Inc. | 0.00 | 0.06 | 0.0176 | 0.0176 | |||||
| BBY / Best Buy Co., Inc. | 0.00 | 5,625.00 | 0.06 | 6,000.00 | 0.0176 | 0.0171 | |||
| HUN / Huntsman Corporation | 0.01 | 0.06 | 0.0175 | 0.0175 | |||||
| LNG / Cheniere Energy, Inc. | 0.00 | -82.90 | 0.06 | -82.30 | 0.0166 | -0.1113 | |||
| DPZ / Domino's Pizza, Inc. | 0.00 | 55.70 | 0.06 | 52.78 | 0.0158 | 0.0014 | |||
| FICO / Fair Isaac Corporation | 0.00 | 100.00 | 0.05 | 100.00 | 0.0157 | 0.0047 | |||
| SRPT / Sarepta Therapeutics, Inc. | 0.00 | 0.03 | 0.0086 | 0.0086 | |||||
| S&P 500 INDEX / DE (000000000) | -0.44 | -0.1244 | -0.1244 | ||||||
| S&P 500 INDEX / DE (000000000) | -0.84 | -0.2403 | -0.2403 | ||||||
| S&P 500 INDEX / DE (000000000) | -1.02 | -0.2903 | -0.2903 | ||||||
| S&P 500 INDEX / DE (000000000) | -1.13 | -0.3235 | -0.3235 |