Mga Batayang Estadistika
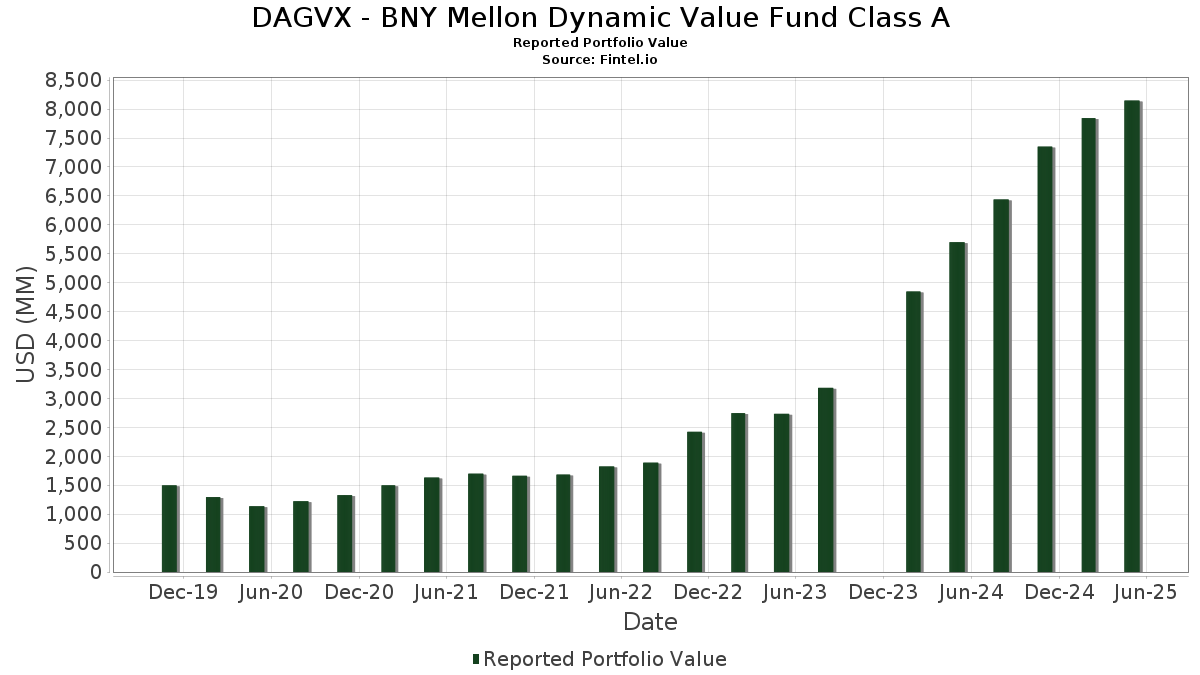
| Nilai Portofolio | $ 8,148,123,660 |
| Posisi Saat Ini | 67 |
Kepemilikan Terbaru, Kinerja, AUM (dari 13F, 13D)
DAGVX - BNY Mellon Dynamic Value Fund Class A telah mengungkapkan total kepemilikan 67 dalam pengajuan SEC terbaru mereka. Nilai portofolio terbaru dihitung sebesar $ 8,148,123,660 USD. Aset yang Dikelola (AUM) sebenarnya adalah nilai ini ditambah kas (yang tidak diungkapkan). Aset-aset utama DAGVX - BNY Mellon Dynamic Value Fund Class A adalah JPMorgan Chase & Co. (US:JPM) , Berkshire Hathaway Inc. (US:BRK.B) , Bank of America Corporation (US:BAC) , Johnson & Johnson (US:JNJ) , and Cisco Systems, Inc. (US:CSCO) .
Peningkatan Tertinggi Kuartal Ini
Kami menggunakan perubahan dalam alokasi portofolio karena ini adalah metrik yang paling bermakna. Perubahan dapat disebabkan oleh perdagangan atau perubahan harga saham.
| Keamanan | Saham (MM) |
Nilai (Juta Dolar AS) |
Portfolio % | ΔPorsyento ng Portfolio |
|---|---|---|---|---|
| 0.74 | 180.00 | 2.2060 | 2.2060 | |
| 1.71 | 265.17 | 3.2499 | 1.2151 | |
| 0.68 | 175.40 | 2.1497 | 0.9875 | |
| 1.09 | 174.95 | 2.1441 | 0.7144 | |
| 0.30 | 181.13 | 2.2198 | 0.6978 | |
| 1.31 | 346.36 | 4.2449 | 0.6253 | |
| 2.62 | 100.82 | 1.2356 | 0.4987 | |
| 40.55 | 40.55 | 0.4969 | 0.4969 | |
| 1.68 | 142.33 | 1.7443 | 0.4943 | |
| 1.80 | 154.47 | 1.8931 | 0.4606 |
Penurunan Tertinggi Kuartal Ini
Kami menggunakan perubahan dalam alokasi portofolio karena ini adalah metrik yang paling bermakna. Perubahan dapat disebabkan oleh perdagangan atau perubahan harga saham.
| Keamanan | Saham (MM) |
Nilai (Juta Dolar AS) |
Portfolio % | ΔPorsyento ng Portfolio |
|---|---|---|---|---|
| 1.78 | 181.81 | 2.2283 | -1.4905 | |
| 0.88 | 42.29 | 0.5182 | -1.3920 | |
| 0.49 | 146.91 | 1.8005 | -1.2059 | |
| 0.44 | 48.61 | 0.5958 | -1.0450 | |
| 3.95 | 94.21 | 1.1546 | -0.8422 | |
| 1.61 | 88.78 | 1.0880 | -0.8352 | |
| 0.67 | 338.61 | 4.1500 | -0.7919 | |
| 3.83 | 241.19 | 2.9559 | -0.4966 | |
| 0.95 | 74.61 | 0.9144 | -0.3225 | |
| 2.27 | 119.50 | 1.4645 | -0.3166 |
Pengajuan 13F dan Dana
Formulir ini diajukan pada 2025-07-29 untuk periode pelaporan 2025-05-31. Klik ikon tautan untuk melihat riwayat transaksi selengkapnya.
Tingkatkan ke versi premium untuk membuka data premium dan ekspor ke Excel. ![]() .
.
| Keamanan | Ketik | Harga Saham Rata-rata | Saham (MM) |
ΔSaham (%) |
ΔSaham (%) |
Nilai ($MM) |
Portpolyo (%) |
ΔPortofolio (%) |
|
|---|---|---|---|---|---|---|---|---|---|
| JPM / JPMorgan Chase & Co. | 1.31 | 22.15 | 346.36 | 21.85 | 4.2449 | 0.6253 | |||
| BRK.B / Berkshire Hathaway Inc. | 0.67 | -11.04 | 338.61 | -12.75 | 4.1500 | -0.7919 | |||
| BAC / Bank of America Corporation | 6.41 | 18.61 | 283.04 | 13.54 | 3.4688 | 0.2947 | |||
| JNJ / Johnson & Johnson | 1.71 | 76.44 | 265.17 | 65.95 | 3.2499 | 1.2151 | |||
| CSCO / Cisco Systems, Inc. | 3.83 | -9.54 | 241.19 | -11.05 | 2.9559 | -0.4966 | |||
| T / AT&T Inc. | 8.03 | -1.08 | 223.16 | 0.32 | 2.7350 | -0.0975 | |||
| AON / Aon plc | 0.53 | 10.54 | 195.94 | 0.53 | 2.4014 | -0.0805 | |||
| MDT / Medtronic plc | 2.31 | 20.51 | 191.92 | 8.68 | 2.3522 | 0.1034 | |||
| DHR / Danaher Corporation | 1.00 | 6.14 | 190.40 | -2.98 | 2.3335 | -0.1656 | |||
| XOM / Exxon Mobil Corporation | 1.78 | 77.70 | 181.81 | 77.91 | 2.2283 | -1.4905 | |||
| GS / The Goldman Sachs Group, Inc. | 0.30 | 57.05 | 181.13 | 51.54 | 2.2198 | 0.6978 | |||
| LHX / L3Harris Technologies, Inc. | 0.74 | 180.00 | 2.2060 | 2.2060 | |||||
| AIZ / Assurant, Inc. | 0.87 | 13.63 | 177.15 | 10.95 | 2.1711 | 0.1380 | |||
| RCL / Royal Caribbean Cruises Ltd. | 0.68 | 84.04 | 175.40 | 92.17 | 2.1497 | 0.9875 | |||
| MPC / Marathon Petroleum Corporation | 1.09 | 45.58 | 174.95 | 55.82 | 2.1441 | 0.7144 | |||
| COF / Capital One Financial Corporation | 0.91 | 32.93 | 172.37 | 25.37 | 2.1126 | 0.3618 | |||
| PSX / Phillips 66 | 1.52 | 15.69 | 172.21 | 1.23 | 2.1105 | -0.0556 | |||
| HUBB / Hubbell Incorporated | 0.43 | 4.80 | 167.34 | 9.88 | 2.0509 | 0.1115 | |||
| PM / Philip Morris International Inc. | 0.88 | -10.73 | 158.13 | 3.82 | 1.9380 | -0.0016 | |||
| ALC / Alcon Inc. | 1.80 | 47.79 | 154.47 | 37.31 | 1.8931 | 0.4606 | |||
| CRH / CRH plc | 1.67 | 11.02 | 151.98 | -1.28 | 1.8626 | -0.0978 | |||
| UNH / UnitedHealth Group Incorporated | 0.49 | -2.11 | 146.91 | -37.78 | 1.8005 | -1.2059 | |||
| DIS / The Walt Disney Company | 1.30 | 6.14 | 146.49 | 5.43 | 1.7954 | 0.0261 | |||
| AIG / American International Group, Inc. | 1.68 | 42.07 | 142.33 | 44.98 | 1.7443 | 0.4943 | |||
| IP / International Paper Company | 2.69 | 25.94 | 128.67 | 6.86 | 1.5769 | 0.0437 | |||
| LVS / Las Vegas Sands Corp. | 3.00 | 6.14 | 123.58 | -2.29 | 1.5146 | -0.0959 | |||
| HON / Honeywell International Inc. | 0.54 | 23.19 | 123.51 | 31.16 | 1.5137 | 0.3146 | |||
| FHN / First Horizon Corporation | 6.20 | 13.23 | 123.17 | 4.50 | 1.5095 | 0.0087 | |||
| NEM / Newmont Corporation | 2.27 | -30.58 | 119.50 | -14.57 | 1.4645 | -0.3166 | |||
| IBM / International Business Machines Corporation | 0.46 | 6.14 | 118.82 | 8.92 | 1.4562 | 0.0672 | |||
| SCHW / The Charles Schwab Corporation | 1.22 | 57.50 | 108.01 | 135.23 | 1.3238 | -0.1190 | |||
| HWM / Howmet Aerospace Inc. | 0.61 | -11.16 | 102.97 | 10.50 | 1.2620 | 0.0753 | |||
| CSX / CSX Corporation | 3.20 | 43.05 | 101.24 | 41.18 | 1.2408 | 0.3276 | |||
| FCX / Freeport-McMoRan Inc. | 2.62 | 67.10 | 100.82 | 74.21 | 1.2356 | 0.4987 | |||
| AME / AMETEK, Inc. | 0.55 | 6.14 | 97.83 | 0.22 | 1.1990 | -0.0440 | |||
| DLB / Dolby Laboratories, Inc. | 1.32 | 6.14 | 97.82 | -3.42 | 1.1988 | -0.0908 | |||
| CME / CME Group Inc. | 0.33 | -7.65 | 94.94 | 5.18 | 1.1636 | 0.0141 | |||
| ICE / Intercontinental Exchange, Inc. | 0.53 | -15.87 | 94.88 | -12.68 | 1.1628 | -0.2208 | |||
| KVUE / Kenvue Inc. | 3.95 | -40.60 | 94.21 | -39.92 | 1.1546 | -0.8422 | |||
| EQT / EQT Corporation | 1.61 | -48.64 | 88.78 | -41.22 | 1.0880 | -0.8352 | |||
| LH / Labcorp Holdings Inc. | 0.35 | 6.14 | 87.87 | 5.27 | 1.0769 | 0.0140 | |||
| JCI / Johnson Controls International plc | 0.83 | -26.79 | 83.76 | -13.37 | 1.0266 | -0.2046 | |||
| BAX / Baxter International Inc. | 2.70 | -7.20 | 82.26 | -17.98 | 1.0082 | -0.2690 | |||
| GEV / GE Vernova Inc. | 0.17 | 34.80 | 82.20 | 90.21 | 1.0075 | 0.4572 | |||
| VOYA / Voya Financial, Inc. | 1.21 | 6.14 | 80.21 | -2.29 | 0.9830 | -0.0623 | |||
| TE Connectivity PLC / EC (IE000IVNQZ81) | 0.49 | 80.17 | 78.84 | 87.24 | 0.9663 | 0.4301 | |||
| MET / MetLife, Inc. | 0.95 | -15.76 | 74.61 | -23.19 | 0.9144 | -0.3225 | |||
| EW / Edwards Lifesciences Corporation | 0.94 | 29.22 | 73.85 | 41.13 | 0.9050 | 0.2387 | |||
| FERG / Ferguson Enterprises Inc. | 0.40 | 43.20 | 72.77 | 47.10 | 0.8918 | 0.2619 | |||
| CEG / Constellation Energy Corporation | 0.23 | 48.97 | 71.52 | 82.03 | 0.8766 | 0.3762 | |||
| FDX / FedEx Corporation | 0.33 | 6.14 | 71.10 | -11.95 | 0.8714 | -0.1568 | |||
| DAL / Delta Air Lines, Inc. | 1.38 | 53.91 | 66.77 | 23.88 | 0.8184 | 0.1320 | |||
| RNR / RenaissanceRe Holdings Ltd. | 0.26 | 12.45 | 65.42 | 18.04 | 0.8018 | 0.0960 | |||
| VLTO / Veralto Corporation | 0.64 | 6.14 | 64.56 | 7.49 | 0.7913 | 0.0264 | |||
| WY / Weyerhaeuser Company | 2.48 | 965.54 | 64.35 | 598.58 | 0.7886 | 0.2842 | |||
| CCK / Crown Holdings, Inc. | 0.64 | 32.75 | 62.80 | 45.89 | 0.7697 | 0.2215 | |||
| MMM / 3M Company | 0.42 | 6.14 | 62.54 | 1.51 | 0.7665 | -0.0181 | |||
| CHKP / Check Point Software Technologies Ltd. | 0.27 | 50.39 | 61.55 | 155.75 | 0.7544 | -0.0018 | |||
| MU / Micron Technology, Inc. | 0.57 | 56.15 | 53.95 | 57.54 | 0.6612 | 0.2251 | |||
| GILD / Gilead Sciences, Inc. | 0.44 | -60.82 | 48.61 | -62.27 | 0.5958 | -1.0450 | |||
| GL / Globe Life Inc. | 0.36 | 6.14 | 43.79 | 1.51 | 0.5367 | -0.0126 | |||
| GM / General Motors Company | 0.86 | 6.14 | 42.59 | 7.18 | 0.5220 | 0.0160 | |||
| BMY / Bristol-Myers Squibb Company | 0.88 | -65.19 | 42.29 | -71.81 | 0.5182 | -1.3920 | |||
| AKAM / Akamai Technologies, Inc. | 0.54 | -14.22 | 40.75 | -19.27 | 0.4995 | -0.1433 | |||
| DREYFUS INSTITUTIONAL PREFERRED GOVERNMENT PLUS MONEY MARKET FUND / STIV (000000000) | 40.55 | 40.55 | 0.4969 | 0.4969 | |||||
| INTC / Intel Corporation | 1.43 | 6.14 | 27.94 | -12.56 | 0.3424 | -0.0644 | |||
| BNTX / BioNTech SE - Depositary Receipt (Common Stock) | 0.24 | -24.02 | 23.45 | -35.53 | 0.2874 | -0.1758 |