Mga Batayang Estadistika
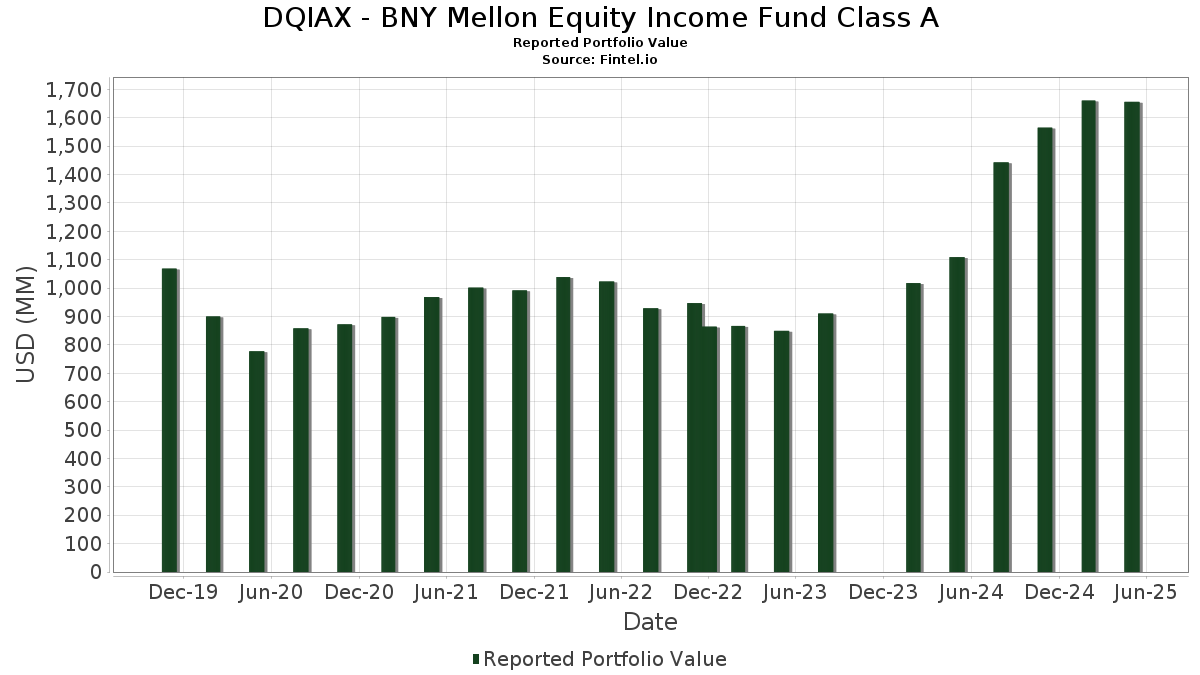
| Nilai Portofolio | $ 1,655,635,633 |
| Posisi Saat Ini | 102 |
Kepemilikan Terbaru, Kinerja, AUM (dari 13F, 13D)
DQIAX - BNY Mellon Equity Income Fund Class A telah mengungkapkan total kepemilikan 102 dalam pengajuan SEC terbaru mereka. Nilai portofolio terbaru dihitung sebesar $ 1,655,635,633 USD. Aset yang Dikelola (AUM) sebenarnya adalah nilai ini ditambah kas (yang tidak diungkapkan). Aset-aset utama DQIAX - BNY Mellon Equity Income Fund Class A adalah Microsoft Corporation (US:MSFT) , NVIDIA Corporation (US:NVDA) , Apple Inc. (US:AAPL) , Broadcom Inc. (US:AVGO) , and Amazon.com, Inc. (US:AMZN) . Posisi baru DQIAX - BNY Mellon Equity Income Fund Class A meliputi: The J. M. Smucker Company (US:SJM) , Northern Trust Corporation (US:NTRS) , Amcor plc (US:AMCR) , NRG Energy, Inc. (US:NRG) , and Edison International (US:EIX) .
Peningkatan Tertinggi Kuartal Ini
Kami menggunakan perubahan dalam alokasi portofolio karena ini adalah metrik yang paling bermakna. Perubahan dapat disebabkan oleh perdagangan atau perubahan harga saham.
| Keamanan | Saham (MM) |
Nilai (Juta Dolar AS) |
Portfolio % | ΔPorsyento ng Portfolio |
|---|---|---|---|---|
| 0.24 | 110.89 | 6.6969 | 0.8871 | |
| 14.56 | 14.56 | 0.8795 | 0.8795 | |
| 0.12 | 13.12 | 0.7926 | 0.7926 | |
| 0.30 | 73.11 | 4.4151 | 0.7559 | |
| 0.05 | 8.56 | 0.5170 | 0.5170 | |
| 0.02 | 25.42 | 1.5350 | 0.4960 | |
| 0.32 | 58.05 | 3.5055 | 0.4732 | |
| 0.73 | 99.03 | 5.9807 | 0.4187 | |
| 0.11 | 10.50 | 0.6340 | 0.3824 | |
| 0.65 | 28.73 | 1.7350 | 0.3643 |
Penurunan Tertinggi Kuartal Ini
Kami menggunakan perubahan dalam alokasi portofolio karena ini adalah metrik yang paling bermakna. Perubahan dapat disebabkan oleh perdagangan atau perubahan harga saham.
| Keamanan | Saham (MM) |
Nilai (Juta Dolar AS) |
Portfolio % | ΔPorsyento ng Portfolio |
|---|---|---|---|---|
| 0.45 | 90.93 | 5.4915 | -1.1605 | |
| 0.05 | 7.19 | 0.4343 | -1.0345 | |
| 0.65 | 31.44 | 1.8986 | -0.4600 | |
| 0.01 | 1.79 | 0.1081 | -0.4299 | |
| 0.03 | 1.65 | 0.0999 | -0.4271 | |
| 0.28 | 15.78 | 0.9532 | -0.3510 | |
| 0.46 | 37.81 | 2.2836 | -0.2640 | |
| 0.14 | 11.68 | 0.7051 | -0.1758 | |
| 0.29 | 60.18 | 3.6344 | -0.1515 | |
| 0.14 | 16.20 | 0.9782 | -0.1465 |
Pengajuan 13F dan Dana
Formulir ini diajukan pada 2025-07-23 untuk periode pelaporan 2025-05-31. Klik ikon tautan untuk melihat riwayat transaksi selengkapnya.
Tingkatkan ke versi premium untuk membuka data premium dan ekspor ke Excel. ![]() .
.
| Keamanan | Ketik | Harga Saham Rata-rata | Saham (MM) |
ΔSaham (%) |
ΔSaham (%) |
Nilai ($MM) |
Portpolyo (%) |
ΔPortofolio (%) |
|
|---|---|---|---|---|---|---|---|---|---|
| MSFT / Microsoft Corporation | 0.24 | -0.72 | 110.89 | 15.12 | 6.6969 | 0.8871 | |||
| NVDA / NVIDIA Corporation | 0.73 | -0.72 | 99.03 | 7.39 | 5.9807 | 0.4187 | |||
| AAPL / Apple Inc. | 0.45 | -0.72 | 90.93 | -17.55 | 5.4915 | -1.1605 | |||
| AVGO / Broadcom Inc. | 0.30 | -0.72 | 73.11 | 20.50 | 4.4151 | 0.7559 | |||
| AMZN / Amazon.com, Inc. | 0.29 | -0.72 | 60.18 | -4.12 | 3.6344 | -0.1515 | |||
| PM / Philip Morris International Inc. | 0.32 | -0.72 | 58.05 | 15.46 | 3.5055 | 0.4732 | |||
| JPM / JPMorgan Chase & Co. | 0.21 | -0.72 | 55.52 | -0.97 | 3.3527 | -0.0285 | |||
| VZ / Verizon Communications Inc. | 1.17 | -0.72 | 51.51 | 1.26 | 3.1109 | 0.0425 | |||
| MO / Altria Group, Inc. | 0.78 | -0.72 | 47.26 | 7.74 | 2.8539 | 0.2083 | |||
| MDT / Medtronic plc | 0.46 | -0.72 | 37.81 | -10.48 | 2.2836 | -0.2640 | |||
| META / Meta Platforms, Inc. | 0.06 | -0.72 | 36.56 | -3.80 | 2.2077 | -0.0843 | |||
| T / AT&T Inc. | 1.29 | -0.72 | 35.74 | 0.69 | 2.1587 | 0.0175 | |||
| TSLA / Tesla, Inc. | 0.09 | -0.72 | 32.61 | 17.40 | 1.9693 | 0.2940 | |||
| GOOGL / Alphabet Inc. | 0.18 | -0.72 | 31.56 | 0.13 | 1.9062 | 0.0048 | |||
| BMY / Bristol-Myers Squibb Company | 0.65 | -0.72 | 31.44 | -19.61 | 1.8986 | -0.4600 | |||
| JNJ / Johnson & Johnson | 0.20 | 20.88 | 30.74 | 13.70 | 1.8566 | 0.2257 | |||
| CSCO / Cisco Systems, Inc. | 0.46 | -0.72 | 28.92 | -2.38 | 1.7465 | -0.0403 | |||
| BAC / Bank of America Corporation | 0.65 | 32.06 | 28.73 | 26.42 | 1.7350 | 0.3643 | |||
| GOOG / Alphabet Inc. | 0.16 | -0.72 | 27.09 | -0.36 | 1.6360 | -0.0038 | |||
| TDG / TransDigm Group Incorporated | 0.02 | 37.37 | 25.42 | 47.55 | 1.5350 | 0.4960 | |||
| DRI / Darden Restaurants, Inc. | 0.11 | -0.72 | 23.84 | 6.09 | 1.4400 | 0.0843 | |||
| ALL / The Allstate Corporation | 0.11 | -0.72 | 23.54 | 4.62 | 1.4217 | 0.0645 | |||
| QCOM / QUALCOMM Incorporated | 0.15 | -0.72 | 21.63 | -8.29 | 1.3063 | -0.1162 | |||
| GS / The Goldman Sachs Group, Inc. | 0.03 | -0.72 | 19.95 | -4.21 | 1.2048 | -0.0513 | |||
| GILD / Gilead Sciences, Inc. | 0.16 | -0.72 | 18.05 | -4.40 | 1.0900 | -0.0487 | |||
| LMT / Lockheed Martin Corporation | 0.04 | -0.72 | 17.01 | 6.33 | 1.0274 | 0.0624 | |||
| PAYX / Paychex, Inc. | 0.11 | 24.23 | 16.74 | 29.35 | 1.0111 | 0.2304 | |||
| CEG / Constellation Energy Corporation | 0.05 | -0.72 | 16.30 | 21.31 | 0.9846 | 0.1740 | |||
| PSX / Phillips 66 | 0.14 | -0.72 | 16.20 | -13.13 | 0.9782 | -0.1465 | |||
| LYB / LyondellBasell Industries N.V. | 0.28 | -0.72 | 15.78 | -27.00 | 0.9532 | -0.3510 | |||
| STT / State Street Corporation | 0.16 | -0.72 | 15.58 | -3.67 | 0.9409 | -0.0347 | |||
| EMR / Emerson Electric Co. | 0.13 | -0.72 | 15.01 | -2.55 | 0.9062 | -0.0225 | |||
| FHN / First Horizon Corporation | 0.74 | -0.72 | 14.65 | -8.38 | 0.8846 | -0.0796 | |||
| DREYFUS INSTITUTIONAL PREFERRED GOVERNMENT PLUS MONEY MARKET FUND / STIV (000000000) | 14.56 | 14.56 | 0.8795 | 0.8795 | |||||
| BLK / BlackRock, Inc. | 0.01 | -0.72 | 14.11 | -0.51 | 0.8519 | -0.0033 | |||
| CMI / Cummins Inc. | 0.04 | -0.72 | 14.01 | -13.32 | 0.8461 | -0.1287 | |||
| PKG / Packaging Corporation of America | 0.07 | -0.72 | 13.49 | -10.00 | 0.8144 | -0.0894 | |||
| NFLX / Netflix, Inc. | 0.01 | -0.72 | 13.13 | 22.23 | 0.7927 | 0.1450 | |||
| SJM / The J. M. Smucker Company | 0.12 | 13.12 | 0.7926 | 0.7926 | |||||
| MS / Morgan Stanley | 0.10 | -0.72 | 12.60 | -4.51 | 0.7608 | -0.0349 | |||
| STX / Seagate Technology Holdings plc | 0.10 | -0.72 | 12.35 | 14.90 | 0.7458 | 0.0975 | |||
| ETR / Entergy Corporation | 0.15 | -4.44 | 12.20 | -8.86 | 0.7365 | -0.0705 | |||
| OKE / ONEOK, Inc. | 0.14 | -0.72 | 11.68 | -20.06 | 0.7051 | -0.1758 | |||
| HD / The Home Depot, Inc. | 0.03 | -0.72 | 11.63 | -7.81 | 0.7024 | -0.0585 | |||
| MRK / Merck & Co., Inc. | 0.14 | -0.72 | 10.62 | -17.31 | 0.6415 | -0.1333 | |||
| TROW / T. Rowe Price Group, Inc. | 0.11 | 184.28 | 10.50 | 151.69 | 0.6340 | 0.3824 | |||
| VLO / Valero Energy Corporation | 0.08 | -0.72 | 10.47 | -2.06 | 0.6322 | -0.0125 | |||
| XOM / Exxon Mobil Corporation | 0.10 | 37.74 | 10.39 | 26.56 | 0.6275 | 0.1323 | |||
| KMB / Kimberly-Clark Corporation | 0.07 | -0.72 | 10.30 | 0.50 | 0.6219 | 0.0039 | |||
| WMB / The Williams Companies, Inc. | 0.16 | -0.72 | 9.58 | 3.25 | 0.5788 | 0.0189 | |||
| V / Visa Inc. | 0.03 | -0.72 | 9.35 | -0.04 | 0.5648 | 0.0005 | |||
| PNC / The PNC Financial Services Group, Inc. | 0.05 | -0.72 | 8.84 | -10.09 | 0.5337 | -0.0592 | |||
| SPG / Simon Property Group, Inc. | 0.05 | 8.56 | 0.5170 | 0.5170 | |||||
| AMGN / Amgen Inc. | 0.03 | 200.99 | 8.43 | 159.85 | 0.5090 | 0.2799 | |||
| TAP / Molson Coors Beverage Company | 0.15 | 104.91 | 7.77 | 79.17 | 0.4695 | 0.2078 | |||
| KMI / Kinder Morgan, Inc. | 0.27 | 271.11 | 7.64 | 504.75 | 0.4613 | 0.3227 | |||
| FCX / Freeport-McMoRan Inc. | 0.20 | 170.87 | 7.55 | 182.45 | 0.4560 | 0.2947 | |||
| C / Citigroup Inc. | 0.10 | -0.72 | 7.52 | -6.47 | 0.4543 | -0.0308 | |||
| FANG / Diamondback Energy, Inc. | 0.05 | -65.11 | 7.19 | -70.47 | 0.4343 | -1.0345 | |||
| USB / U.S. Bancorp | 0.16 | -0.72 | 6.95 | -7.74 | 0.4197 | -0.0346 | |||
| IP / International Paper Company | 0.14 | 292.60 | 6.92 | 233.19 | 0.4178 | 0.2925 | |||
| JCI / Johnson Controls International plc | 0.07 | -0.72 | 6.84 | 17.49 | 0.4130 | 0.0619 | |||
| BXP / Boston Properties, Inc. | 0.08 | -0.72 | 5.15 | -5.76 | 0.3111 | -0.0186 | |||
| HPE / Hewlett Packard Enterprise Company | 0.30 | -0.72 | 5.11 | -13.40 | 0.3083 | -0.0473 | |||
| DLB / Dolby Laboratories, Inc. | 0.07 | -0.72 | 4.98 | -9.66 | 0.3005 | -0.0317 | |||
| NTRS / Northern Trust Corporation | 0.04 | 4.60 | 0.2778 | 0.2778 | |||||
| CAG / Conagra Brands, Inc. | 0.20 | -0.72 | 4.53 | -11.04 | 0.2735 | -0.0335 | |||
| BBY / Best Buy Co., Inc. | 0.07 | -0.72 | 4.35 | -26.83 | 0.2626 | -0.0958 | |||
| PFE / Pfizer Inc. | 0.18 | -0.72 | 4.30 | -11.75 | 0.2598 | -0.0343 | |||
| OGE / OGE Energy Corp. | 0.10 | -0.72 | 4.24 | -4.61 | 0.2560 | -0.0120 | |||
| SYY / Sysco Corporation | 0.06 | -0.72 | 4.07 | -4.08 | 0.2460 | -0.0101 | |||
| ESS / Essex Property Trust, Inc. | 0.01 | -0.72 | 4.06 | -9.54 | 0.2451 | -0.0255 | |||
| AEP / American Electric Power Company, Inc. | 0.04 | -0.72 | 4.02 | -3.11 | 0.2426 | -0.0075 | |||
| SWKS / Skyworks Solutions, Inc. | 0.06 | 3.93 | 0.2373 | 0.2373 | |||||
| ITW / Illinois Tool Works Inc. | 0.02 | -0.72 | 3.91 | -7.82 | 0.2364 | -0.0198 | |||
| NTAP / NetApp, Inc. | 0.04 | 3.88 | 0.2342 | 0.2342 | |||||
| GLW / Corning Incorporated | 0.08 | -0.72 | 3.86 | -1.83 | 0.2331 | -0.0040 | |||
| PPL / PPL Corporation | 0.11 | -0.72 | 3.82 | -2.03 | 0.2308 | -0.0045 | |||
| AVB / AvalonBay Communities, Inc. | 0.02 | -0.72 | 3.80 | -9.25 | 0.2293 | -0.0230 | |||
| HBAN / Huntington Bancshares Incorporated | 0.23 | -0.72 | 3.67 | -5.80 | 0.2216 | -0.0133 | |||
| ED / Consolidated Edison, Inc. | 0.03 | -0.72 | 3.60 | 2.19 | 0.2174 | 0.0049 | |||
| HUBB / Hubbell Incorporated | 0.01 | -0.72 | 3.60 | 4.08 | 0.2172 | 0.0088 | |||
| AMCR / Amcor plc | 0.39 | 3.59 | 0.2171 | 0.2171 | |||||
| COG / Cabot Oil & Gas Corp. | 0.15 | -0.72 | 3.54 | -10.60 | 0.2135 | -0.0250 | |||
| FE / FirstEnergy Corp. | 0.08 | -0.72 | 3.41 | 7.38 | 0.2057 | 0.0144 | |||
| EQR / Equity Residential | 0.05 | -0.72 | 3.26 | -6.14 | 0.1968 | -0.0126 | |||
| WEN / The Wendy's Company | 0.27 | 305.28 | 3.08 | 198.16 | 0.1862 | 0.1238 | |||
| CMCSA / Comcast Corporation | 0.09 | -0.72 | 3.02 | -4.37 | 0.1825 | -0.0081 | |||
| DOW / Dow Inc. | 0.11 | -0.72 | 2.95 | -27.75 | 0.1784 | -0.0682 | |||
| RL / Ralph Lauren Corporation | 0.01 | -0.73 | 2.91 | 1.36 | 0.1755 | 0.0026 | |||
| NRG / NRG Energy, Inc. | 0.02 | 2.59 | 0.1563 | 0.1563 | |||||
| HPQ / HP Inc. | 0.09 | -0.72 | 2.18 | -19.93 | 0.1316 | -0.0325 | |||
| PRU / Prudential Financial, Inc. | 0.02 | -0.72 | 2.12 | -10.39 | 0.1282 | -0.0147 | |||
| TGT / Target Corporation | 0.02 | -0.72 | 2.04 | -24.90 | 0.1230 | -0.0405 | |||
| CF / CF Industries Holdings, Inc. | 0.02 | 1.88 | 0.1134 | 0.1134 | |||||
| EXC / Exelon Corporation | 0.04 | -0.72 | 1.86 | -1.58 | 0.1126 | -0.0017 | |||
| CME / CME Group Inc. | 0.01 | -82.38 | 1.79 | -79.93 | 0.1081 | -0.4299 | |||
| D / Dominion Energy, Inc. | 0.03 | -81.08 | 1.65 | -81.07 | 0.0999 | -0.4271 | |||
| EIX / Edison International | 0.03 | 1.55 | 0.0938 | 0.0938 | |||||
| PG / The Procter & Gamble Company | 0.01 | -0.73 | 1.51 | -2.96 | 0.0911 | -0.0027 | |||
| WU / The Western Union Company | 0.13 | -0.72 | 1.21 | -14.94 | 0.0729 | -0.0127 | |||
| DREYFUS INSTITUTIONAL PREFERRED GOVERNMENT PLUS MONEY MARKET FUND / STIV (000000000) | 0.37 | 0.37 | 0.0221 | 0.0221 |