Mga Batayang Estadistika
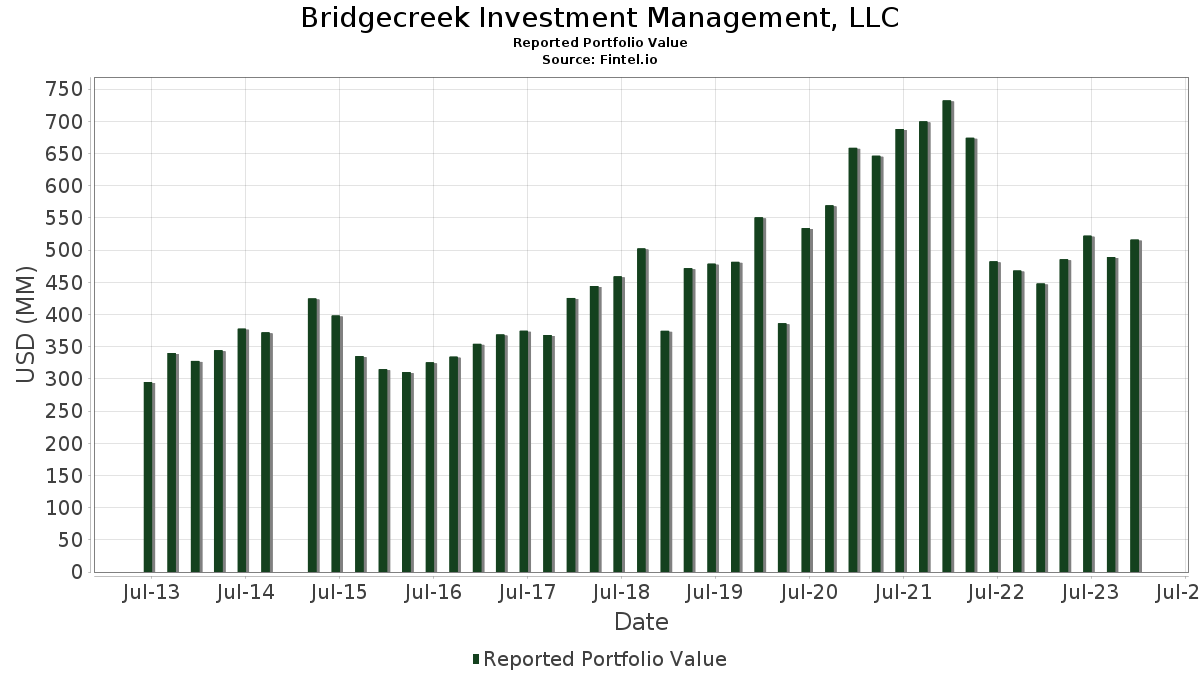
| Nilai Portofolio | $ 516,162,872 |
| Posisi Saat Ini | 95 |
Kepemilikan Terbaru, Kinerja, AUM (dari 13F, 13D)
Bridgecreek Investment Management, LLC telah mengungkapkan total kepemilikan 95 dalam pengajuan SEC terbaru mereka. Nilai portofolio terbaru dihitung sebesar $ 516,162,872 USD. Aset yang Dikelola (AUM) sebenarnya adalah nilai ini ditambah kas (yang tidak diungkapkan). Aset-aset utama Bridgecreek Investment Management, LLC adalah NVIDIA Corporation (US:NVDA) , Apple Inc. (US:AAPL) , Amazon.com, Inc. (US:AMZN) , IDEXX Laboratories, Inc. (US:IDXX) , and Intuitive Surgical, Inc. (US:ISRG) . Posisi baru Bridgecreek Investment Management, LLC meliputi: Dutch Bros Inc. (US:BROS) , The Select Sector SPDR Trust - The Technology Select Sector SPDR Fund (US:XLK) , Medical Properties Trust, Inc. (US:MPW) , .
Peningkatan Tertinggi Kuartal Ini
Kami menggunakan perubahan dalam alokasi portofolio karena ini adalah metrik yang paling bermakna. Perubahan dapat disebabkan oleh perdagangan atau perubahan harga saham.
| Keamanan | Saham (MM) |
Nilai (Juta Dolar AS) |
Portfolio % | ΔPorsyento ng Portfolio |
|---|---|---|---|---|
| 0.20 | 29.66 | 5.7467 | 0.6437 | |
| 0.05 | 25.25 | 4.8917 | 0.6433 | |
| 0.07 | 18.00 | 3.4868 | 0.5777 | |
| 0.09 | 46.16 | 8.9428 | 0.5009 | |
| 0.04 | 20.91 | 4.0518 | 0.2815 | |
| 0.24 | 14.19 | 2.7488 | 0.2703 | |
| 0.02 | 6.46 | 1.2506 | 0.2300 | |
| 0.42 | 6.31 | 1.2227 | 0.2227 | |
| 0.01 | 1.12 | 0.2171 | 0.2171 | |
| 0.02 | 3.69 | 0.7144 | 0.1815 |
Penurunan Tertinggi Kuartal Ini
Kami menggunakan perubahan dalam alokasi portofolio karena ini adalah metrik yang paling bermakna. Perubahan dapat disebabkan oleh perdagangan atau perubahan harga saham.
| Keamanan | Saham (MM) |
Nilai (Juta Dolar AS) |
Portfolio % | ΔPorsyento ng Portfolio |
|---|---|---|---|---|
| 0.07 | 13.68 | 2.6511 | -0.9735 | |
| 0.09 | 0.00 | 0.0005 | -0.6983 | |
| 0.03 | 0.84 | 0.1623 | -0.4475 | |
| 0.03 | 8.41 | 1.6292 | -0.4298 | |
| 0.18 | 35.00 | 6.7813 | -0.2580 | |
| 0.04 | 9.00 | 1.7431 | -0.2372 | |
| 0.19 | 4.95 | 0.9595 | -0.2177 | |
| 0.13 | 6.02 | 1.1668 | -0.1914 | |
| 0.00 | 0.24 | 0.0473 | -0.1912 | |
| 0.03 | 10.83 | 2.0980 | -0.1874 |
Pengajuan 13F dan Dana
Formulir ini diajukan pada 2024-02-13 untuk periode pelaporan 2023-12-31. Klik ikon tautan untuk melihat riwayat transaksi selengkapnya.
Tingkatkan ke versi premium untuk membuka data premium dan ekspor ke Excel. ![]() .
.
| Keamanan | Ketik | Harga Saham Rata-rata | Saham (MM) |
ΔSaham (%) |
ΔSaham (%) |
Nilai ($MM) |
Portpolyo (%) |
ΔPortofolio (%) |
|
|---|---|---|---|---|---|---|---|---|---|
| NVDA / NVIDIA Corporation | 0.09 | -1.84 | 46.16 | 11.75 | 8.9428 | 0.5009 | |||
| AAPL / Apple Inc. | 0.18 | -9.63 | 35.00 | 1.62 | 6.7813 | -0.2580 | |||
| AMZN / Amazon.com, Inc. | 0.20 | -0.61 | 29.66 | 18.80 | 5.7467 | 0.6437 | |||
| IDXX / IDEXX Laboratories, Inc. | 0.05 | -4.31 | 25.25 | 21.47 | 4.8917 | 0.6433 | |||
| ISRG / Intuitive Surgical, Inc. | 0.07 | -4.93 | 23.17 | 9.73 | 4.4892 | 0.1733 | |||
| ADBE / Adobe Inc. | 0.04 | -3.11 | 20.91 | 13.36 | 4.0518 | 0.2815 | |||
| CRM / Salesforce, Inc. | 0.07 | -2.56 | 18.00 | 26.44 | 3.4868 | 0.5777 | |||
| MSCI / MSCI Inc. | 0.03 | -6.85 | 16.99 | 2.69 | 3.2915 | -0.0897 | |||
| MS / Morgan Stanley | 0.16 | -5.15 | 15.14 | 8.29 | 2.9336 | 0.0760 | |||
| APO / Apollo Global Management, Inc. | 0.15 | -1.05 | 14.42 | 2.73 | 2.7939 | -0.0751 | |||
| SUN / Sunoco LP - Limited Partnership | 0.24 | -4.44 | 14.19 | 17.00 | 2.7488 | 0.2703 | |||
| PAYC / Paycom Software, Inc. | 0.07 | -3.23 | 13.68 | -22.85 | 2.6511 | -0.9735 | |||
| UNH / UnitedHealth Group Incorporated | 0.03 | -0.58 | 13.53 | 3.81 | 2.6211 | -0.0423 | |||
| PSX / Phillips 66 | 0.10 | -2.97 | 13.28 | 7.52 | 2.5738 | 0.0487 | |||
| OKE / ONEOK, Inc. | 0.17 | 2.00 | 11.78 | 12.91 | 2.2830 | 0.1501 | |||
| MA / Mastercard Incorporated | 0.03 | -10.11 | 10.83 | -3.16 | 2.0980 | -0.1874 | |||
| JPM / JPMorgan Chase & Co. | 0.06 | -5.24 | 9.93 | 11.15 | 1.9229 | 0.0980 | |||
| TSLA / Tesla, Inc. | 0.04 | -6.49 | 9.00 | -7.14 | 1.7431 | -0.2372 | |||
| STZ / Constellation Brands, Inc. | 0.03 | -13.22 | 8.41 | -16.53 | 1.6292 | -0.4298 | |||
| WMT / Walmart Inc. | 0.05 | -0.69 | 7.36 | -2.10 | 1.4253 | -0.1106 | |||
| AB / AllianceBernstein Holding L.P. - Limited Partnership | 0.22 | -2.19 | 6.92 | 0.00 | 1.3415 | -0.0736 | |||
| TMUS / T-Mobile US, Inc. | 0.04 | -1.78 | 6.62 | 12.43 | 1.2824 | 0.0793 | |||
| MSFT / Microsoft Corporation | 0.02 | 8.54 | 6.46 | 29.28 | 1.2506 | 0.2300 | |||
| OWL / Blue Owl Capital Inc. | 0.42 | 12.18 | 6.31 | 28.98 | 1.2227 | 0.2227 | |||
| DVN / Devon Energy Corporation | 0.13 | -4.58 | 6.02 | -9.38 | 1.1668 | -0.1914 | |||
| OGE / OGE Energy Corp. | 0.15 | 3.99 | 5.41 | 8.98 | 1.0489 | 0.0336 | |||
| PRU / Prudential Financial, Inc. | 0.05 | -0.78 | 5.29 | 8.44 | 1.0257 | 0.0280 | |||
| FTXP / Foothills Exploration, Inc. | 0.01 | 0.09 | 5.24 | 26.86 | 1.0158 | 0.1711 | |||
| CVS / CVS Health Corporation | 0.07 | -17.60 | 5.23 | -6.81 | 1.0131 | -0.1338 | |||
| STWD / Starwood Property Trust, Inc. | 0.24 | -7.31 | 5.14 | 0.69 | 0.9949 | -0.0474 | |||
| GNRC / Generac Holdings Inc. | 0.04 | -5.94 | 5.02 | 11.57 | 0.9717 | 0.0530 | |||
| EPD / Enterprise Products Partners L.P. - Limited Partnership | 0.19 | -10.69 | 4.95 | -14.03 | 0.9595 | -0.2177 | |||
| EVRG / Evergy, Inc. | 0.09 | 10.68 | 4.67 | 13.95 | 0.9039 | 0.0672 | |||
| FANG / Diamondback Energy, Inc. | 0.03 | -8.32 | 4.65 | -8.21 | 0.9016 | -0.1345 | |||
| TXRH / Texas Roadhouse, Inc. | 0.04 | -1.25 | 4.59 | 25.59 | 0.8902 | 0.1426 | |||
| PANW / Palo Alto Networks, Inc. | 0.02 | 0.00 | 4.47 | 25.79 | 0.8665 | 0.1398 | |||
| MKTX / MarketAxess Holdings Inc. | 0.02 | -5.06 | 4.40 | 30.18 | 0.8525 | 0.1615 | |||
| MRK / Merck & Co., Inc. | 0.04 | -15.85 | 4.40 | -10.88 | 0.8519 | -0.1566 | |||
| WMB / The Williams Companies, Inc. | 0.12 | -0.46 | 4.18 | 2.90 | 0.8101 | -0.0203 | |||
| MELI / MercadoLibre, Inc. | 0.00 | -18.63 | 4.12 | 0.88 | 0.7980 | -0.0366 | |||
| MAR / Marriott International, Inc. | 0.02 | -1.42 | 3.91 | 13.11 | 0.7571 | 0.0509 | |||
| SCHW / The Charles Schwab Corporation | 0.06 | -1.34 | 3.79 | 23.61 | 0.7334 | 0.1076 | |||
| AMT / American Tower Corporation | 0.02 | 7.73 | 3.69 | 41.43 | 0.7144 | 0.1815 | |||
| DELL / Dell Technologies Inc. | 0.05 | -1.57 | 3.60 | 9.30 | 0.6966 | 0.0242 | |||
| PXD / Pioneer Natural Resources Company | 0.01 | -2.32 | 3.08 | -4.32 | 0.5969 | -0.0611 | |||
| SMG / The Scotts Miracle-Gro Company | 0.05 | 4.37 | 2.89 | 28.78 | 0.5601 | 0.1012 | |||
| XOM / Exxon Mobil Corporation | 0.03 | 3.53 | 2.57 | -11.94 | 0.4972 | -0.0986 | |||
| BXMT / Blackstone Mortgage Trust, Inc. | 0.10 | -10.84 | 2.16 | -12.79 | 0.4187 | -0.0878 | |||
| NOW / ServiceNow, Inc. | 0.00 | 0.00 | 2.12 | 26.43 | 0.4116 | 0.0681 | |||
| BAC / Bank of America Corporation | 0.06 | -34.03 | 2.12 | -18.86 | 0.4110 | -0.1234 | |||
| CWH / Camping World Holdings, Inc. | 0.08 | -19.79 | 2.05 | 3.17 | 0.3970 | -0.0088 | |||
| FCX / Freeport-McMoRan Inc. | 0.04 | 0.00 | 1.69 | 14.17 | 0.3278 | 0.0249 | |||
| ABBV / AbbVie Inc. | 0.01 | -15.25 | 1.51 | -11.87 | 0.2921 | -0.0576 | |||
| SNEX / StoneX Group Inc. | 0.02 | 50.00 | 1.38 | 14.29 | 0.2682 | 0.0206 | |||
| TSM / Taiwan Semiconductor Manufacturing Company Limited - Depositary Receipt (Common Stock) | 0.01 | 1.12 | 0.2171 | 0.2171 | |||||
| ONON / On Holding AG | 0.04 | 12.22 | 1.10 | 8.84 | 0.2124 | 0.0064 | |||
| BROS / Dutch Bros Inc. | 0.03 | 0.92 | 0.1776 | 0.1776 | |||||
| XLK / The Select Sector SPDR Trust - The Technology Select Sector SPDR Fund | 0.00 | 0.88 | 0.1703 | 0.1703 | |||||
| CVX / Chevron Corporation | 0.01 | -2.13 | 0.86 | -13.37 | 0.1657 | -0.0362 | |||
| JD / JD.com, Inc. - Depositary Receipt (Common Stock) | 0.03 | -71.69 | 0.84 | -71.95 | 0.1623 | -0.4475 | |||
| WST / West Pharmaceutical Services, Inc. | 0.00 | 0.00 | 0.78 | -6.12 | 0.1518 | -0.0188 | |||
| SQ / Block, Inc. | 0.01 | 0.00 | 0.77 | 74.89 | 0.1499 | 0.0594 | |||
| PRGS / Progress Software Corporation | 0.01 | -5.72 | 0.76 | -2.56 | 0.1473 | -0.0123 | |||
| CSCO / Cisco Systems, Inc. | 0.02 | 0.00 | 0.76 | -6.06 | 0.1472 | -0.0180 | |||
| KDP / Keurig Dr Pepper Inc. | 0.02 | 0.00 | 0.73 | 5.52 | 0.1408 | 0.0001 | |||
| MPW / Medical Properties Trust, Inc. | 0.13 | 0.63 | 0.1218 | 0.1218 | |||||
| ENPH / Enphase Energy, Inc. | 0.00 | -9.60 | 0.59 | -0.51 | 0.1146 | -0.0070 | |||
| BRK.A / Berkshire Hathaway Inc. | 0.00 | -11.76 | 0.53 | -10.25 | 0.1036 | -0.0181 | |||
| CHKP / Check Point Software Technologies Ltd. | 0.00 | 0.00 | 0.53 | 14.59 | 0.1036 | 0.0083 | |||
| NLY / Annaly Capital Management, Inc. | 0.03 | 0.00 | 0.51 | 3.01 | 0.0994 | -0.0024 | |||
| MSA / MSA Safety Incorporated | 0.00 | 0.00 | 0.51 | 7.20 | 0.0981 | 0.0015 | |||
| HPQ / HP Inc. | 0.02 | 0.00 | 0.48 | 17.00 | 0.0921 | 0.0091 | |||
| IWF / iShares Trust - iShares Russell 1000 Growth ETF | 0.00 | 0.00 | 0.45 | 14.07 | 0.0881 | 0.0066 | |||
| CPB / The Campbell's Company | 0.01 | 0.00 | 0.43 | 5.37 | 0.0838 | -0.0002 | |||
| DVA / DaVita Inc. | 0.00 | 0.00 | 0.37 | 10.91 | 0.0710 | 0.0034 | |||
| NGL / NGL Energy Partners LP - Limited Partnership | 0.06 | 0.00 | 0.33 | 43.97 | 0.0647 | 0.0173 | |||
| ITW / Illinois Tool Works Inc. | 0.00 | 0.00 | 0.33 | 13.84 | 0.0638 | 0.0046 | |||
| PAYX / Paychex, Inc. | 0.00 | 0.00 | 0.31 | 3.29 | 0.0609 | -0.0013 | |||
| AMGN / Amgen Inc. | 0.00 | 0.00 | 0.29 | 7.46 | 0.0558 | 0.0009 | |||
| QQQ / Invesco QQQ Trust, Series 1 | 0.00 | 0.00 | 0.29 | 14.40 | 0.0555 | 0.0043 | |||
| SPY / SPDR S&P 500 ETF | 0.00 | 0.00 | 0.29 | 11.33 | 0.0553 | 0.0028 | |||
| COP / ConocoPhillips | 0.00 | 0.72 | 0.28 | -2.48 | 0.0534 | -0.0043 | |||
| JEPQ / J.P. Morgan Exchange-Traded Fund Trust - JPMorgan Nasdaq Equity Premium Income ETF | 0.01 | 0.00 | 0.27 | 7.06 | 0.0530 | 0.0008 | |||
| HPE / Hewlett Packard Enterprise Company | 0.02 | 0.00 | 0.27 | -2.19 | 0.0520 | -0.0041 | |||
| BA / The Boeing Company | 0.00 | 0.26 | 0.0511 | 0.0511 | |||||
| IWM / iShares Trust - iShares Russell 2000 ETF | 0.00 | 0.00 | 0.25 | 13.43 | 0.0476 | 0.0034 | |||
| XLE / The Select Sector SPDR Trust - The Energy Select Sector SPDR Fund | 0.00 | -77.44 | 0.24 | -79.09 | 0.0473 | -0.1912 | |||
| LNG / Cheniere Energy, Inc. | 0.00 | 0.00 | 0.21 | 2.90 | 0.0413 | -0.0011 | |||
| AAON / AAON, Inc. | 0.00 | 0.21 | 0.0398 | 0.0398 | |||||
| MHF / Western Asset Municipal High Income Fund Inc. | 0.03 | 0.00 | 0.19 | 5.49 | 0.0373 | -0.0000 | |||
| NAD / Nuveen Quality Municipal Income Fund | 0.01 | 0.00 | 0.17 | 12.50 | 0.0333 | 0.0022 | |||
| CHPT / ChargePoint Holdings, Inc. | 0.01 | 0.03 | 0.0063 | 0.0063 | |||||
| IHRT / iHeartMedia, Inc. | 0.01 | 0.00 | 0.03 | -16.13 | 0.0052 | -0.0013 | |||
| MYMD / MyMD Pharmaceuticals, Inc. | 0.03 | 0.00 | 0.01 | -58.82 | 0.0015 | -0.0021 | |||
| BIP / Brookfield Infrastructure Partners L.P. - Limited Partnership | 0.09 | -24.59 | 0.00 | -99.94 | 0.0005 | -0.6983 | |||
| PSA / Public Storage | 0.00 | -100.00 | 0.00 | -100.00 | -0.0646 | ||||
| K / Kellanova | 0.00 | -100.00 | 0.00 | 0.0000 | |||||
| GNSS / Genasys Inc. | 0.00 | -100.00 | 0.00 | 0.0000 | |||||
| SJM / The J. M. Smucker Company | 0.00 | -100.00 | 0.00 | 0.0000 | |||||
| DIA / SPDR Dow Jones Industrial Average ETF Trust | 0.00 | -100.00 | 0.00 | -100.00 | -0.0431 | ||||
| SPYD / SPDR Series Trust - SPDR Portfolio S&P 500 High Dividend ETF | 0.00 | -100.00 | 0.00 | 0.0000 | |||||
| PFE / Pfizer Inc. | 0.00 | -100.00 | 0.00 | -100.00 | -0.0489 | ||||
| JCI / Johnson Controls International plc | 0.00 | -100.00 | 0.00 | 0.0000 |