Mga Batayang Estadistika
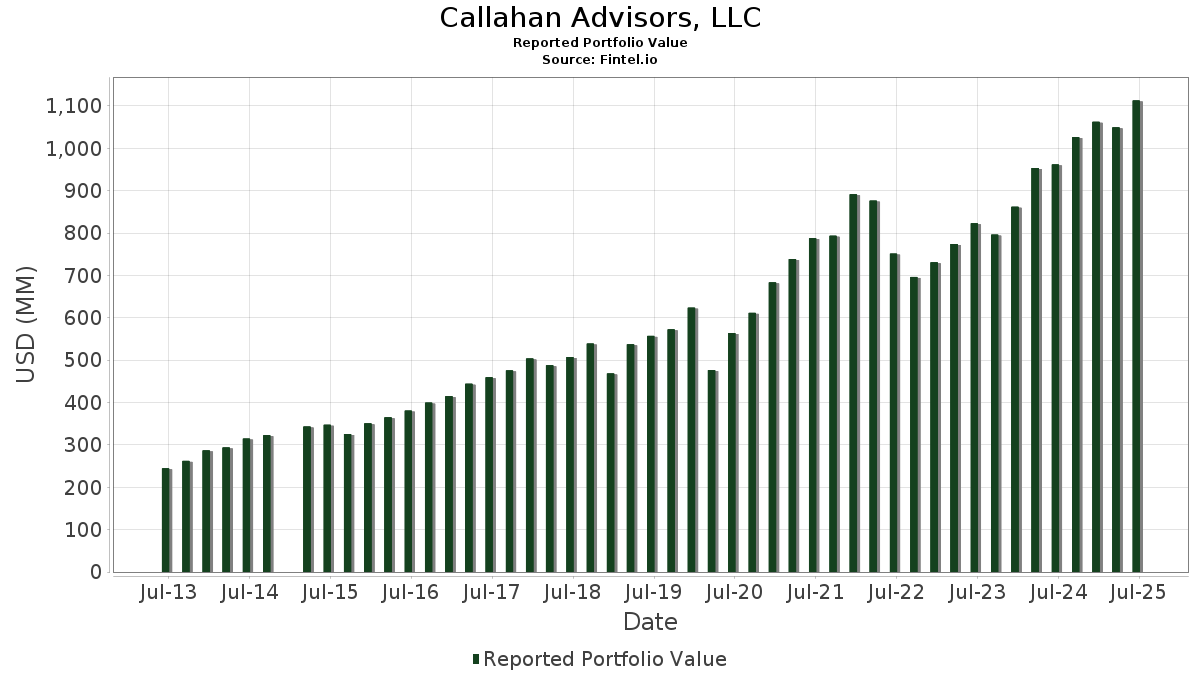
| Nilai Portofolio | $ 1,112,725,415 |
| Posisi Saat Ini | 173 |
Kepemilikan Terbaru, Kinerja, AUM (dari 13F, 13D)
Callahan Advisors, LLC telah mengungkapkan total kepemilikan 173 dalam pengajuan SEC terbaru mereka. Nilai portofolio terbaru dihitung sebesar $ 1,112,725,415 USD. Aset yang Dikelola (AUM) sebenarnya adalah nilai ini ditambah kas (yang tidak diungkapkan). Aset-aset utama Callahan Advisors, LLC adalah Meta Platforms, Inc. (US:META) , Microsoft Corporation (US:MSFT) , Amazon.com, Inc. (US:AMZN) , Alphabet Inc. (US:GOOG) , and Apple Inc. (US:AAPL) . Posisi baru Callahan Advisors, LLC meliputi: Lam Research Corporation (US:LRCX) , General Electric Company (US:GE) , Canadian Pacific Kansas City Limited (US:CP) , Palo Alto Networks, Inc. (IT:1PANW) , and GE Vernova Inc. (US:GEV) .
Peningkatan Tertinggi Kuartal Ini
Kami menggunakan perubahan dalam alokasi portofolio karena ini adalah metrik yang paling bermakna. Perubahan dapat disebabkan oleh perdagangan atau perubahan harga saham.
| Keamanan | Saham (MM) |
Nilai (Juta Dolar AS) |
Portfolio % | ΔPorsyento ng Portfolio |
|---|---|---|---|---|
| 0.10 | 75.55 | 6.7898 | 1.1357 | |
| 0.12 | 61.99 | 5.5711 | 1.1099 | |
| 0.15 | 23.57 | 2.1186 | 0.8052 | |
| 0.22 | 48.57 | 4.3651 | 0.4405 | |
| 0.27 | 48.33 | 4.3431 | 0.3953 | |
| 0.00 | 25.78 | 2.3168 | 0.3903 | |
| 0.03 | 5.79 | 0.5204 | 0.3268 | |
| 0.30 | 20.82 | 1.8713 | 0.3163 | |
| 0.48 | 29.75 | 2.6736 | 0.3100 | |
| 0.08 | 5.29 | 0.4752 | 0.2662 |
Penurunan Tertinggi Kuartal Ini
Kami menggunakan perubahan dalam alokasi portofolio karena ini adalah metrik yang paling bermakna. Perubahan dapat disebabkan oleh perdagangan atau perubahan harga saham.
| Keamanan | Saham (MM) |
Nilai (Juta Dolar AS) |
Portfolio % | ΔPorsyento ng Portfolio |
|---|---|---|---|---|
| 0.05 | 15.04 | 1.3517 | -0.9872 | |
| 0.15 | 30.82 | 2.7699 | -0.6734 | |
| 0.03 | 2.08 | 0.1873 | -0.5551 | |
| 0.03 | 3.29 | 0.2959 | -0.5352 | |
| 0.13 | 4.24 | 0.3810 | -0.5280 | |
| 0.09 | 12.67 | 1.1389 | -0.4969 | |
| 0.06 | 28.36 | 2.5486 | -0.4159 | |
| 0.14 | 15.33 | 1.3780 | -0.3313 | |
| 0.12 | 18.86 | 1.6952 | -0.2812 | |
| 0.06 | 16.97 | 1.5253 | -0.2660 |
Pengajuan 13F dan Dana
Formulir ini diajukan pada 2025-07-28 untuk periode pelaporan 2025-06-30. Klik ikon tautan untuk melihat riwayat transaksi selengkapnya.
Tingkatkan ke versi premium untuk membuka data premium dan ekspor ke Excel. ![]() .
.
| Keamanan | Ketik | Harga Saham Rata-rata | Saham (MM) |
ΔSaham (%) |
ΔSaham (%) |
Nilai ($MM) |
Portpolyo (%) |
ΔPortofolio (%) |
|
|---|---|---|---|---|---|---|---|---|---|
| META / Meta Platforms, Inc. | 0.10 | -0.56 | 75.55 | 27.34 | 6.7898 | 1.1357 | |||
| MSFT / Microsoft Corporation | 0.12 | -0.06 | 61.99 | 32.43 | 5.5711 | 1.1099 | |||
| AMZN / Amazon.com, Inc. | 0.22 | 2.29 | 48.57 | 17.95 | 4.3651 | 0.4405 | |||
| GOOG / Alphabet Inc. | 0.27 | 2.74 | 48.33 | 16.66 | 4.3431 | 0.3953 | |||
| AAPL / Apple Inc. | 0.15 | -7.64 | 30.82 | -14.69 | 2.7699 | -0.6734 | |||
| BN / Brookfield Corporation | 0.48 | 1.64 | 29.75 | 19.95 | 2.6736 | 0.3100 | |||
| JPM / JPMorgan Chase & Co. | 0.10 | -1.52 | 28.70 | 16.38 | 2.5797 | 0.2292 | |||
| BRK.A / Berkshire Hathaway Inc. | 0.06 | -0.05 | 28.36 | -8.83 | 2.5486 | -0.4159 | |||
| CB / Chubb Limited | 0.09 | 2.28 | 27.14 | -1.88 | 2.4390 | -0.1969 | |||
| BKNG / Booking Holdings Inc. | 0.00 | 1.48 | 25.78 | 27.53 | 2.3168 | 0.3903 | |||
| NVDA / NVIDIA Corporation | 0.15 | 17.34 | 23.57 | 71.06 | 2.1186 | 0.8052 | |||
| CAT / Caterpillar Inc. | 0.06 | 0.92 | 21.41 | 18.80 | 1.9245 | 0.2066 | |||
| NEE / NextEra Energy, Inc. | 0.30 | 30.32 | 20.82 | 27.62 | 1.8713 | 0.3163 | |||
| SYK / Stryker Corporation | 0.05 | -0.47 | 19.46 | 5.78 | 1.7485 | -0.0043 | |||
| JNJ / Johnson & Johnson | 0.12 | -1.25 | 18.86 | -9.05 | 1.6952 | -0.2812 | |||
| EQT / EQT Corporation | 0.31 | 0.67 | 18.30 | 9.89 | 1.6445 | 0.0575 | |||
| PEP / PepsiCo, Inc. | 0.13 | 2.81 | 17.23 | -9.46 | 1.5487 | -0.2652 | |||
| MCD / McDonald's Corporation | 0.06 | -3.46 | 16.97 | -9.70 | 1.5253 | -0.2660 | |||
| PG / The Procter & Gamble Company | 0.11 | 2.03 | 16.90 | -4.62 | 1.5191 | -0.1697 | |||
| PFE / Pfizer Inc. | 0.67 | 16.48 | 16.25 | 11.42 | 1.4603 | 0.0705 | |||
| MA / Mastercard Incorporated | 0.03 | 8.37 | 16.02 | 11.10 | 1.4397 | 0.0655 | |||
| FDX / FedEx Corporation | 0.07 | -3.80 | 15.50 | -10.30 | 1.3928 | -0.2538 | |||
| XOM / Exxon Mobil Corporation | 0.14 | -5.68 | 15.33 | -14.51 | 1.3780 | -0.3313 | |||
| WMT / Walmart Inc. | 0.16 | -9.89 | 15.21 | 0.37 | 1.3668 | -0.0773 | |||
| UNH / UnitedHealth Group Incorporated | 0.05 | 2.89 | 15.04 | -38.72 | 1.3517 | -0.9872 | |||
| FTNT / Fortinet, Inc. | 0.14 | -0.92 | 14.30 | 8.81 | 1.2849 | 0.0328 | |||
| AMAT / Applied Materials, Inc. | 0.08 | 1.41 | 14.05 | 27.92 | 1.2626 | 0.2159 | |||
| LLY / Eli Lilly and Company | 0.02 | 7.88 | 14.01 | 1.82 | 1.2591 | -0.0522 | |||
| LOW / Lowe's Companies, Inc. | 0.06 | -1.78 | 13.46 | -6.56 | 1.2099 | -0.1632 | |||
| CVX / Chevron Corporation | 0.09 | -13.74 | 12.67 | -26.17 | 1.1389 | -0.4969 | |||
| STE / STERIS plc | 0.05 | 15.54 | 11.48 | 22.46 | 1.0321 | 0.1383 | |||
| ABT / Abbott Laboratories | 0.08 | 0.09 | 11.46 | 2.63 | 1.0296 | -0.0343 | |||
| CTVA / Corteva, Inc. | 0.15 | 6.73 | 11.18 | 26.41 | 1.0048 | 0.1619 | |||
| CNI / Canadian National Railway Company | 0.11 | -7.90 | 11.10 | -1.68 | 0.9979 | -0.0784 | |||
| PAYX / Paychex, Inc. | 0.07 | -2.58 | 10.82 | -8.15 | 0.9728 | -0.1503 | |||
| KMI / Kinder Morgan, Inc. | 0.36 | -3.70 | 10.59 | -0.76 | 0.9516 | -0.0653 | |||
| ASML / ASML Holding N.V. - Depositary Receipt (Common Stock) | 0.01 | 17.35 | 9.54 | 41.93 | 0.8573 | 0.2167 | |||
| EXP / Eagle Materials Inc. | 0.04 | 4.68 | 9.06 | -4.67 | 0.8145 | -0.0916 | |||
| CRM / Salesforce, Inc. | 0.03 | 5.28 | 9.02 | 6.98 | 0.8110 | 0.0071 | |||
| ADBE / Adobe Inc. | 0.02 | 18.34 | 8.98 | 19.38 | 0.8073 | 0.0902 | |||
| URI / United Rentals, Inc. | 0.01 | 2.33 | 8.73 | 23.04 | 0.7843 | 0.1083 | |||
| DY / Dycom Industries, Inc. | 0.03 | -2.96 | 8.52 | 55.68 | 0.7657 | 0.2441 | |||
| ETN / Eaton Corporation plc | 0.02 | 15.13 | 8.45 | 51.20 | 0.7593 | 0.2268 | |||
| T / AT&T Inc. | 0.28 | -6.64 | 8.13 | -4.45 | 0.7307 | -0.0803 | |||
| CAH / Cardinal Health, Inc. | 0.05 | -8.44 | 8.01 | 11.64 | 0.7197 | 0.0361 | |||
| CTAS / Cintas Corporation | 0.03 | -1.20 | 7.40 | 7.14 | 0.6653 | 0.0067 | |||
| ACN / Accenture plc | 0.02 | -9.66 | 7.31 | -13.46 | 0.6573 | -0.1482 | |||
| DIS / The Walt Disney Company | 0.06 | -7.01 | 6.96 | 16.84 | 0.6254 | 0.0578 | |||
| IQV / IQVIA Holdings Inc. | 0.04 | 17.16 | 6.85 | 4.74 | 0.6157 | -0.0077 | |||
| WELL / Welltower Inc. | 0.04 | 3.92 | 6.83 | 4.28 | 0.6134 | -0.0104 | |||
| VRSK / Verisk Analytics, Inc. | 0.02 | 16.09 | 6.34 | 21.51 | 0.5702 | 0.0726 | |||
| TSM / Taiwan Semiconductor Manufacturing Company Limited - Depositary Receipt (Common Stock) | 0.03 | 108.93 | 5.79 | 185.08 | 0.5204 | 0.3268 | |||
| AXP / American Express Company | 0.02 | 0.01 | 5.69 | 18.56 | 0.5110 | 0.0540 | |||
| GOOGL / Alphabet Inc. | 0.03 | 0.22 | 5.55 | 14.21 | 0.4992 | 0.0357 | |||
| ENB / Enbridge Inc. | 0.12 | -6.82 | 5.36 | -4.71 | 0.4819 | -0.0543 | |||
| WTW / Willis Towers Watson Public Limited Company | 0.02 | 3.29 | 5.30 | -6.32 | 0.4760 | -0.0628 | |||
| TRI / Thomson Reuters Corporation | 0.03 | 0.00 | 5.29 | 16.41 | 0.4756 | 0.0423 | |||
| CVS / CVS Health Corporation | 0.08 | 136.83 | 5.29 | 141.20 | 0.4752 | 0.2662 | |||
| CSCO / Cisco Systems, Inc. | 0.07 | -4.65 | 4.66 | 7.20 | 0.4188 | 0.0045 | |||
| PAYC / Paycom Software, Inc. | 0.02 | 0.00 | 4.64 | 5.92 | 0.4167 | -0.0005 | |||
| STEL / Stellar Bancorp, Inc. | 0.16 | -2.40 | 4.55 | -1.26 | 0.4092 | -0.0303 | |||
| SLB / Schlumberger Limited | 0.13 | -45.03 | 4.24 | -55.56 | 0.3810 | -0.5280 | |||
| WDAY / Workday, Inc. | 0.02 | 2.02 | 4.02 | 4.85 | 0.3613 | -0.0041 | |||
| NOW / ServiceNow, Inc. | 0.00 | -0.87 | 3.97 | 28.03 | 0.3567 | 0.0612 | |||
| PLD / Prologis, Inc. | 0.04 | -0.04 | 3.90 | -6.01 | 0.3501 | -0.0449 | |||
| KO / The Coca-Cola Company | 0.05 | 0.53 | 3.81 | -0.70 | 0.3421 | -0.0232 | |||
| CFR / Cullen/Frost Bankers, Inc. | 0.03 | -1.82 | 3.41 | 0.80 | 0.3062 | -0.0159 | |||
| EOG / EOG Resources, Inc. | 0.03 | -59.52 | 3.29 | -62.25 | 0.2959 | -0.5352 | |||
| V / Visa Inc. | 0.01 | 4.05 | 3.28 | 5.43 | 0.2948 | -0.0018 | |||
| NTRS / Northern Trust Corporation | 0.03 | 28.59 | 3.18 | 65.30 | 0.2856 | 0.1023 | |||
| HD / The Home Depot, Inc. | 0.01 | 0.33 | 3.09 | 0.39 | 0.2780 | -0.0157 | |||
| SKWD / Skyward Specialty Insurance Group, Inc. | 0.05 | 5.53 | 3.06 | 15.23 | 0.2754 | 0.0220 | |||
| ENTG / Entegris, Inc. | 0.04 | -6.89 | 2.98 | -14.17 | 0.2679 | -0.0630 | |||
| BRK.A / Berkshire Hathaway Inc. | 0.00 | 0.00 | 2.92 | -8.71 | 0.2620 | -0.0424 | |||
| ZTS / Zoetis Inc. | 0.02 | 27.94 | 2.87 | 21.20 | 0.2580 | 0.0322 | |||
| LAZ / Lazard, Inc. | 0.06 | 2.01 | 2.83 | 13.03 | 0.2542 | 0.0157 | |||
| HSY / The Hershey Company | 0.02 | 0.00 | 2.63 | -2.95 | 0.2365 | -0.0220 | |||
| EPD / Enterprise Products Partners L.P. - Limited Partnership | 0.08 | -5.35 | 2.59 | -14.00 | 0.2330 | -0.0544 | |||
| TJX / The TJX Companies, Inc. | 0.02 | 1.22 | 2.56 | 2.60 | 0.2303 | -0.0077 | |||
| DHR / Danaher Corporation | 0.01 | 0.37 | 2.50 | -3.25 | 0.2245 | -0.0216 | |||
| PM / Philip Morris International Inc. | 0.01 | 0.34 | 2.34 | 15.16 | 0.2102 | 0.0166 | |||
| BFB / Brown-Forman Corp. - Class B | 0.09 | 0.00 | 2.33 | -20.71 | 0.2096 | -0.0707 | |||
| UL / Unilever PLC - Depositary Receipt (Common Stock) | 0.04 | 0.00 | 2.30 | 2.68 | 0.2067 | -0.0067 | |||
| LMT / Lockheed Martin Corporation | 0.00 | 21.28 | 2.18 | 25.72 | 0.1955 | 0.0306 | |||
| RTX / RTX Corporation | 0.01 | 2.41 | 2.17 | 12.90 | 0.1952 | 0.0119 | |||
| BHP / BHP Group Limited - Depositary Receipt (Common Stock) | 0.04 | -12.68 | 2.13 | -13.46 | 0.1913 | -0.0432 | |||
| GD / General Dynamics Corporation | 0.01 | 0.00 | 2.08 | 6.98 | 0.1873 | 0.0017 | |||
| GPN / Global Payments Inc. | 0.03 | -67.27 | 2.08 | -73.25 | 0.1873 | -0.5551 | |||
| MRK / Merck & Co., Inc. | 0.03 | -2.42 | 2.07 | -13.92 | 0.1856 | -0.0431 | |||
| NKE / NIKE, Inc. | 0.03 | -41.43 | 2.01 | -34.46 | 0.1807 | -0.1116 | |||
| DEO / Diageo plc - Depositary Receipt (Common Stock) | 0.02 | -2.79 | 1.83 | -6.48 | 0.1649 | -0.0220 | |||
| BFK / BlackRock Municipal Income Trust | 0.19 | -27.70 | 1.77 | -29.96 | 0.1595 | -0.0820 | |||
| IBM / International Business Machines Corporation | 0.01 | -4.12 | 1.74 | 13.69 | 0.1567 | 0.0105 | |||
| FLOT / iShares Trust - iShares Floating Rate Bond ETF | 0.03 | 16.73 | 1.70 | 16.67 | 0.1529 | 0.0139 | |||
| QSR / Restaurant Brands International Inc. | 0.03 | 0.00 | 1.66 | -0.48 | 0.1491 | -0.0098 | |||
| SBUX / Starbucks Corporation | 0.02 | -43.02 | 1.65 | -46.78 | 0.1484 | -0.1472 | |||
| DHI / D.R. Horton, Inc. | 0.01 | -53.54 | 1.56 | -52.88 | 0.1398 | -0.1748 | |||
| SCHB / Schwab Strategic Trust - Schwab U.S. Broad Market ETF | 0.07 | 5.48 | 1.55 | 16.77 | 0.1396 | 0.0128 | |||
| XPRO / Expro Group Holdings N.V. | 0.01 | 0.00 | 1.54 | -21.91 | 0.1381 | -0.0495 | |||
| FE / FirstEnergy Corp. | 0.03 | 0.00 | 1.31 | -0.38 | 0.1180 | -0.0076 | |||
| WM / Waste Management, Inc. | 0.01 | 0.64 | 1.25 | -0.56 | 0.1126 | -0.0074 | |||
| MKTX / MarketAxess Holdings Inc. | 0.01 | 0.00 | 1.23 | 3.28 | 0.1104 | -0.0030 | |||
| UNP / Union Pacific Corporation | 0.01 | 0.09 | 1.22 | -2.48 | 0.1094 | -0.0096 | |||
| BLE / BlackRock Municipal Income Trust II | 0.11 | -6.03 | 1.10 | -9.15 | 0.0990 | -0.0166 | |||
| ABBV / AbbVie Inc. | 0.01 | 0.16 | 1.06 | -11.33 | 0.0957 | -0.0187 | |||
| SPY / SPDR S&P 500 ETF | 0.00 | 0.29 | 1.05 | 10.73 | 0.0947 | 0.0040 | |||
| MAIN / Main Street Capital Corporation | 0.02 | -0.22 | 1.01 | 4.35 | 0.0906 | -0.0015 | |||
| ORCL / Oracle Corporation | 0.00 | 0.13 | 1.00 | 56.60 | 0.0896 | 0.0289 | |||
| AVGO / Broadcom Inc. | 0.00 | -6.52 | 0.98 | 53.94 | 0.0878 | 0.0273 | |||
| OKE / ONEOK, Inc. | 0.01 | -3.31 | 0.95 | -20.47 | 0.0856 | -0.0285 | |||
| FFIN / First Financial Bankshares, Inc. | 0.02 | 0.00 | 0.89 | 0.11 | 0.0804 | -0.0047 | |||
| BIP / Brookfield Infrastructure Partners L.P. - Limited Partnership | 0.03 | 9.77 | 0.85 | 23.50 | 0.0761 | 0.0107 | |||
| FRD / Friedman Industries, Incorporated | 0.05 | -4.88 | 0.82 | 5.81 | 0.0737 | -0.0002 | |||
| RF / Regions Financial Corporation | 0.03 | 3.06 | 0.79 | 11.55 | 0.0712 | 0.0035 | |||
| COP / ConocoPhillips | 0.01 | -0.61 | 0.76 | -15.07 | 0.0679 | -0.0169 | |||
| DOW / Dow Inc. | 0.03 | -29.95 | 0.72 | -46.93 | 0.0646 | -0.0644 | |||
| FANG / Diamondback Energy, Inc. | 0.01 | -18.76 | 0.71 | -30.17 | 0.0641 | -0.0333 | |||
| COST / Costco Wholesale Corporation | 0.00 | 0.29 | 0.69 | 5.00 | 0.0623 | -0.0006 | |||
| MO / Altria Group, Inc. | 0.01 | 0.61 | 0.66 | -1.65 | 0.0590 | -0.0047 | |||
| MVT / BlackRock MuniVest Fund II, Inc. | 0.06 | -10.34 | 0.62 | -12.38 | 0.0554 | -0.0117 | |||
| NFLX / Netflix, Inc. | 0.00 | 24.43 | 0.59 | 78.66 | 0.0527 | 0.0214 | |||
| DLTR / Dollar Tree, Inc. | 0.01 | 103.86 | 0.55 | 169.12 | 0.0494 | 0.0299 | |||
| BMY / Bristol-Myers Squibb Company | 0.01 | 36.86 | 0.53 | 3.71 | 0.0478 | -0.0010 | |||
| CRGY / Crescent Energy Company | 0.06 | 10.96 | 0.52 | -15.10 | 0.0470 | -0.0117 | |||
| REGN / Regeneron Pharmaceuticals, Inc. | 0.00 | 0.00 | 0.49 | -17.37 | 0.0441 | -0.0124 | |||
| ISRG / Intuitive Surgical, Inc. | 0.00 | 0.23 | 0.47 | 10.09 | 0.0422 | 0.0015 | |||
| IBOC / International Bancshares Corporation | 0.01 | 0.00 | 0.46 | 5.45 | 0.0418 | -0.0002 | |||
| BKN / BlackRock Investment Quality Municipal Trust Inc. | 0.04 | 0.00 | 0.44 | -4.93 | 0.0400 | -0.0046 | |||
| VOO / Vanguard Index Funds - Vanguard S&P 500 ETF | 0.00 | 0.27 | 0.43 | 10.97 | 0.0382 | 0.0016 | |||
| NUV / Nuveen Municipal Value Fund, Inc. | 0.05 | -51.31 | 0.40 | -51.81 | 0.0359 | -0.0430 | |||
| PAA / Plains All American Pipeline, L.P. - Limited Partnership | 0.02 | 0.09 | 0.40 | -8.29 | 0.0358 | -0.0056 | |||
| ARCC / Ares Capital Corporation | 0.02 | 2.18 | 0.38 | 1.33 | 0.0343 | -0.0016 | |||
| EMR / Emerson Electric Co. | 0.00 | -24.00 | 0.38 | -7.79 | 0.0341 | -0.0050 | |||
| TXN / Texas Instruments Incorporated | 0.00 | 0.22 | 0.37 | 15.99 | 0.0333 | 0.0028 | |||
| MMM / 3M Company | 0.00 | 19.47 | 0.37 | 23.99 | 0.0330 | 0.0047 | |||
| GILD / Gilead Sciences, Inc. | 0.00 | -32.40 | 0.35 | -33.08 | 0.0313 | -0.0183 | |||
| STZ / Constellation Brands, Inc. | 0.00 | 0.00 | 0.34 | -11.52 | 0.0305 | -0.0060 | |||
| TSLA / Tesla, Inc. | 0.00 | 7.24 | 0.33 | 31.60 | 0.0296 | 0.0057 | |||
| BNS / The Bank of Nova Scotia | 0.01 | 20.20 | 0.33 | 40.09 | 0.0293 | 0.0071 | |||
| ARLP / Alliance Resource Partners, L.P. - Limited Partnership | 0.01 | -15.71 | 0.31 | -19.16 | 0.0277 | -0.0087 | |||
| VOX / Vanguard World Fund - Vanguard Communication Services ETF | 0.00 | 0.00 | 0.30 | 15.44 | 0.0269 | 0.0022 | |||
| IESC / IES Holdings, Inc. | 0.00 | 0.30 | 0.0266 | 0.0266 | |||||
| LRCX / Lam Research Corporation | 0.00 | 0.28 | 0.0249 | 0.0249 | |||||
| O / Realty Income Corporation | 0.00 | 0.00 | 0.28 | -0.72 | 0.0249 | -0.0017 | |||
| SSB / SouthState Corporation | 0.00 | -1.83 | 0.28 | -2.47 | 0.0248 | -0.0022 | |||
| PSX / Phillips 66 | 0.00 | -3.16 | 0.27 | -6.51 | 0.0246 | -0.0033 | |||
| BRO / Brown & Brown, Inc. | 0.00 | 0.00 | 0.27 | -10.82 | 0.0245 | -0.0046 | |||
| VHT / Vanguard World Fund - Vanguard Health Care ETF | 0.00 | 0.00 | 0.26 | -6.07 | 0.0237 | -0.0031 | |||
| GE / General Electric Company | 0.00 | 0.26 | 0.0230 | 0.0230 | |||||
| QQQ / Invesco QQQ Trust, Series 1 | 0.00 | 0.00 | 0.26 | 18.06 | 0.0229 | 0.0023 | |||
| CRK / Comstock Resources, Inc. | 0.01 | 0.25 | 0.0224 | 0.0224 | |||||
| CP / Canadian Pacific Kansas City Limited | 0.00 | 0.25 | 0.0223 | 0.0223 | |||||
| SO / The Southern Company | 0.00 | 0.00 | 0.25 | -0.40 | 0.0223 | -0.0014 | |||
| VTI / Vanguard Index Funds - Vanguard Total Stock Market ETF | 0.00 | 0.25 | 0.0222 | 0.0222 | |||||
| VCIT / Vanguard Scottsdale Funds - Vanguard Intermediate-Term Corporate Bond ETF | 0.00 | 0.07 | 0.24 | 1.25 | 0.0219 | -0.0010 | |||
| BX / Blackstone Inc. | 0.00 | 0.18 | 0.24 | 7.52 | 0.0219 | 0.0002 | |||
| GLD / SPDR Gold Trust | 0.00 | 0.13 | 0.24 | 5.73 | 0.0216 | -0.0000 | |||
| VIG / Vanguard Specialized Funds - Vanguard Dividend Appreciation ETF | 0.00 | 0.23 | 0.0209 | 0.0209 | |||||
| CRWD / CrowdStrike Holdings, Inc. | 0.00 | -30.78 | 0.23 | 0.00 | 0.0203 | -0.0012 | |||
| 1PANW / Palo Alto Networks, Inc. | 0.00 | 0.22 | 0.0195 | 0.0195 | |||||
| GEV / GE Vernova Inc. | 0.00 | 0.22 | 0.0194 | 0.0194 | |||||
| CADE / Cadence Bank | 0.01 | 0.21 | 0.0188 | 0.0188 | |||||
| MRVL / Marvell Technology, Inc. | 0.00 | 0.21 | 0.0188 | 0.0188 | |||||
| ICE / Intercontinental Exchange, Inc. | 0.00 | 0.21 | 0.0185 | 0.0185 | |||||
| PR / Permian Resources Corporation | 0.02 | 0.03 | 0.21 | -1.44 | 0.0185 | -0.0014 | |||
| TRP / TC Energy Corporation | 0.00 | 0.20 | 0.0184 | 0.0184 | |||||
| BAC / Bank of America Corporation | 0.00 | 0.20 | 0.0182 | 0.0182 | |||||
| VGT / Vanguard World Fund - Vanguard Information Technology ETF | 0.00 | 0.20 | 0.0181 | 0.0181 | |||||
| AR / Antero Resources Corporation | 0.01 | 0.00 | 0.20 | -0.50 | 0.0181 | -0.0012 | |||
| DVN / Devon Energy Corporation | 0.01 | 0.00 | 0.20 | -14.83 | 0.0181 | -0.0045 | |||
| IIM / Invesco Value Municipal Income Trust | 0.01 | -2.10 | 0.16 | -4.85 | 0.0142 | -0.0016 | |||
| SLNG / Stabilis Solutions, Inc. | 0.03 | 0.00 | 0.13 | -2.21 | 0.0120 | -0.0010 | |||
| REI / Ring Energy, Inc. | 0.03 | 0.00 | 0.02 | -32.35 | 0.0021 | -0.0011 | |||
| NBH / Neuberger Berman Municipal Fund Inc. | 0.00 | -100.00 | 0.00 | 0.0000 | |||||
| OXY / Occidental Petroleum Corporation | 0.00 | -100.00 | 0.00 | 0.0000 | |||||
| SCCO / Southern Copper Corporation | 0.00 | -100.00 | 0.00 | 0.0000 | |||||
| TRGP / Targa Resources Corp. | 0.00 | -100.00 | 0.00 | 0.0000 |