Mga Batayang Estadistika
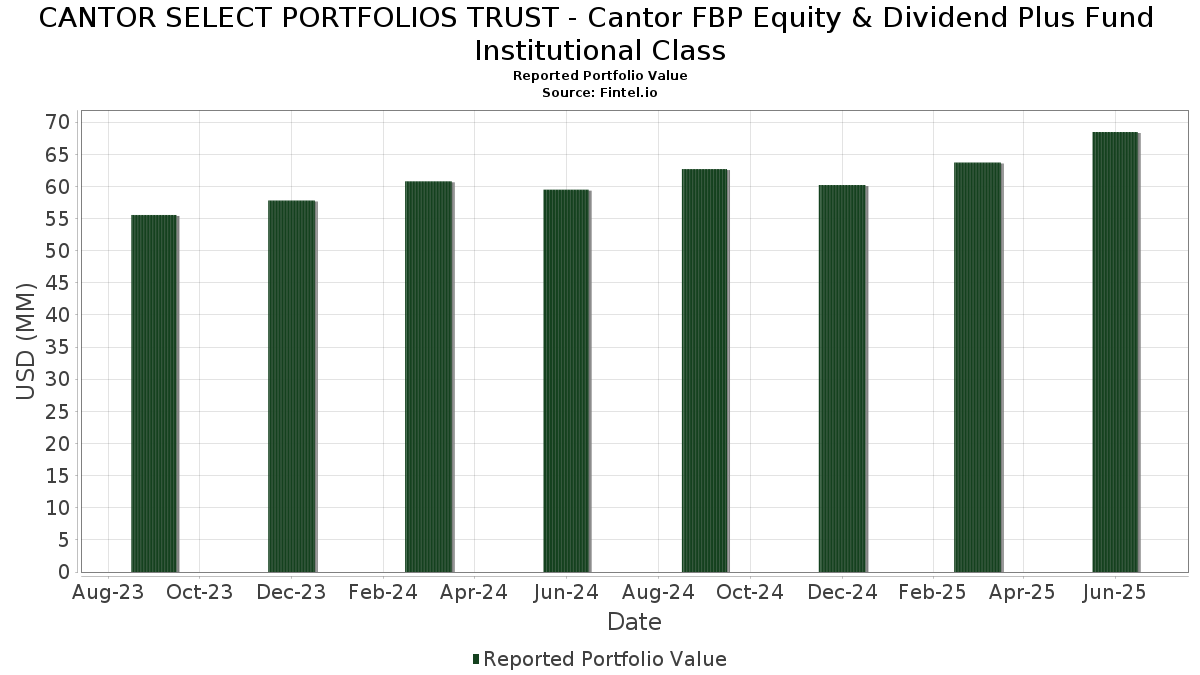
| Nilai Portofolio | $ 68,465,532 |
| Posisi Saat Ini | 59 |
Kepemilikan Terbaru, Kinerja, AUM (dari 13F, 13D)
CANTOR SELECT PORTFOLIOS TRUST - Cantor FBP Equity & Dividend Plus Fund Institutional Class telah mengungkapkan total kepemilikan 59 dalam pengajuan SEC terbaru mereka. Nilai portofolio terbaru dihitung sebesar $ 68,465,532 USD. Aset yang Dikelola (AUM) sebenarnya adalah nilai ini ditambah kas (yang tidak diungkapkan). Aset-aset utama CANTOR SELECT PORTFOLIOS TRUST - Cantor FBP Equity & Dividend Plus Fund Institutional Class adalah Fidelity Colchester Street Trust - Fidelity Institutional Money Market Funds Government Portfolio Class I (US:FIGXX) , CVS Health Corporation (US:CVS) , JPMorgan Chase & Co. (US:JPM) , Mondelez International, Inc. (US:MDLZ) , and Cisco Systems, Inc. (US:CSCO) . Posisi baru CANTOR SELECT PORTFOLIOS TRUST - Cantor FBP Equity & Dividend Plus Fund Institutional Class meliputi: Fidelity Colchester Street Trust - Fidelity Institutional Money Market Funds Government Portfolio Class I (US:FIGXX) , LyondellBasell Industries N.V. (US:LYB) , Sysco Corporation (US:SYY) , .
Peningkatan Tertinggi Kuartal Ini
Kami menggunakan perubahan dalam alokasi portofolio karena ini adalah metrik yang paling bermakna. Perubahan dapat disebabkan oleh perdagangan atau perubahan harga saham.
| Keamanan | Saham (MM) |
Nilai (Juta Dolar AS) |
Portfolio % | ΔPorsyento ng Portfolio |
|---|---|---|---|---|
| 0.01 | 1.66 | 2.4206 | 1.4348 | |
| 0.03 | 1.79 | 2.6058 | 1.4219 | |
| 0.01 | 0.81 | 1.1805 | 1.1805 | |
| 0.01 | 1.93 | 2.8174 | 1.0646 | |
| 0.01 | 0.72 | 1.0486 | 1.0486 | |
| 0.01 | 0.99 | 1.4363 | 0.6213 | |
| 0.08 | 1.60 | 2.3246 | 0.5471 | |
| 0.01 | 1.03 | 1.5002 | 0.3977 | |
| 0.02 | 1.32 | 1.9253 | 0.3589 | |
| 0.01 | 1.33 | 1.9320 | 0.3174 |
Penurunan Tertinggi Kuartal Ini
Kami menggunakan perubahan dalam alokasi portofolio karena ini adalah metrik yang paling bermakna. Perubahan dapat disebabkan oleh perdagangan atau perubahan harga saham.
| Keamanan | Saham (MM) |
Nilai (Juta Dolar AS) |
Portfolio % | ΔPorsyento ng Portfolio |
|---|---|---|---|---|
| 5.27 | 7.6777 | -1.6285 | ||
| 0.03 | 0.78 | 1.1387 | -0.9888 | |
| 0.01 | 0.47 | 0.6790 | -0.8104 | |
| 0.02 | 1.11 | 1.6190 | -0.4935 | |
| 0.01 | 1.20 | 1.7529 | -0.4496 | |
| 0.01 | 1.50 | 2.1816 | -0.3657 | |
| 0.02 | 1.57 | 2.2831 | -0.2724 | |
| 0.01 | 0.85 | 1.2344 | -0.2709 | |
| 0.01 | 0.99 | 1.4386 | -0.2403 | |
| 0.04 | 1.10 | 1.6041 | -0.2187 |
Pengajuan 13F dan Dana
Formulir ini diajukan pada 2025-08-29 untuk periode pelaporan 2025-06-30. Klik ikon tautan untuk melihat riwayat transaksi selengkapnya.
Tingkatkan ke versi premium untuk membuka data premium dan ekspor ke Excel. ![]() .
.
| Keamanan | Ketik | Harga Saham Rata-rata | Saham (MM) |
ΔSaham (%) |
ΔSaham (%) |
Nilai ($MM) |
Portpolyo (%) |
ΔPortofolio (%) |
|
|---|---|---|---|---|---|---|---|---|---|
| FIGXX / Fidelity Colchester Street Trust - Fidelity Institutional Money Market Funds Government Portfolio Class I | 5.27 | -11.27 | 7.6777 | -1.6285 | |||||
| CVS / CVS Health Corporation | 0.04 | 5.88 | 2.48 | 7.82 | 3.6190 | 0.0086 | |||
| JPM / JPMorgan Chase & Co. | 0.01 | 0.00 | 2.35 | 18.23 | 3.4222 | 0.3080 | |||
| MDLZ / Mondelez International, Inc. | 0.03 | 11.11 | 2.02 | 10.49 | 2.9485 | 0.0772 | |||
| CSCO / Cisco Systems, Inc. | 0.03 | 5.45 | 2.01 | 18.56 | 2.9322 | 0.2724 | |||
| WFC / Wells Fargo & Company | 0.02 | 0.00 | 1.96 | 11.60 | 2.8607 | 0.1039 | |||
| EMR / Emerson Electric Co. | 0.01 | 42.16 | 1.93 | 72.90 | 2.8174 | 1.0646 | |||
| UPS / United Parcel Service, Inc. | 0.02 | 12.50 | 1.82 | 3.24 | 2.6479 | -0.1104 | |||
| GLW / Corning Incorporated | 0.03 | 106.06 | 1.79 | 136.82 | 2.6058 | 1.4219 | |||
| TXN / Texas Instruments Incorporated | 0.01 | 128.57 | 1.66 | 164.33 | 2.4206 | 1.4348 | |||
| HPE / Hewlett Packard Enterprise Company | 0.08 | 6.12 | 1.60 | 40.65 | 2.3246 | 0.5471 | |||
| TFC / Truist Financial Corporation | 0.04 | 5.71 | 1.59 | 10.42 | 2.3181 | 0.0607 | |||
| SHEL / Shell plc - Depositary Receipt (Common Stock) | 0.02 | 0.00 | 1.57 | -3.93 | 2.2831 | -0.2724 | |||
| JNJ / Johnson & Johnson | 0.01 | 0.00 | 1.50 | -7.94 | 2.1816 | -0.3657 | |||
| MDT / Medtronic plc | 0.02 | 8.28 | 1.48 | 5.04 | 2.1596 | -0.0516 | |||
| KMB / Kimberly-Clark Corporation | 0.01 | 15.79 | 1.42 | 4.96 | 2.0667 | -0.0509 | |||
| USB / U.S. Bancorp | 0.03 | 0.00 | 1.38 | 7.23 | 2.0113 | -0.0070 | |||
| NI / NiSource Inc. | 0.03 | 0.00 | 1.33 | 0.68 | 1.9400 | -0.1335 | |||
| SJM / The J. M. Smucker Company | 0.01 | 55.17 | 1.33 | 28.64 | 1.9320 | 0.3174 | |||
| SWK / Stanley Black & Decker, Inc. | 0.02 | 50.00 | 1.32 | 32.23 | 1.9253 | 0.3589 | |||
| PFE / Pfizer Inc. | 0.05 | 27.06 | 1.31 | 21.56 | 1.9076 | 0.2197 | |||
| XOM / Exxon Mobil Corporation | 0.01 | 33.33 | 1.29 | 20.84 | 1.8852 | 0.2076 | |||
| DUK / Duke Energy Corporation | 0.01 | 0.00 | 1.27 | -3.26 | 1.8572 | -0.2074 | |||
| FIS / Fidelity National Information Services, Inc. | 0.01 | 11.11 | 1.22 | 21.13 | 1.7796 | 0.1995 | |||
| CVX / Chevron Corporation | 0.01 | 0.00 | 1.20 | -14.45 | 1.7529 | -0.4496 | |||
| TGT / Target Corporation | 0.01 | 33.33 | 1.18 | 25.99 | 1.7252 | 0.2531 | |||
| BBY / Best Buy Co., Inc. | 0.02 | 6.06 | 1.17 | -3.29 | 1.7120 | -0.1916 | |||
| VZ / Verizon Communications Inc. | 0.03 | 0.00 | 1.13 | -4.58 | 1.6395 | -0.2089 | |||
| BMY / Bristol-Myers Squibb Company | 0.02 | 8.60 | 1.11 | -17.59 | 1.6190 | -0.4935 | |||
| HPQ / HP Inc. | 0.04 | 7.14 | 1.10 | -5.34 | 1.6041 | -0.2187 | |||
| GPC / Genuine Parts Company | 0.01 | 7.21 | 1.09 | 9.10 | 1.5911 | 0.0235 | |||
| RTX / RTX Corporation | 0.01 | 0.00 | 1.08 | 10.20 | 1.5747 | 0.0384 | |||
| CMCSA / Comcast Corporation | 0.03 | 11.11 | 1.07 | 7.43 | 1.5604 | -0.0012 | |||
| DG / Dollar General Corporation | 0.01 | 12.50 | 1.03 | 46.37 | 1.5002 | 0.3977 | |||
| PPG / PPG Industries, Inc. | 0.01 | 12.50 | 1.02 | 17.05 | 1.4919 | 0.1208 | |||
| PRU / Prudential Financial, Inc. | 0.01 | 5.56 | 1.02 | 1.49 | 1.4875 | -0.0879 | |||
| COP / ConocoPhillips | 0.01 | 7.84 | 0.99 | -7.84 | 1.4386 | -0.2403 | |||
| IFF / International Flavors & Fragrances Inc. | 0.01 | 100.00 | 0.99 | 89.79 | 1.4363 | 0.6213 | |||
| PM / Philip Morris International Inc. | 0.01 | 0.00 | 0.95 | 14.79 | 1.3802 | 0.0865 | |||
| VTR / Ventas, Inc. | 0.01 | 9.38 | 0.88 | 17.40 | 1.2884 | 0.0387 | |||
| CAG / Conagra Brands, Inc. | 0.04 | 26.47 | 0.88 | -2.87 | 1.2828 | -0.1385 | |||
| DVN / Devon Energy Corporation | 0.03 | 17.02 | 0.87 | -0.46 | 1.2748 | -0.1027 | |||
| MRK / Merck & Co., Inc. | 0.01 | 0.00 | 0.85 | -11.77 | 1.2344 | -0.2709 | |||
| LYB / LyondellBasell Industries N.V. | 0.01 | 0.81 | 1.1805 | 1.1805 | |||||
| STT / State Street Corporation | 0.01 | 7.14 | 0.80 | 27.32 | 1.1623 | 0.1800 | |||
| T / AT&T Inc. | 0.03 | -43.75 | 0.78 | -42.45 | 1.1387 | -0.9888 | |||
| SYY / Sysco Corporation | 0.01 | 0.72 | 1.0486 | 1.0486 | |||||
| LMT / Lockheed Martin Corporation | 0.00 | 0.00 | 0.62 | 3.69 | 0.9017 | -0.0337 | |||
| SLB / Schlumberger Limited | 0.02 | 9.68 | 0.57 | -11.28 | 0.8374 | -0.1781 | |||
| MET / MetLife, Inc. | 0.01 | 7.58 | 0.57 | 7.75 | 0.8321 | 0.0016 | |||
| HD / The Home Depot, Inc. | 0.00 | 27.27 | 0.51 | 27.30 | 0.7480 | 0.1162 | |||
| NFG / National Fuel Gas Company | 0.01 | -54.17 | 0.47 | -51.05 | 0.6790 | -0.8104 | |||
| TRV / The Travelers Companies, Inc. | 0.00 | 0.00 | 0.40 | 1.26 | 0.5848 | -0.0369 | |||
| Shell PLC Call @ 80 January 2026 / DE (N/A) | Short | -0.00 | -0.03 | -0.0372 | -0.0372 | ||||
| Texas Instruments Inc. Call @ 230 January 2026 / DE (N/A) | Short | -0.00 | -0.04 | -0.0637 | -0.0637 | ||||
| Emerson Electric Co. Call @ 140 December 2025 / DE (N/A) | Short | -0.00 | -0.05 | -0.0680 | -0.0680 | ||||
| Hewlett Packard Enterprise Co. Call @ 23 February 2026 / DE (N/A) | Short | -0.00 | -0.06 | -0.0858 | -0.0858 | ||||
| Dollar General Corp. Call @ 120 November 2025 / DE (N/A) | Short | -0.00 | -0.06 | -0.0918 | -0.0918 | ||||
| Cisco Systems Inc. Call @ 70 January 2026 / DE (N/A) | Short | -0.00 | -0.07 | -0.1075 | -0.1075 |