Mga Batayang Estadistika
| Nilai Portofolio | $ 2,465,003,106 |
| Posisi Saat Ini | 57 |
Kepemilikan Terbaru, Kinerja, AUM (dari 13F, 13D)
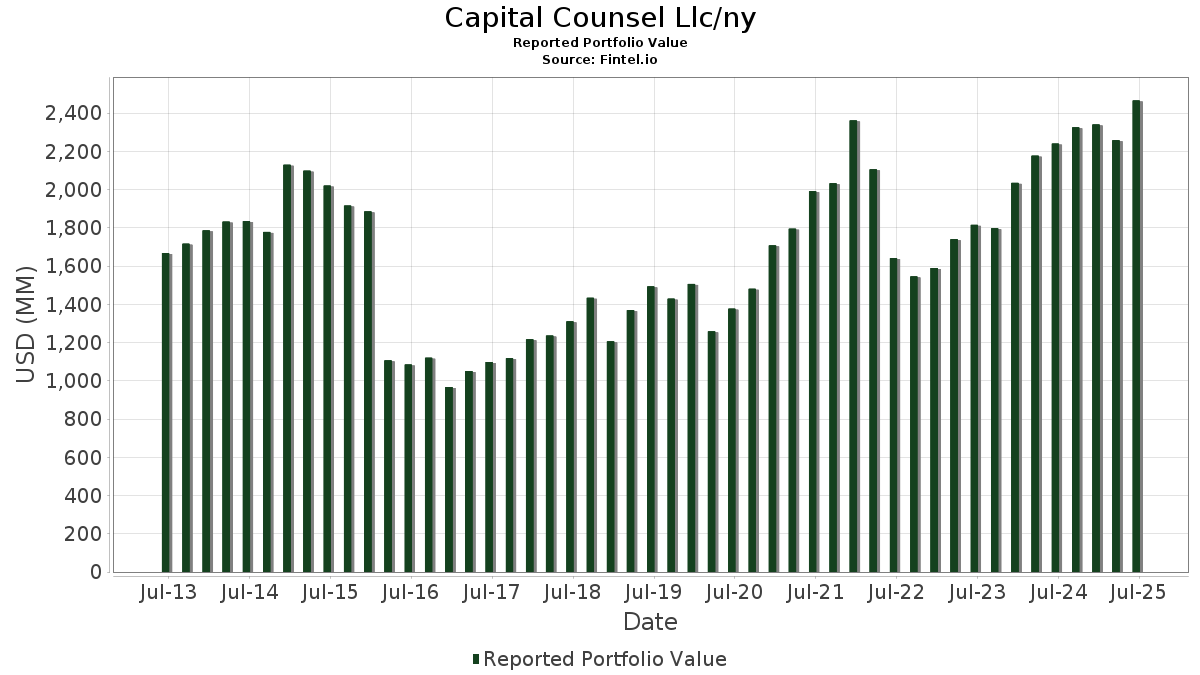
Capital Counsel Llc/ny telah mengungkapkan total kepemilikan 57 dalam pengajuan SEC terbaru mereka. Nilai portofolio terbaru dihitung sebesar $ 2,465,003,106 USD. Aset yang Dikelola (AUM) sebenarnya adalah nilai ini ditambah kas (yang tidak diungkapkan). Aset-aset utama Capital Counsel Llc/ny adalah Visa Inc. (US:V) , Microsoft Corporation (US:MSFT) , Costco Wholesale Corporation (US:COST) , IDEXX Laboratories, Inc. (US:IDXX) , and Alphabet Inc. (US:GOOG) . Posisi baru Capital Counsel Llc/ny meliputi: Ralliant Corporation (US:RAL) , Invesco QQQ Trust, Series 1 (US:QQQ) , Broadcom Inc. (US:AVGO) , .
Peningkatan Tertinggi Kuartal Ini
Kami menggunakan perubahan dalam alokasi portofolio karena ini adalah metrik yang paling bermakna. Perubahan dapat disebabkan oleh perdagangan atau perubahan harga saham.
| Keamanan | Saham (MM) |
Nilai (Juta Dolar AS) |
Portfolio % | ΔPorsyento ng Portfolio |
|---|---|---|---|---|
| 0.51 | 252.88 | 10.2588 | 1.7045 | |
| 2.21 | 226.58 | 9.1920 | 1.5512 | |
| 0.46 | 247.13 | 10.0255 | 1.3370 | |
| 1.31 | 231.70 | 9.3997 | 0.2747 | |
| 0.39 | 6.05 | 0.2453 | 0.1164 | |
| 0.08 | 11.75 | 0.4766 | 0.0998 | |
| 0.05 | 1.98 | 0.0805 | 0.0309 | |
| 0.00 | 0.35 | 0.0142 | 0.0142 | |
| 0.01 | 2.69 | 0.1091 | 0.0126 | |
| 0.01 | 0.25 | 0.0100 | 0.0100 |
Penurunan Tertinggi Kuartal Ini
Kami menggunakan perubahan dalam alokasi portofolio karena ini adalah metrik yang paling bermakna. Perubahan dapat disebabkan oleh perdagangan atau perubahan harga saham.
| Keamanan | Saham (MM) |
Nilai (Juta Dolar AS) |
Portfolio % | ΔPorsyento ng Portfolio |
|---|---|---|---|---|
| 0.76 | 270.65 | 10.9796 | -1.0387 | |
| 0.15 | 174.09 | 7.0626 | -0.8351 | |
| 0.68 | 209.78 | 8.5105 | -0.7372 | |
| 0.25 | 251.02 | 10.1832 | -0.6047 | |
| 0.81 | 224.00 | 9.0871 | -0.5496 | |
| 0.30 | 111.36 | 4.5178 | -0.5168 | |
| 0.58 | 91.78 | 3.7233 | -0.2885 | |
| 0.99 | 68.54 | 2.7804 | -0.1669 | |
| 0.07 | 14.74 | 0.5979 | -0.1312 | |
| 0.05 | 9.03 | 0.3665 | -0.0457 |
Pengajuan 13F dan Dana
Formulir ini diajukan pada 2025-08-13 untuk periode pelaporan 2025-06-30. Klik ikon tautan untuk melihat riwayat transaksi selengkapnya.
Tingkatkan ke versi premium untuk membuka data premium dan ekspor ke Excel. ![]() .
.
| Keamanan | Ketik | Harga Saham Rata-rata | Saham (MM) |
ΔSaham (%) |
ΔSaham (%) |
Nilai ($MM) |
Portpolyo (%) |
ΔPortofolio (%) |
|
|---|---|---|---|---|---|---|---|---|---|
| V / Visa Inc. | 0.76 | -1.52 | 270.65 | -0.23 | 10.9796 | -1.0387 | |||
| MSFT / Microsoft Corporation | 0.51 | -1.16 | 252.88 | 30.96 | 10.2588 | 1.7045 | |||
| COST / Costco Wholesale Corporation | 0.25 | -1.52 | 251.02 | 3.08 | 10.1832 | -0.6047 | |||
| IDXX / IDEXX Laboratories, Inc. | 0.46 | -1.34 | 247.13 | 26.01 | 10.0255 | 1.3370 | |||
| GOOG / Alphabet Inc. | 1.31 | -0.93 | 231.70 | 12.49 | 9.3997 | 0.2747 | |||
| ANET / Arista Networks Inc | 2.21 | -0.51 | 226.58 | 31.38 | 9.1920 | 1.5512 | |||
| CME / CME Group Inc. | 0.81 | -0.88 | 224.00 | 2.98 | 9.0871 | -0.5496 | |||
| ADP / Automatic Data Processing, Inc. | 0.68 | -0.44 | 209.78 | 0.50 | 8.5105 | -0.7372 | |||
| MTD / Mettler-Toledo International Inc. | 0.15 | -1.83 | 174.09 | -2.34 | 7.0626 | -0.8351 | |||
| HD / The Home Depot, Inc. | 0.30 | -2.05 | 111.36 | -2.01 | 4.5178 | -0.5168 | |||
| QCOM / QUALCOMM Incorporated | 0.58 | -2.24 | 91.78 | 1.35 | 3.7233 | -0.2885 | |||
| DCI / Donaldson Company, Inc. | 0.99 | -0.38 | 68.54 | 3.02 | 2.7804 | -0.1669 | |||
| AAPL / Apple Inc. | 0.07 | -3.04 | 14.74 | -10.45 | 0.5979 | -0.1312 | |||
| INTC / Intel Corporation | 0.64 | 7.47 | 14.37 | 6.00 | 0.5830 | -0.0176 | |||
| AMD / Advanced Micro Devices, Inc. | 0.08 | 0.00 | 11.75 | 38.11 | 0.4766 | 0.0998 | |||
| DHR / Danaher Corporation | 0.05 | 0.76 | 9.03 | -2.90 | 0.3665 | -0.0457 | |||
| GILD / Gilead Sciences, Inc. | 0.07 | 1.55 | 7.67 | 0.48 | 0.3113 | -0.0270 | |||
| KGC / Kinross Gold Corporation | 0.39 | 67.64 | 6.05 | 107.80 | 0.2453 | 0.1164 | |||
| XOM / Exxon Mobil Corporation | 0.05 | 0.93 | 5.36 | -8.51 | 0.2173 | -0.0421 | |||
| MRK / Merck & Co., Inc. | 0.06 | 1.80 | 5.01 | -10.21 | 0.2030 | -0.0439 | |||
| ADI / Analog Devices, Inc. | 0.01 | 0.00 | 2.94 | 18.03 | 0.1192 | 0.0089 | |||
| HUBB / Hubbell Incorporated | 0.01 | 0.00 | 2.69 | 23.45 | 0.1091 | 0.0126 | |||
| BRK.B / Berkshire Hathaway Inc. | 0.01 | 1.95 | 2.56 | -7.01 | 0.1039 | -0.0181 | |||
| GOOGL / Alphabet Inc. | 0.01 | -6.60 | 2.47 | 6.42 | 0.1002 | -0.0026 | |||
| IONS / Ionis Pharmaceuticals, Inc. | 0.05 | 35.40 | 1.98 | 77.37 | 0.0805 | 0.0309 | |||
| PEP / PepsiCo, Inc. | 0.01 | 0.00 | 1.78 | -11.94 | 0.0722 | -0.0173 | |||
| MA / Mastercard Incorporated | 0.00 | -5.75 | 1.78 | -3.37 | 0.0721 | -0.0094 | |||
| WAB / Westinghouse Air Brake Technologies Corporation | 0.01 | 0.00 | 1.67 | 15.45 | 0.0679 | 0.0037 | |||
| VLTO / Veralto Corporation | 0.02 | 0.77 | 1.52 | 4.41 | 0.0615 | -0.0028 | |||
| KKR / KKR & Co. Inc. | 0.01 | -18.44 | 1.11 | -6.17 | 0.0451 | -0.0074 | |||
| SHY / iShares Trust - iShares 1-3 Year Treasury Bond ETF | 0.01 | 29.48 | 1.09 | 29.73 | 0.0443 | 0.0070 | |||
| WMT / Walmart Inc. | 0.01 | -10.72 | 1.00 | -0.50 | 0.0404 | -0.0040 | |||
| SPY / SPDR S&P 500 ETF | 0.00 | -11.46 | 0.91 | -2.16 | 0.0368 | -0.0043 | |||
| FTV / Fortive Corporation | 0.02 | 0.00 | 0.79 | -28.82 | 0.0322 | -0.0172 | |||
| IBM / International Business Machines Corporation | 0.00 | 14.11 | 0.64 | 35.38 | 0.0259 | 0.0050 | |||
| AMZN / Amazon.com, Inc. | 0.00 | -29.03 | 0.60 | -18.19 | 0.0243 | -0.0081 | |||
| NVDA / NVIDIA Corporation | 0.00 | -5.99 | 0.59 | 36.87 | 0.0241 | 0.0049 | |||
| FIS / Fidelity National Information Services, Inc. | 0.01 | 0.00 | 0.53 | 9.11 | 0.0214 | -0.0000 | |||
| JPM / JPMorgan Chase & Co. | 0.00 | -27.64 | 0.44 | -14.51 | 0.0179 | -0.0050 | |||
| CHRW / C.H. Robinson Worldwide, Inc. | 0.00 | 0.00 | 0.38 | -6.36 | 0.0156 | -0.0026 | |||
| EME / EMCOR Group, Inc. | 0.00 | 0.35 | 0.0142 | 0.0142 | |||||
| TMO / Thermo Fisher Scientific Inc. | 0.00 | -28.66 | 0.33 | -41.96 | 0.0132 | -0.0116 | |||
| NSC / Norfolk Southern Corporation | 0.00 | 0.00 | 0.31 | 8.36 | 0.0126 | -0.0001 | |||
| SM / SM Energy Company | 0.01 | 0.00 | 0.29 | -17.42 | 0.0119 | -0.0039 | |||
| ADBE / Adobe Inc. | 0.00 | 0.00 | 0.28 | 0.71 | 0.0115 | -0.0010 | |||
| VOO / Vanguard Index Funds - Vanguard S&P 500 ETF | 0.00 | -6.69 | 0.28 | 3.36 | 0.0112 | -0.0007 | |||
| GLW / Corning Incorporated | 0.01 | 0.00 | 0.26 | 14.91 | 0.0107 | 0.0005 | |||
| RSG / Republic Services, Inc. | 0.00 | 0.00 | 0.25 | 1.63 | 0.0101 | -0.0007 | |||
| RAL / Ralliant Corporation | 0.01 | 0.25 | 0.0100 | 0.0100 | |||||
| CAT / Caterpillar Inc. | 0.00 | 0.00 | 0.24 | 17.91 | 0.0096 | 0.0007 | |||
| CTVA / Corteva, Inc. | 0.00 | 0.00 | 0.24 | 18.00 | 0.0096 | 0.0007 | |||
| QQQ / Invesco QQQ Trust, Series 1 | 0.00 | 0.23 | 0.0093 | 0.0093 | |||||
| VNT / Vontier Corporation | 0.01 | 0.00 | 0.22 | 12.00 | 0.0091 | 0.0003 | |||
| AVGO / Broadcom Inc. | 0.00 | 0.22 | 0.0089 | 0.0089 | |||||
| FLO / Flowers Foods, Inc. | 0.01 | 0.00 | 0.19 | -15.91 | 0.0075 | -0.0023 | |||
| VUZI / Vuzix Corporation | 0.02 | 0.00 | 0.06 | 45.00 | 0.0024 | 0.0006 | |||
| NRGV / Energy Vault Holdings, Inc. | 0.07 | -8.50 | 0.05 | -4.08 | 0.0019 | -0.0003 | |||
| LLY / Eli Lilly and Company | 0.00 | -100.00 | 0.00 | 0.0000 | |||||
| AMGN / Amgen Inc. | 0.00 | -100.00 | 0.00 | 0.0000 | |||||
| MRNA / Moderna, Inc. | 0.00 | -100.00 | 0.00 | 0.0000 |