Mga Batayang Estadistika
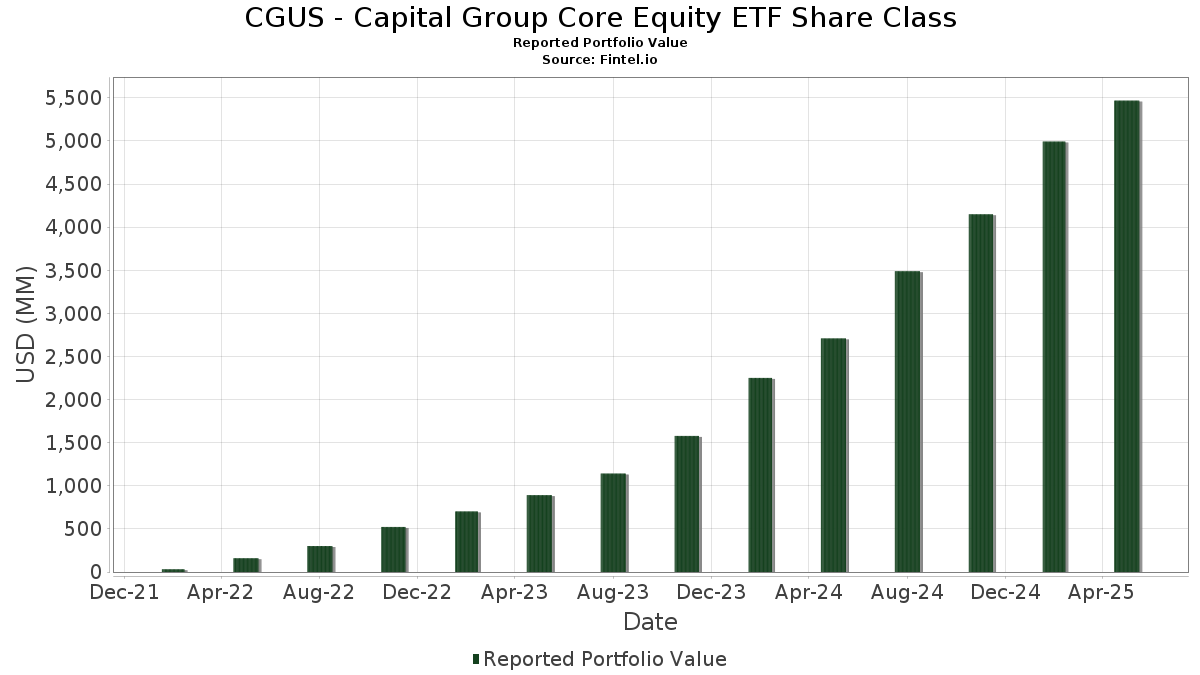
| Nilai Portofolio | $ 5,468,534,683 |
| Posisi Saat Ini | 68 |
Kepemilikan Terbaru, Kinerja, AUM (dari 13F, 13D)
CGUS - Capital Group Core Equity ETF Share Class telah mengungkapkan total kepemilikan 68 dalam pengajuan SEC terbaru mereka. Nilai portofolio terbaru dihitung sebesar $ 5,468,534,683 USD. Aset yang Dikelola (AUM) sebenarnya adalah nilai ini ditambah kas (yang tidak diungkapkan). Aset-aset utama CGUS - Capital Group Core Equity ETF Share Class adalah Microsoft Corporation (US:MSFT) , Broadcom Inc. (US:AVGO) , Meta Platforms, Inc. (US:META) , NVIDIA Corporation (US:NVDA) , and CAPITAL GROUP CENTRAL CASH FUND (US:US14020B1026) . Posisi baru CGUS - Capital Group Core Equity ETF Share Class meliputi: Amphenol Corporation (US:APH) , .
Peningkatan Tertinggi Kuartal Ini
Kami menggunakan perubahan dalam alokasi portofolio karena ini adalah metrik yang paling bermakna. Perubahan dapat disebabkan oleh perdagangan atau perubahan harga saham.
| Keamanan | Saham (MM) |
Nilai (Juta Dolar AS) |
Portfolio % | ΔPorsyento ng Portfolio |
|---|---|---|---|---|
| 1.75 | 235.84 | 4.3101 | 2.3204 | |
| 2.29 | 229.03 | 4.1857 | 1.5776 | |
| 1.14 | 276.98 | 5.0620 | 1.4140 | |
| 0.86 | 395.60 | 7.2298 | 0.8242 | |
| 0.45 | 40.53 | 0.7406 | 0.7406 | |
| 0.38 | 44.90 | 0.8206 | 0.5491 | |
| 0.29 | 48.60 | 0.8882 | 0.2782 | |
| 0.28 | 61.61 | 1.1259 | 0.2682 | |
| 0.12 | 39.91 | 0.7294 | 0.2656 | |
| 0.36 | 88.54 | 1.6180 | 0.2392 |
Penurunan Tertinggi Kuartal Ini
Kami menggunakan perubahan dalam alokasi portofolio karena ini adalah metrik yang paling bermakna. Perubahan dapat disebabkan oleh perdagangan atau perubahan harga saham.
| Keamanan | Saham (MM) |
Nilai (Juta Dolar AS) |
Portfolio % | ΔPorsyento ng Portfolio |
|---|---|---|---|---|
| 0.34 | 62.81 | 1.1479 | -0.8467 | |
| 0.70 | 49.51 | 0.9048 | -0.7889 | |
| 0.42 | 271.47 | 4.9611 | -0.6769 | |
| 0.24 | 74.67 | 1.3647 | -0.5738 | |
| 0.07 | 37.16 | 0.6791 | -0.5177 | |
| 0.65 | 111.68 | 2.0409 | -0.5064 | |
| 0.99 | 198.23 | 3.6228 | -0.4678 | |
| 0.55 | 55.95 | 1.0225 | -0.4361 | |
| 0.80 | 66.30 | 1.2116 | -0.3813 | |
| 0.44 | 75.81 | 1.3855 | -0.2757 |
Pengajuan 13F dan Dana
Formulir ini diajukan pada 2025-07-16 untuk periode pelaporan 2025-05-31. Klik ikon tautan untuk melihat riwayat transaksi selengkapnya.
Tingkatkan ke versi premium untuk membuka data premium dan ekspor ke Excel. ![]() .
.
| Keamanan | Ketik | Harga Saham Rata-rata | Saham (MM) |
ΔSaham (%) |
ΔSaham (%) |
Nilai ($MM) |
Portpolyo (%) |
ΔPortofolio (%) |
|
|---|---|---|---|---|---|---|---|---|---|
| MSFT / Microsoft Corporation | 0.86 | 7.64 | 395.60 | 24.82 | 7.2298 | 0.8242 | |||
| AVGO / Broadcom Inc. | 1.14 | 26.42 | 276.98 | 53.46 | 5.0620 | 1.4140 | |||
| META / Meta Platforms, Inc. | 0.42 | 0.43 | 271.47 | -2.69 | 4.9611 | -0.6769 | |||
| NVDA / NVIDIA Corporation | 1.75 | 121.46 | 235.84 | 139.56 | 4.3101 | 2.3204 | |||
| US14020B1026 / CAPITAL GROUP CENTRAL CASH FUND | 2.29 | 77.52 | 229.03 | 77.49 | 4.1857 | 1.5776 | |||
| AMZN / Amazon.com, Inc. | 1.10 | 13.74 | 226.48 | 9.84 | 4.1391 | -0.0282 | |||
| AAPL / Apple Inc. | 0.99 | 17.93 | 198.23 | -2.05 | 3.6228 | -0.4678 | |||
| LLY / Eli Lilly and Company | 0.19 | 47.89 | 139.19 | 18.50 | 2.5438 | 0.1698 | |||
| RTX / RTX Corporation | 0.99 | 10.76 | 135.47 | 13.67 | 2.4759 | 0.0671 | |||
| MA / Mastercard Incorporated | 0.20 | 9.54 | 115.50 | 11.31 | 2.1108 | 0.0136 | |||
| GOOGL / Alphabet Inc. | 0.65 | -12.15 | 111.68 | -11.39 | 2.0409 | -0.5064 | |||
| ADP / Automatic Data Processing, Inc. | 0.34 | 11.33 | 110.76 | 14.99 | 2.0241 | 0.0774 | |||
| JPM / JPMorgan Chase & Co. | 0.41 | 4.65 | 109.41 | 4.39 | 1.9996 | -0.1188 | |||
| BATS / British American Tobacco p.l.c. | 2.23 | 7.85 | 100.29 | 24.76 | 1.8328 | 0.2082 | |||
| GE / General Electric Company | 0.36 | 9.23 | 88.54 | 29.77 | 1.6180 | 0.2392 | |||
| FIS / Fidelity National Information Services, Inc. | 1.04 | 9.63 | 82.68 | 22.72 | 1.5109 | 0.1493 | |||
| BLK / BlackRock, Inc. | 0.08 | 27.36 | 76.86 | 27.63 | 1.4047 | 0.1875 | |||
| GOOG / Alphabet Inc. | 0.44 | -8.10 | 75.81 | -7.76 | 1.3855 | -0.2757 | |||
| VRTX / Vertex Pharmaceuticals Incorporated | 0.17 | 14.36 | 75.77 | 5.37 | 1.3847 | -0.0686 | |||
| ACN / Accenture plc | 0.24 | -14.36 | 74.67 | -22.14 | 1.3647 | -0.5738 | |||
| GD / General Dynamics Corporation | 0.27 | 9.70 | 74.62 | 20.94 | 1.3637 | 0.1168 | |||
| CARR / Carrier Global Corporation | 1.03 | 17.19 | 73.62 | 28.77 | 1.3455 | 0.1899 | |||
| BA / The Boeing Company | 0.35 | 8.68 | 72.99 | 29.02 | 1.3340 | 0.1906 | |||
| WH / Wyndham Hotels & Resorts, Inc. | 0.80 | 10.08 | 66.30 | -15.88 | 1.2116 | -0.3813 | |||
| VICI / VICI Properties Inc. | 2.05 | 11.22 | 65.05 | 8.55 | 1.1888 | -0.0223 | |||
| APD / Air Products and Chemicals, Inc. | 0.23 | 11.29 | 64.93 | -1.82 | 1.1867 | -0.1501 | |||
| AIR / Airbus SE | 0.35 | 14.86 | 64.65 | 22.98 | 1.1815 | 0.1190 | |||
| GFL / GFL Environmental Inc. | 1.27 | 11.25 | 63.99 | 24.23 | 1.1694 | 0.1284 | |||
| ABBV / AbbVie Inc. | 0.34 | -28.52 | 62.81 | -36.36 | 1.1479 | -0.8467 | |||
| WWD / Woodward, Inc. | 0.28 | 26.83 | 61.61 | 45.17 | 1.1259 | 0.2682 | |||
| SBUX / Starbucks Corporation | 0.70 | 84.53 | 59.01 | 33.76 | 1.0784 | 0.1868 | |||
| ABT / Abbott Laboratories | 0.42 | -8.54 | 56.18 | -11.48 | 1.0267 | -0.2560 | |||
| XOM / Exxon Mobil Corporation | 0.55 | -15.63 | 55.95 | -22.47 | 1.0225 | -0.4361 | |||
| BKR / Baker Hughes Company | 1.47 | 7.88 | 54.62 | -10.36 | 0.9983 | -0.2334 | |||
| RCL / Royal Caribbean Cruises Ltd. | 0.21 | 8.25 | 53.48 | 13.03 | 0.9774 | 0.0211 | |||
| PCG / PG&E Corporation | 3.17 | 11.22 | 53.45 | 14.90 | 0.9767 | 0.0366 | |||
| CNQ / Canadian Natural Resources Limited | 1.75 | 11.21 | 53.18 | 19.59 | 0.9718 | 0.0731 | |||
| LIN / Linde plc | 0.11 | 11.13 | 51.42 | 11.26 | 0.9398 | 0.0057 | |||
| TMO / Thermo Fisher Scientific Inc. | 0.13 | 12.08 | 50.45 | -14.65 | 0.9219 | -0.2726 | |||
| HD / The Home Depot, Inc. | 0.14 | 19.20 | 49.72 | 10.70 | 0.9087 | 0.0009 | |||
| GEHC / GE HealthCare Technologies Inc. | 0.70 | -26.84 | 49.51 | -40.92 | 0.9048 | -0.7889 | |||
| ORCL / Oracle Corporation | 0.29 | 114.26 | 48.60 | 91.88 | 0.8882 | 0.2782 | |||
| EQIX / Equinix, Inc. | 0.05 | -6.42 | 48.23 | -8.05 | 0.8815 | -0.1787 | |||
| URI / United Rentals, Inc. | 0.07 | 23.34 | 47.82 | 36.02 | 0.8740 | 0.1634 | |||
| PG / The Procter & Gamble Company | 0.28 | 11.12 | 46.94 | 8.60 | 0.8579 | -0.0158 | |||
| NFLX / Netflix, Inc. | 0.04 | 10.46 | 46.86 | 36.00 | 0.8563 | 0.1600 | |||
| HON / Honeywell International Inc. | 0.20 | -15.12 | 46.15 | -9.62 | 0.8434 | -0.1887 | |||
| STX / Seagate Technology Holdings plc | 0.38 | 242.20 | 44.90 | 298.30 | 0.8206 | 0.5491 | |||
| TXN / Texas Instruments Incorporated | 0.24 | -0.72 | 42.98 | -7.38 | 0.7855 | -0.1524 | |||
| CTSH / Cognizant Technology Solutions Corporation | 0.52 | 11.22 | 42.33 | 8.10 | 0.7736 | -0.0178 | |||
| CRM / Salesforce, Inc. | 0.16 | 4.52 | 42.17 | -6.88 | 0.7706 | -0.1446 | |||
| PM / Philip Morris International Inc. | 0.23 | -11.27 | 40.64 | 3.20 | 0.7427 | -0.0532 | |||
| APH / Amphenol Corporation | 0.45 | 40.53 | 0.7406 | 0.7406 | |||||
| BRK.B / Berkshire Hathaway Inc. | 0.08 | -5.59 | 40.04 | -7.40 | 0.7318 | -0.1422 | |||
| TSLA / Tesla, Inc. | 0.12 | 47.08 | 39.91 | 73.93 | 0.7294 | 0.2656 | |||
| COF / Capital One Financial Corporation | 0.21 | 12.93 | 39.19 | 6.51 | 0.7162 | -0.0274 | |||
| QSR / Restaurant Brands International Inc. | 0.54 | 6.40 | 38.48 | 16.45 | 0.7033 | 0.0354 | |||
| PNC / The PNC Financial Services Group, Inc. | 0.22 | -2.78 | 38.33 | -11.96 | 0.7006 | -0.1794 | |||
| V / Visa Inc. | 0.10 | 10.90 | 38.01 | 11.66 | 0.6946 | 0.0067 | |||
| EMN / Eastman Chemical Company | 0.48 | 11.21 | 37.94 | -10.93 | 0.6934 | -0.1676 | |||
| SPGI / S&P Global Inc. | 0.07 | -34.69 | 37.16 | -37.25 | 0.6791 | -0.5177 | |||
| IR / Ingersoll Rand Inc. | 0.44 | 11.13 | 35.91 | 7.02 | 0.6563 | -0.0219 | |||
| PKI / Revvity Inc. | 0.39 | 11.19 | 35.36 | -10.36 | 0.6463 | -0.1510 | |||
| CNP / CenterPoint Energy, Inc. | 0.93 | 10.98 | 34.45 | 20.21 | 0.6296 | 0.0504 | |||
| XPO / XPO, Inc. | 0.30 | 13.08 | 33.80 | 4.69 | 0.6177 | -0.0348 | |||
| CB / Chubb Limited | 0.11 | 70.03 | 33.03 | 75.03 | 0.6036 | 0.1491 | |||
| MS / Morgan Stanley | 0.26 | 2.38 | 32.84 | -1.52 | 0.6001 | -0.0738 | |||
| HAS / Hasbro, Inc. | 0.42 | 11.22 | 28.10 | 13.96 | 0.5135 | 0.0152 |