Mga Batayang Estadistika
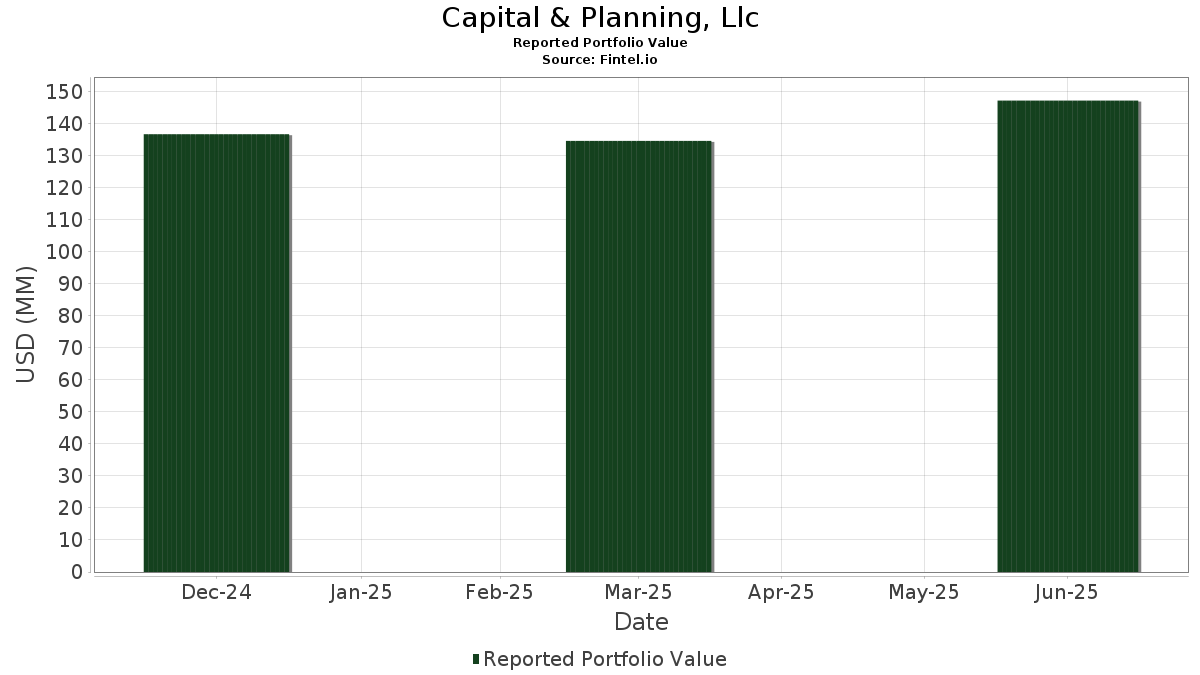
| Nilai Portofolio | $ 147,261,717 |
| Posisi Saat Ini | 36 |
Kepemilikan Terbaru, Kinerja, AUM (dari 13F, 13D)
Capital & Planning, Llc telah mengungkapkan total kepemilikan 36 dalam pengajuan SEC terbaru mereka. Nilai portofolio terbaru dihitung sebesar $ 147,261,717 USD. Aset yang Dikelola (AUM) sebenarnya adalah nilai ini ditambah kas (yang tidak diungkapkan). Aset-aset utama Capital & Planning, Llc adalah Microsoft Corporation (US:MSFT) , Amazon.com, Inc. (US:AMZN) , Visa Inc. (US:V) , Alphabet Inc. (US:GOOGL) , and The Southern Company (US:SO) . Posisi baru Capital & Planning, Llc meliputi: Texas Instruments Incorporated (US:TXN) , Constellation Energy Corporation (US:CEG) , .
Peningkatan Tertinggi Kuartal Ini
Kami menggunakan perubahan dalam alokasi portofolio karena ini adalah metrik yang paling bermakna. Perubahan dapat disebabkan oleh perdagangan atau perubahan harga saham.
| Keamanan | Saham (MM) |
Nilai (Juta Dolar AS) |
Portfolio % | ΔPorsyento ng Portfolio |
|---|---|---|---|---|
| 0.04 | 20.74 | 14.0867 | 2.4422 | |
| 0.07 | 16.34 | 11.0928 | 0.6319 | |
| 0.02 | 3.24 | 2.2005 | 0.5580 | |
| 0.00 | 0.72 | 0.4863 | 0.4863 | |
| 0.00 | 3.12 | 2.1167 | 0.4831 | |
| 0.04 | 3.86 | 2.6209 | 0.4759 | |
| 0.07 | 13.00 | 8.8294 | 0.4195 | |
| 0.00 | 0.34 | 0.2326 | 0.2326 | |
| 0.01 | 0.55 | 0.3752 | 0.1679 | |
| 0.00 | 1.59 | 1.0811 | 0.1669 |
Penurunan Tertinggi Kuartal Ini
Kami menggunakan perubahan dalam alokasi portofolio karena ini adalah metrik yang paling bermakna. Perubahan dapat disebabkan oleh perdagangan atau perubahan harga saham.
| Keamanan | Saham (MM) |
Nilai (Juta Dolar AS) |
Portfolio % | ΔPorsyento ng Portfolio |
|---|---|---|---|---|
| 0.01 | 8.21 | 5.5730 | -0.8278 | |
| 0.04 | 15.13 | 10.2770 | -0.7749 | |
| 0.01 | 2.26 | 1.5330 | -0.6885 | |
| 0.14 | 12.78 | 8.6790 | -0.6750 | |
| 0.05 | 4.69 | 3.1843 | -0.6598 | |
| 0.02 | 5.66 | 3.8467 | -0.5427 | |
| 0.02 | 1.79 | 1.2148 | -0.4603 | |
| 0.02 | 4.95 | 3.3586 | -0.4137 | |
| 0.03 | 4.39 | 2.9813 | -0.3995 | |
| 0.00 | 1.25 | 0.8522 | -0.2676 |
Pengajuan 13F dan Dana
Formulir ini diajukan pada 2025-08-14 untuk periode pelaporan 2025-06-30. Klik ikon tautan untuk melihat riwayat transaksi selengkapnya.
Tingkatkan ke versi premium untuk membuka data premium dan ekspor ke Excel. ![]() .
.
| Keamanan | Ketik | Harga Saham Rata-rata | Saham (MM) |
ΔSaham (%) |
ΔSaham (%) |
Nilai ($MM) |
Portpolyo (%) |
ΔPortofolio (%) |
|
|---|---|---|---|---|---|---|---|---|---|
| MSFT / Microsoft Corporation | 0.04 | -0.17 | 20.74 | 32.29 | 14.0867 | 2.4422 | |||
| AMZN / Amazon.com, Inc. | 0.07 | 0.56 | 16.34 | 15.96 | 11.0928 | 0.6319 | |||
| V / Visa Inc. | 0.04 | 0.37 | 15.13 | 1.69 | 10.2770 | -0.7749 | |||
| GOOGL / Alphabet Inc. | 0.07 | 0.74 | 13.00 | 14.81 | 8.8294 | 0.4195 | |||
| SO / The Southern Company | 0.14 | 1.59 | 12.78 | 1.46 | 8.6790 | -0.6750 | |||
| LLY / Eli Lilly and Company | 0.01 | 0.87 | 8.21 | -4.79 | 5.5730 | -0.8278 | |||
| MCD / McDonald's Corporation | 0.02 | 2.45 | 5.66 | -4.18 | 3.8467 | -0.5427 | |||
| DUK / Duke Energy Corporation | 0.04 | 7.89 | 5.08 | 4.38 | 3.4465 | -0.1644 | |||
| AAPL / Apple Inc. | 0.02 | 5.40 | 4.95 | -2.66 | 3.3586 | -0.4137 | |||
| CHD / Church & Dwight Co., Inc. | 0.05 | 3.76 | 4.69 | -9.41 | 3.1843 | -0.6598 | |||
| PG / The Procter & Gamble Company | 0.03 | 3.14 | 4.39 | -3.56 | 2.9813 | -0.3995 | |||
| UBER / Uber Technologies, Inc. | 0.04 | 4.34 | 3.86 | 33.62 | 2.6209 | 0.4759 | |||
| NVDA / NVIDIA Corporation | 0.02 | 0.49 | 3.24 | 46.54 | 2.2005 | 0.5580 | |||
| META / Meta Platforms, Inc. | 0.00 | 10.64 | 3.12 | 41.68 | 2.1167 | 0.4831 | |||
| CAT / Caterpillar Inc. | 0.01 | -1.04 | 2.73 | 16.49 | 1.8572 | 0.1139 | |||
| GD / General Dynamics Corporation | 0.01 | 2.16 | 2.37 | 9.33 | 1.6085 | -0.0005 | |||
| JNJ / Johnson & Johnson | 0.01 | -18.08 | 2.26 | -24.54 | 1.5330 | -0.6885 | |||
| ADBE / Adobe Inc. | 0.01 | -7.26 | 1.96 | -6.43 | 1.3333 | -0.2251 | |||
| WM / Waste Management, Inc. | 0.01 | 8.94 | 1.80 | 7.67 | 1.2206 | -0.0190 | |||
| INTU / Intuit Inc. | 0.00 | -1.47 | 1.80 | 26.37 | 1.2206 | 0.1646 | |||
| XOM / Exxon Mobil Corporation | 0.02 | -12.51 | 1.79 | -20.71 | 1.2148 | -0.4603 | |||
| MA / Mastercard Incorporated | 0.00 | 26.14 | 1.59 | 29.24 | 1.0811 | 0.1669 | |||
| NEA / Nuveen AMT-Free Quality Municipal Income Fund | 0.13 | 4.05 | 1.37 | 1.48 | 0.9285 | -0.0723 | |||
| HD / The Home Depot, Inc. | 0.00 | 1.92 | 1.29 | 1.98 | 0.8735 | -0.0636 | |||
| WMT / Walmart Inc. | 0.01 | -5.03 | 1.26 | 5.79 | 0.8567 | -0.0289 | |||
| UNH / UnitedHealth Group Incorporated | 0.00 | 39.74 | 1.25 | -16.84 | 0.8522 | -0.2676 | |||
| PREF / Principal Exchange-Traded Funds - Principal Spectrum Preferred Securities Active ETF | 0.04 | -3.64 | 0.73 | -2.28 | 0.4939 | -0.0586 | |||
| TXN / Texas Instruments Incorporated | 0.00 | 0.72 | 0.4863 | 0.4863 | |||||
| PTLC / Pacer Funds Trust - Pacer Trendpilot US Large Cap ETF | 0.01 | -2.48 | 0.61 | -3.82 | 0.4110 | -0.0561 | |||
| IAU / iShares Gold Trust | 0.01 | 87.12 | 0.55 | 97.85 | 0.3752 | 0.1679 | |||
| LOW / Lowe's Companies, Inc. | 0.00 | 62.44 | 0.37 | 54.43 | 0.2489 | 0.0727 | |||
| KO / The Coca-Cola Company | 0.01 | -2.67 | 0.37 | -3.95 | 0.2483 | -0.0341 | |||
| CEG / Constellation Energy Corporation | 0.00 | 0.34 | 0.2326 | 0.2326 | |||||
| TSLA / Tesla, Inc. | 0.00 | 19.61 | 0.33 | 46.64 | 0.2224 | 0.0565 | |||
| YUM / Yum! Brands, Inc. | 0.00 | 0.00 | 0.30 | -5.92 | 0.2057 | -0.0332 | |||
| PNC / The PNC Financial Services Group, Inc. | 0.00 | 0.00 | 0.30 | 6.05 | 0.2025 | -0.0063 |