Mga Batayang Estadistika
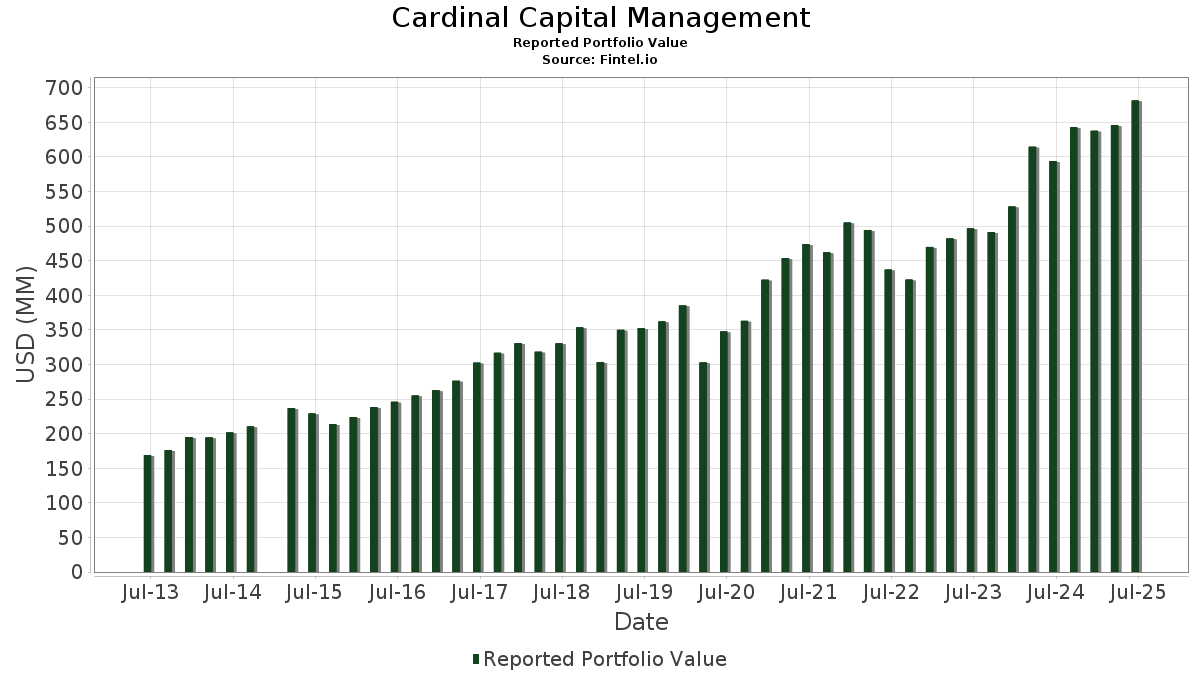
| Nilai Portofolio | $ 681,390,360 |
| Posisi Saat Ini | 128 |
Kepemilikan Terbaru, Kinerja, AUM (dari 13F, 13D)
Cardinal Capital Management telah mengungkapkan total kepemilikan 128 dalam pengajuan SEC terbaru mereka. Nilai portofolio terbaru dihitung sebesar $ 681,390,360 USD. Aset yang Dikelola (AUM) sebenarnya adalah nilai ini ditambah kas (yang tidak diungkapkan). Aset-aset utama Cardinal Capital Management adalah Microsoft Corporation (US:MSFT) , Eli Lilly and Company (US:LLY) , Costco Wholesale Corporation (US:COST) , Apple Inc. (US:AAPL) , and Johnson & Johnson (US:JNJ) .
Peningkatan Tertinggi Kuartal Ini
Kami menggunakan perubahan dalam alokasi portofolio karena ini adalah metrik yang paling bermakna. Perubahan dapat disebabkan oleh perdagangan atau perubahan harga saham.
| Keamanan | Saham (MM) |
Nilai (Juta Dolar AS) |
Portfolio % | ΔPorsyento ng Portfolio |
|---|---|---|---|---|
| 0.05 | 25.39 | 3.7262 | 0.7627 | |
| 0.06 | 17.34 | 2.5447 | 0.4399 | |
| 0.03 | 6.73 | 0.9872 | 0.3558 | |
| 0.01 | 5.81 | 0.8528 | 0.2641 | |
| 0.09 | 11.86 | 1.7406 | 0.2624 | |
| 0.04 | 13.06 | 1.9161 | 0.2248 | |
| 0.01 | 7.65 | 1.1231 | 0.2068 | |
| 0.10 | 7.22 | 1.0595 | 0.1977 | |
| 0.07 | 11.96 | 1.7546 | 0.1446 | |
| 0.09 | 5.60 | 0.8222 | 0.1436 |
Penurunan Tertinggi Kuartal Ini
Kami menggunakan perubahan dalam alokasi portofolio karena ini adalah metrik yang paling bermakna. Perubahan dapat disebabkan oleh perdagangan atau perubahan harga saham.
| Keamanan | Saham (MM) |
Nilai (Juta Dolar AS) |
Portfolio % | ΔPorsyento ng Portfolio |
|---|---|---|---|---|
| 0.03 | 21.82 | 3.2026 | -0.3664 | |
| 0.12 | 17.86 | 2.6215 | -0.2843 | |
| 0.03 | 5.40 | 0.7923 | -0.2729 | |
| 0.11 | 12.36 | 1.8138 | -0.2666 | |
| 0.09 | 18.00 | 2.6418 | -0.2395 | |
| 0.10 | 4.68 | 0.6866 | -0.2358 | |
| 0.09 | 8.01 | 1.1755 | -0.2291 | |
| 0.01 | 3.50 | 0.5134 | -0.1822 | |
| 0.01 | 0.12 | 0.0172 | -0.1631 | |
| 0.13 | 6.81 | 0.9997 | -0.1599 |
Pengajuan 13F dan Dana
Formulir ini diajukan pada 2025-07-15 untuk periode pelaporan 2025-06-30. Klik ikon tautan untuk melihat riwayat transaksi selengkapnya.
Tingkatkan ke versi premium untuk membuka data premium dan ekspor ke Excel. ![]() .
.
| Keamanan | Ketik | Harga Saham Rata-rata | Saham (MM) |
ΔSaham (%) |
ΔSaham (%) |
Nilai ($MM) |
Portpolyo (%) |
ΔPortofolio (%) |
|
|---|---|---|---|---|---|---|---|---|---|
| MSFT / Microsoft Corporation | 0.05 | 0.13 | 25.39 | 32.68 | 3.7262 | 0.7627 | |||
| LLY / Eli Lilly and Company | 0.03 | 0.32 | 21.82 | -5.31 | 3.2026 | -0.3664 | |||
| COST / Costco Wholesale Corporation | 0.02 | -1.68 | 20.87 | 2.91 | 3.0630 | -0.0776 | |||
| AAPL / Apple Inc. | 0.09 | 4.75 | 18.00 | -3.25 | 2.6418 | -0.2395 | |||
| JNJ / Johnson & Johnson | 0.12 | 3.36 | 17.86 | -4.80 | 2.6215 | -0.2843 | |||
| JPM / JPMorgan Chase & Co. | 0.06 | 7.95 | 17.34 | 27.58 | 2.5447 | 0.4399 | |||
| WMT / Walmart Inc. | 0.16 | -0.55 | 15.50 | 10.48 | 2.2746 | 0.1021 | |||
| DE / Deere & Company | 0.03 | 1.40 | 14.33 | 9.83 | 2.1025 | 0.0825 | |||
| ADP / Automatic Data Processing, Inc. | 0.04 | 1.16 | 13.31 | 2.10 | 1.9534 | -0.0654 | |||
| IBM / International Business Machines Corporation | 0.04 | 0.84 | 13.06 | 19.55 | 1.9161 | 0.2248 | |||
| BK / The Bank of New York Mellon Corporation | 0.14 | 0.82 | 12.88 | 9.52 | 1.8903 | 0.0690 | |||
| XOM / Exxon Mobil Corporation | 0.11 | 1.50 | 12.36 | -8.00 | 1.8138 | -0.2666 | |||
| GOOGL / Alphabet Inc. | 0.07 | 0.91 | 11.96 | 15.01 | 1.7546 | 0.1446 | |||
| EMR / Emerson Electric Co. | 0.09 | 2.18 | 11.86 | 24.25 | 1.7406 | 0.2624 | |||
| ECL / Ecolab Inc. | 0.04 | 1.74 | 11.56 | 8.11 | 1.6962 | 0.0406 | |||
| CSCO / Cisco Systems, Inc. | 0.16 | 1.61 | 10.88 | 14.24 | 1.5962 | 0.1217 | |||
| QCOM / QUALCOMM Incorporated | 0.07 | 2.53 | 10.84 | 6.29 | 1.5914 | 0.0116 | |||
| LOW / Lowe's Companies, Inc. | 0.05 | 2.35 | 10.66 | -2.63 | 1.5641 | -0.1310 | |||
| ITW / Illinois Tool Works Inc. | 0.04 | 2.33 | 10.62 | 2.02 | 1.5590 | -0.0536 | |||
| LH / Labcorp Holdings Inc. | 0.04 | 3.13 | 9.93 | 16.33 | 1.4577 | 0.1354 | |||
| PG / The Procter & Gamble Company | 0.06 | 2.04 | 9.03 | -4.62 | 1.3254 | -0.1408 | |||
| TFC / Truist Financial Corporation | 0.21 | 3.27 | 8.83 | 7.88 | 1.2954 | 0.0284 | |||
| A / Agilent Technologies, Inc. | 0.07 | 4.60 | 8.68 | 5.52 | 1.2740 | 0.0000 | |||
| NFG / National Fuel Gas Company | 0.10 | 3.03 | 8.42 | 10.21 | 1.2359 | 0.0524 | |||
| SAP / SAP SE - Depositary Receipt (Common Stock) | 0.03 | -0.28 | 8.28 | 12.96 | 1.2151 | 0.0801 | |||
| SBUX / Starbucks Corporation | 0.09 | 5.94 | 8.23 | -1.05 | 1.2078 | -0.0801 | |||
| MMM / 3M Company | 0.05 | 4.08 | 8.13 | 7.90 | 1.1926 | 0.0262 | |||
| COP / ConocoPhillips | 0.09 | 3.34 | 8.01 | -11.70 | 1.1755 | -0.2291 | |||
| IDXX / IDEXX Laboratories, Inc. | 0.01 | 1.27 | 7.65 | 29.34 | 1.1231 | 0.2068 | |||
| MKC / McCormick & Company, Incorporated | 0.10 | 3.78 | 7.60 | -4.42 | 1.1148 | -0.1158 | |||
| MRK / Merck & Co., Inc. | 0.09 | 5.63 | 7.42 | -6.73 | 1.0882 | -0.1431 | |||
| HAS / Hasbro, Inc. | 0.10 | 8.06 | 7.22 | 29.74 | 1.0595 | 0.1977 | |||
| MDT / Medtronic plc | 0.08 | 5.50 | 7.09 | 2.37 | 1.0411 | -0.0320 | |||
| CMI / Cummins Inc. | 0.02 | 2.28 | 7.04 | 6.86 | 1.0333 | 0.0130 | |||
| GIS / General Mills, Inc. | 0.13 | 4.99 | 6.81 | -9.03 | 0.9997 | -0.1599 | |||
| AGX / Argan, Inc. | 0.03 | -1.85 | 6.73 | 64.97 | 0.9872 | 0.3558 | |||
| TROW / T. Rowe Price Group, Inc. | 0.07 | 7.21 | 6.70 | 12.62 | 0.9835 | 0.0619 | |||
| KEYS / Keysight Technologies, Inc. | 0.04 | 1.93 | 6.50 | 11.53 | 0.9543 | 0.0513 | |||
| NVS / Novartis AG - Depositary Receipt (Common Stock) | 0.05 | 2.21 | 5.93 | 7.27 | 0.8704 | 0.0142 | |||
| STT / State Street Corporation | 0.06 | 1.75 | 5.89 | 20.85 | 0.8645 | 0.1097 | |||
| KO / The Coca-Cola Company | 0.08 | 1.07 | 5.86 | -0.15 | 0.8604 | -0.0488 | |||
| CW / Curtiss-Wright Corporation | 0.01 | -0.72 | 5.81 | 52.88 | 0.8528 | 0.2641 | |||
| USLM / United States Lime & Minerals, Inc. | 0.06 | -1.28 | 5.74 | 11.46 | 0.8421 | 0.0450 | |||
| ODC / Oil-Dri Corporation of America | 0.09 | -0.48 | 5.60 | 27.84 | 0.8222 | 0.1436 | |||
| FFIV / F5, Inc. | 0.02 | 0.68 | 5.45 | 11.28 | 0.7992 | 0.0414 | |||
| BMI / Badger Meter, Inc. | 0.02 | -0.41 | 5.44 | 28.22 | 0.7982 | 0.1413 | |||
| BDX / Becton, Dickinson and Company | 0.03 | 4.37 | 5.40 | -21.52 | 0.7923 | -0.2729 | |||
| RY / Royal Bank of Canada | 0.04 | 1.59 | 5.17 | 18.57 | 0.7592 | 0.0835 | |||
| RJF / Raymond James Financial, Inc. | 0.03 | 0.70 | 4.98 | 11.17 | 0.7302 | 0.0371 | |||
| VEEV / Veeva Systems Inc. | 0.02 | 2.44 | 4.73 | 27.37 | 0.6946 | 0.1191 | |||
| BMY / Bristol-Myers Squibb Company | 0.10 | 3.50 | 4.68 | -21.46 | 0.6866 | -0.2358 | |||
| REGN / Regeneron Pharmaceuticals, Inc. | 0.01 | 3.48 | 4.37 | -14.34 | 0.6407 | -0.1486 | |||
| PEP / PepsiCo, Inc. | 0.03 | 2.51 | 4.36 | -9.74 | 0.6395 | -0.1080 | |||
| MORN / Morningstar, Inc. | 0.01 | 12.31 | 4.35 | 17.60 | 0.6383 | 0.0655 | |||
| DXCM / DexCom, Inc. | 0.05 | 3.74 | 4.13 | 32.63 | 0.6056 | 0.1237 | |||
| BCPC / Balchem Corporation | 0.03 | 0.14 | 4.12 | -3.96 | 0.6046 | -0.0597 | |||
| TM / Toyota Motor Corporation - Depositary Receipt (Common Stock) | 0.02 | 2.68 | 4.09 | 0.20 | 0.6005 | -0.0319 | |||
| FDX / FedEx Corporation | 0.02 | 4.20 | 4.04 | -2.77 | 0.5923 | -0.0505 | |||
| SHEL / Shell plc - Depositary Receipt (Common Stock) | 0.06 | 1.49 | 4.00 | -2.49 | 0.5866 | -0.0482 | |||
| TDY / Teledyne Technologies Incorporated | 0.01 | 0.42 | 3.89 | 3.38 | 0.5708 | -0.0119 | |||
| CACI / CACI International Inc | 0.01 | -1.19 | 3.88 | 28.38 | 0.5691 | 0.1013 | |||
| ESLT / Elbit Systems Ltd. | 0.01 | -33.61 | 3.50 | -22.11 | 0.5134 | -0.1822 | |||
| SNA / Snap-on Incorporated | 0.01 | 1.12 | 3.47 | -6.61 | 0.5099 | -0.0663 | |||
| SNY / Sanofi - Depositary Receipt (Common Stock) | 0.07 | 2.95 | 3.43 | -10.30 | 0.5037 | -0.0890 | |||
| NVO / Novo Nordisk A/S - Depositary Receipt (Common Stock) | 0.05 | 2.40 | 3.42 | 0.15 | 0.5022 | -0.0269 | |||
| UTHR / United Therapeutics Corporation | 0.01 | 1.51 | 3.41 | -5.38 | 0.5008 | -0.0577 | |||
| MASI / Masimo Corporation | 0.02 | 1.86 | 3.40 | 2.84 | 0.4996 | -0.0130 | |||
| TD / The Toronto-Dominion Bank | 0.05 | 1.46 | 3.37 | 24.32 | 0.4945 | 0.0748 | |||
| LSTR / Landstar System, Inc. | 0.02 | 2.00 | 3.37 | -5.58 | 0.4944 | -0.0582 | |||
| PSX / Phillips 66 | 0.03 | 4.65 | 3.33 | 1.12 | 0.4890 | -0.0213 | |||
| BNS / The Bank of Nova Scotia | 0.06 | 4.64 | 3.32 | 21.97 | 0.4873 | 0.0656 | |||
| DLB / Dolby Laboratories, Inc. | 0.04 | 1.76 | 3.27 | -5.89 | 0.4804 | -0.0583 | |||
| IDCC / InterDigital, Inc. | 0.01 | -0.03 | 3.26 | 8.45 | 0.4783 | 0.0128 | |||
| HBAN / Huntington Bancshares Incorporated | 0.19 | 1.20 | 3.14 | 12.86 | 0.4612 | 0.0300 | |||
| JKHY / Jack Henry & Associates, Inc. | 0.02 | 0.16 | 3.09 | -1.18 | 0.4538 | -0.0307 | |||
| SR / Spire Inc. | 0.04 | 1.89 | 3.00 | -4.88 | 0.4408 | -0.0483 | |||
| WBS / Webster Financial Corporation | 0.05 | 2.64 | 2.90 | 8.71 | 0.4250 | 0.0125 | |||
| SYNA / Synaptics Incorporated | 0.04 | 5.62 | 2.84 | 7.41 | 0.4169 | 0.0074 | |||
| TTE / TotalEnergies SE - Depositary Receipt (Common Stock) | 0.04 | 2.14 | 2.74 | -2.84 | 0.4022 | -0.0346 | |||
| GOOG / Alphabet Inc. | 0.01 | 0.89 | 2.62 | 14.54 | 0.3850 | 0.0303 | |||
| GGG / Graco Inc. | 0.03 | -0.88 | 2.59 | 2.01 | 0.3804 | -0.0130 | |||
| BSAC / Banco Santander-Chile - Depositary Receipt (Common Stock) | 0.10 | 0.88 | 2.52 | 11.60 | 0.3700 | 0.0201 | |||
| UL / Unilever PLC - Depositary Receipt (Common Stock) | 0.04 | 2.33 | 2.50 | 5.09 | 0.3670 | -0.0014 | |||
| PAHC / Phibro Animal Health Corporation | 0.10 | 28.83 | 2.47 | 54.06 | 0.3622 | 0.1141 | |||
| UPS / United Parcel Service, Inc. | 0.02 | 2.25 | 2.44 | -6.15 | 0.3583 | -0.0446 | |||
| CRUS / Cirrus Logic, Inc. | 0.02 | 0.04 | 2.44 | 4.63 | 0.3581 | -0.0030 | |||
| LNN / Lindsay Corporation | 0.02 | -1.04 | 2.39 | 12.84 | 0.3510 | 0.0227 | |||
| GSK / GSK plc - Depositary Receipt (Common Stock) | 0.06 | 2.72 | 2.34 | 1.88 | 0.3428 | -0.0122 | |||
| DD / DuPont de Nemours, Inc. | 0.03 | 6.29 | 2.33 | -2.35 | 0.3417 | -0.0276 | |||
| CFR / Cullen/Frost Bankers, Inc. | 0.02 | 0.46 | 2.29 | 3.15 | 0.3362 | -0.0078 | |||
| OZK / Bank OZK | 0.05 | -0.94 | 2.27 | 7.29 | 0.3327 | 0.0055 | |||
| UNB / Union Bankshares, Inc. | 0.08 | 2.14 | 2.25 | -13.60 | 0.3302 | -0.0731 | |||
| FNB / F.N.B. Corporation | 0.14 | 1.19 | 2.05 | 9.68 | 0.3009 | 0.0114 | |||
| CTVA / Corteva, Inc. | 0.03 | 1.94 | 2.01 | 20.76 | 0.2946 | 0.0371 | |||
| KE / Kimball Electronics, Inc. | 0.10 | 1.66 | 1.93 | 18.81 | 0.2838 | 0.0318 | |||
| VC / Visteon Corporation | 0.02 | 0.70 | 1.87 | 21.03 | 0.2738 | 0.0351 | |||
| CHKP / Check Point Software Technologies Ltd. | 0.01 | 0.79 | 1.84 | -2.18 | 0.2699 | -0.0212 | |||
| NXPI / NXP Semiconductors N.V. | 0.01 | 1.58 | 1.82 | 16.70 | 0.2677 | 0.0256 | |||
| SAM / The Boston Beer Company, Inc. | 0.01 | 21.54 | 1.82 | -2.88 | 0.2669 | -0.0231 | |||
| PLPC / Preformed Line Products Company | 0.01 | 2.46 | 1.82 | 16.85 | 0.2668 | 0.0259 | |||
| WLY / John Wiley & Sons, Inc. | 0.04 | 1.90 | 1.74 | 2.06 | 0.2547 | -0.0086 | |||
| WOR / Worthington Enterprises, Inc. | 0.03 | 2.03 | 1.73 | 29.59 | 0.2540 | 0.0472 | |||
| LZB / La-Z-Boy Incorporated | 0.05 | 1.70 | 1.71 | -3.29 | 0.2506 | -0.0228 | |||
| ALC / Alcon Inc. | 0.02 | 6.67 | 1.70 | -0.82 | 0.2494 | -0.0159 | |||
| HUBG / Hub Group, Inc. | 0.05 | 1.87 | 1.65 | -8.37 | 0.2428 | -0.0368 | |||
| CRL / Charles River Laboratories International, Inc. | 0.01 | 1.37 | 1.65 | 2.17 | 0.2421 | -0.0079 | |||
| RHI / Robert Half Inc. | 0.04 | 3.20 | 1.64 | -22.35 | 0.2402 | -0.0862 | |||
| OLED / Universal Display Corporation | 0.01 | 3.05 | 1.61 | 14.10 | 0.2364 | 0.0178 | |||
| HAE / Haemonetics Corporation | 0.02 | 3.30 | 1.53 | 21.29 | 0.2241 | 0.0291 | |||
| IT / Gartner, Inc. | 0.00 | 1.40 | 1.52 | -2.37 | 0.2235 | -0.0180 | |||
| JAZZ / Jazz Pharmaceuticals plc | 0.01 | 5.61 | 1.49 | -9.73 | 0.2180 | -0.0368 | |||
| GNTX / Gentex Corporation | 0.07 | -6.49 | 1.46 | -11.76 | 0.2138 | -0.0418 | |||
| ALRM / Alarm.com Holdings, Inc. | 0.03 | 2.69 | 1.45 | 4.38 | 0.2135 | -0.0023 | |||
| MIDD / The Middleby Corporation | 0.01 | 2.40 | 1.45 | -3.01 | 0.2129 | -0.0187 | |||
| SEE / Sealed Air Corporation | 0.05 | 3.00 | 1.45 | 10.61 | 0.2128 | 0.0097 | |||
| IIIN / Insteel Industries, Inc. | 0.04 | 2.81 | 1.45 | 45.48 | 0.2127 | 0.0584 | |||
| MHK / Mohawk Industries, Inc. | 0.01 | 1.71 | 1.44 | -6.62 | 0.2112 | -0.0274 | |||
| UTMD / Utah Medical Products, Inc. | 0.02 | 4.17 | 1.30 | 5.76 | 0.1913 | 0.0005 | |||
| OFLX / Omega Flex, Inc. | 0.04 | 44.97 | 1.27 | 36.33 | 0.1868 | 0.0423 | |||
| TMP / Tompkins Financial Corporation | 0.02 | 4.45 | 1.21 | 4.03 | 0.1780 | -0.0025 | |||
| NVEC / NVE Corporation | 0.02 | 4.67 | 1.15 | 20.84 | 0.1694 | 0.0215 | |||
| HSIC / Henry Schein, Inc. | 0.02 | 2.68 | 1.11 | 9.58 | 0.1628 | 0.0059 | |||
| IGSB / iShares Trust - iShares 1-5 Year Investment Grade Corporate Bond ETF | 0.02 | 0.00 | 0.81 | 0.75 | 0.1188 | -0.0056 | |||
| WS / Worthington Steel, Inc. | 0.02 | 2.67 | 0.49 | 20.88 | 0.0722 | 0.0092 | |||
| HLN / Haleon plc - Depositary Receipt (Common Stock) | 0.05 | 1.13 | 0.49 | 2.10 | 0.0715 | -0.0025 | |||
| SPY / SPDR S&P 500 ETF | 0.00 | 1.10 | 0.34 | 11.76 | 0.0503 | 0.0028 | |||
| INTC / Intel Corporation | 0.01 | 0.05 | 0.26 | -1.14 | 0.0384 | -0.0027 | |||
| AMCR / Amcor plc | 0.01 | -89.36 | 0.12 | -89.95 | 0.0172 | -0.1631 | |||
| DOW / Dow Inc. | 0.00 | -100.00 | 0.00 | 0.0000 | |||||
| BA / The Boeing Company | 0.00 | -100.00 | 0.00 | 0.0000 | |||||
| HLIO / Helios Technologies, Inc. | 0.00 | -100.00 | 0.00 | 0.0000 | |||||
| PFE / Pfizer Inc. | 0.00 | -100.00 | 0.00 | 0.0000 |