Mga Batayang Estadistika
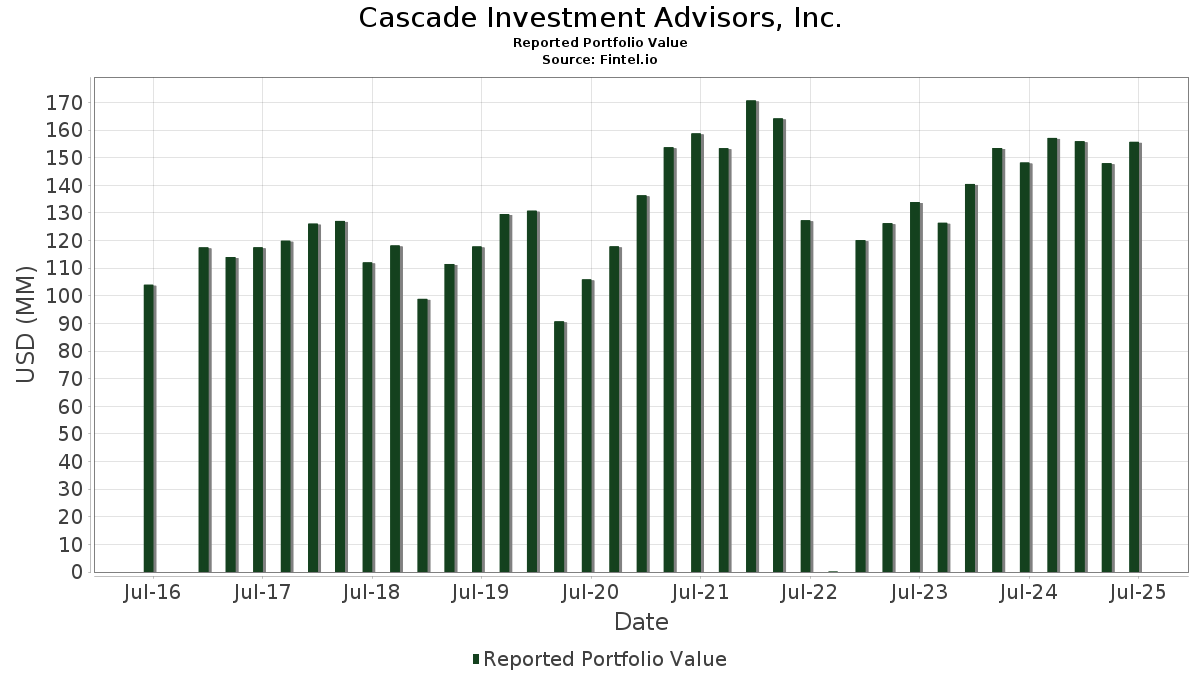
| Nilai Portofolio | $ 155,718,089 |
| Posisi Saat Ini | 110 |
Kepemilikan Terbaru, Kinerja, AUM (dari 13F, 13D)
Cascade Investment Advisors, Inc. telah mengungkapkan total kepemilikan 110 dalam pengajuan SEC terbaru mereka. Nilai portofolio terbaru dihitung sebesar $ 155,718,089 USD. Aset yang Dikelola (AUM) sebenarnya adalah nilai ini ditambah kas (yang tidak diungkapkan). Aset-aset utama Cascade Investment Advisors, Inc. adalah Microsoft Corporation (US:MSFT) , Amazon.com, Inc. (US:AMZN) , Apple Inc. (US:AAPL) , Jabil Inc. (US:JBL) , and The Charles Schwab Corporation (US:SCHW) . Posisi baru Cascade Investment Advisors, Inc. meliputi: Mueller Industries, Inc. (US:MLI) , Grocery Outlet Holding Corp. (US:GO) , Air Products and Chemicals, Inc. (US:APD) , .
Peningkatan Tertinggi Kuartal Ini
Kami menggunakan perubahan dalam alokasi portofolio karena ini adalah metrik yang paling bermakna. Perubahan dapat disebabkan oleh perdagangan atau perubahan harga saham.
| Keamanan | Saham (MM) |
Nilai (Juta Dolar AS) |
Portfolio % | ΔPorsyento ng Portfolio |
|---|---|---|---|---|
| 0.01 | 1.29 | 0.8308 | 0.8308 | |
| 0.02 | 3.78 | 2.4295 | 0.7701 | |
| 0.00 | 1.10 | 0.7050 | 0.7050 | |
| 0.01 | 1.05 | 0.6754 | 0.6754 | |
| 0.01 | 5.15 | 3.3083 | 0.6662 | |
| 0.01 | 3.01 | 1.9359 | 0.5296 | |
| 0.06 | 0.78 | 0.5033 | 0.5033 | |
| 0.03 | 1.67 | 1.0726 | 0.3958 | |
| 0.03 | 1.92 | 1.2310 | 0.3598 | |
| 0.00 | 0.54 | 0.3443 | 0.3443 |
Penurunan Tertinggi Kuartal Ini
Kami menggunakan perubahan dalam alokasi portofolio karena ini adalah metrik yang paling bermakna. Perubahan dapat disebabkan oleh perdagangan atau perubahan harga saham.
| Keamanan | Saham (MM) |
Nilai (Juta Dolar AS) |
Portfolio % | ΔPorsyento ng Portfolio |
|---|---|---|---|---|
| 0.02 | 3.79 | 2.4326 | -0.4308 | |
| 0.02 | 0.98 | 0.6290 | -0.2608 | |
| 0.01 | 1.98 | 1.2726 | -0.2460 | |
| 0.01 | 1.14 | 0.7300 | -0.2413 | |
| 0.03 | 1.67 | 1.0717 | -0.2165 | |
| 0.02 | 1.40 | 0.8982 | -0.2115 | |
| 0.01 | 2.61 | 1.6736 | -0.2026 | |
| 0.01 | 1.17 | 0.7519 | -0.1889 | |
| 0.01 | 1.48 | 0.9503 | -0.1887 | |
| 0.00 | 1.06 | 0.6801 | -0.1873 |
Pengajuan 13F dan Dana
Formulir ini diajukan pada 2025-07-25 untuk periode pelaporan 2025-06-30. Klik ikon tautan untuk melihat riwayat transaksi selengkapnya.
Tingkatkan ke versi premium untuk membuka data premium dan ekspor ke Excel. ![]() .
.
| Keamanan | Ketik | Harga Saham Rata-rata | Saham (MM) |
ΔSaham (%) |
ΔSaham (%) |
Nilai ($MM) |
Portpolyo (%) |
ΔPortofolio (%) |
|
|---|---|---|---|---|---|---|---|---|---|
| MSFT / Microsoft Corporation | 0.01 | -0.56 | 5.15 | 31.77 | 3.3083 | 0.6662 | |||
| AMZN / Amazon.com, Inc. | 0.02 | -1.06 | 3.80 | 14.08 | 2.4406 | 0.1895 | |||
| AAPL / Apple Inc. | 0.02 | -3.21 | 3.79 | -10.60 | 2.4326 | -0.4308 | |||
| JBL / Jabil Inc. | 0.02 | -3.88 | 3.78 | 54.09 | 2.4295 | 0.7701 | |||
| SCHW / The Charles Schwab Corporation | 0.04 | -3.84 | 3.28 | 12.10 | 2.1064 | 0.1287 | |||
| VTI / Vanguard Index Funds - Vanguard Total Stock Market ETF | 0.01 | 10.92 | 3.26 | 22.62 | 2.0960 | 0.2977 | |||
| USB / U.S. Bancorp | 0.07 | 1.04 | 3.08 | 8.30 | 1.9789 | 0.0558 | |||
| ORCL / Oracle Corporation | 0.01 | -7.36 | 3.01 | 44.90 | 1.9359 | 0.5296 | |||
| NVS / Novartis AG - Depositary Receipt (Common Stock) | 0.02 | -2.16 | 2.63 | 6.21 | 1.6906 | 0.0155 | |||
| CSCO / Cisco Systems, Inc. | 0.04 | -4.67 | 2.62 | 7.20 | 1.6841 | 0.0306 | |||
| GOOGL / Alphabet Inc. | 0.01 | -17.63 | 2.61 | -6.12 | 1.6736 | -0.2026 | |||
| AMAT / Applied Materials, Inc. | 0.01 | 2.93 | 2.61 | 29.86 | 1.6732 | 0.3171 | |||
| ICE / Intercontinental Exchange, Inc. | 0.01 | -0.36 | 2.51 | 5.94 | 1.6143 | 0.0112 | |||
| META / Meta Platforms, Inc. | 0.00 | -3.67 | 2.36 | 23.38 | 1.5187 | 0.2232 | |||
| HLT / Hilton Worldwide Holdings Inc. | 0.01 | -5.45 | 2.36 | 10.68 | 1.5173 | 0.0745 | |||
| CMI / Cummins Inc. | 0.01 | -0.29 | 2.25 | 4.21 | 1.4478 | -0.0146 | |||
| CAT / Caterpillar Inc. | 0.01 | -8.82 | 2.17 | 7.33 | 1.3911 | 0.0271 | |||
| OSIS / OSI Systems, Inc. | 0.01 | -9.23 | 2.16 | 5.02 | 1.3845 | -0.0028 | |||
| WSM / Williams-Sonoma, Inc. | 0.01 | -14.66 | 1.98 | -11.84 | 1.2726 | -0.2460 | |||
| JLL / Jones Lang LaSalle Incorporated | 0.01 | -0.84 | 1.96 | 2.35 | 1.2594 | -0.0360 | |||
| PCAR / PACCAR Inc | 0.02 | -3.83 | 1.95 | -6.08 | 1.2505 | -0.1511 | |||
| MDT / Medtronic plc | 0.02 | 0.43 | 1.93 | -2.57 | 1.2402 | -0.0994 | |||
| CTSH / Cognizant Technology Solutions Corporation | 0.02 | -0.28 | 1.92 | 1.69 | 1.2336 | -0.0427 | |||
| MCHP / Microchip Technology Incorporated | 0.03 | 2.29 | 1.92 | 48.64 | 1.2310 | 0.3598 | |||
| SBUX / Starbucks Corporation | 0.02 | 5.06 | 1.89 | -1.82 | 1.2138 | -0.0878 | |||
| TXRH / Texas Roadhouse, Inc. | 0.01 | -15.74 | 1.86 | -5.24 | 1.1967 | -0.1321 | |||
| PYPL / PayPal Holdings, Inc. | 0.03 | -1.48 | 1.86 | 12.24 | 1.1953 | 0.0744 | |||
| VOYA / Voya Financial, Inc. | 0.03 | 1.85 | 1.85 | 6.74 | 1.1900 | 0.0166 | |||
| NTR / Nutrien Ltd. | 0.03 | -3.16 | 1.79 | 13.54 | 1.1471 | 0.0840 | |||
| KMI / Kinder Morgan, Inc. | 0.06 | -1.84 | 1.77 | 1.14 | 1.1359 | -0.0458 | |||
| PAYC / Paycom Software, Inc. | 0.01 | -3.70 | 1.75 | 1.99 | 1.1218 | -0.0356 | |||
| EMR / Emerson Electric Co. | 0.01 | -5.19 | 1.73 | 15.32 | 1.1116 | 0.0971 | |||
| SPG / Simon Property Group, Inc. | 0.01 | -2.52 | 1.71 | -5.68 | 1.0988 | -0.1266 | |||
| ECG / Everus Construction Group, Inc. | 0.03 | -2.64 | 1.67 | 66.83 | 1.0726 | 0.3958 | |||
| SNY / Sanofi - Depositary Receipt (Common Stock) | 0.03 | 0.51 | 1.67 | -12.49 | 1.0717 | -0.2165 | |||
| QCOM / QUALCOMM Incorporated | 0.01 | 0.05 | 1.66 | 3.75 | 1.0671 | -0.0155 | |||
| MDU / MDU Resources Group, Inc. | 0.10 | 19.05 | 1.66 | 17.36 | 1.0639 | 0.1099 | |||
| ABNB / Airbnb, Inc. | 0.01 | 2.43 | 1.62 | 13.48 | 1.0381 | 0.0754 | |||
| MET / MetLife, Inc. | 0.02 | -2.47 | 1.59 | -2.34 | 1.0184 | -0.0787 | |||
| CHRW / C.H. Robinson Worldwide, Inc. | 0.02 | -0.37 | 1.55 | -6.64 | 0.9937 | -0.1265 | |||
| PFE / Pfizer Inc. | 0.06 | -1.61 | 1.54 | -5.88 | 0.9864 | -0.1166 | |||
| AIZ / Assurant, Inc. | 0.01 | 2.45 | 1.51 | -3.51 | 0.9717 | -0.0884 | |||
| BYD / Boyd Gaming Corporation | 0.02 | -7.20 | 1.51 | 10.28 | 0.9714 | 0.0445 | |||
| JNJ / Johnson & Johnson | 0.01 | -4.67 | 1.48 | -12.23 | 0.9503 | -0.1887 | |||
| ZBRA / Zebra Technologies Corporation | 0.00 | 2.75 | 1.44 | 12.15 | 0.9250 | 0.0569 | |||
| GTLS / Chart Industries, Inc. | 0.01 | 6.28 | 1.43 | 21.22 | 0.9215 | 0.1215 | |||
| BANR / Banner Corporation | 0.02 | -3.88 | 1.41 | -3.35 | 0.9080 | -0.0802 | |||
| COP / ConocoPhillips | 0.02 | -0.32 | 1.40 | -14.81 | 0.8982 | -0.2115 | |||
| UPS / United Parcel Service, Inc. | 0.01 | 27.83 | 1.37 | 17.29 | 0.8800 | 0.0906 | |||
| CTRA / Coterra Energy Inc. | 0.05 | 1.38 | 1.33 | -11.01 | 0.8565 | -0.1559 | |||
| PSA / Public Storage | 0.00 | -4.35 | 1.32 | -6.17 | 0.8496 | -0.1038 | |||
| SUI / Sun Communities, Inc. | 0.01 | -1.15 | 1.31 | -2.82 | 0.8410 | -0.0695 | |||
| CARR / Carrier Global Corporation | 0.02 | -0.42 | 1.30 | 14.89 | 0.8328 | 0.0704 | |||
| AKAM / Akamai Technologies, Inc. | 0.02 | 7.59 | 1.30 | 6.67 | 0.8317 | 0.0106 | |||
| BWXT / BWX Technologies, Inc. | 0.01 | 1.29 | 0.8308 | 0.8308 | |||||
| CMC / Commercial Metals Company | 0.03 | -9.16 | 1.28 | -3.41 | 0.8192 | -0.0735 | |||
| HII / Huntington Ingalls Industries, Inc. | 0.01 | -10.98 | 1.26 | 5.34 | 0.8110 | 0.0009 | |||
| KNF / Knife River Corporation | 0.02 | -0.26 | 1.25 | -9.73 | 0.8051 | -0.1335 | |||
| NSIT / Insight Enterprises, Inc. | 0.01 | -3.23 | 1.24 | -10.93 | 0.7959 | -0.1443 | |||
| MDLZ / Mondelez International, Inc. | 0.02 | 0.00 | 1.24 | -0.64 | 0.7936 | -0.0466 | |||
| HD / The Home Depot, Inc. | 0.00 | 1.57 | 1.23 | 1.65 | 0.7909 | -0.0282 | |||
| NUE / Nucor Corporation | 0.01 | -9.84 | 1.23 | -2.92 | 0.7901 | -0.0666 | |||
| SWK / Stanley Black & Decker, Inc. | 0.02 | 8.83 | 1.17 | -4.09 | 0.7533 | -0.0733 | |||
| CVX / Chevron Corporation | 0.01 | -1.74 | 1.17 | -15.95 | 0.7519 | -0.1889 | |||
| KIM / Kimco Realty Corporation | 0.05 | -3.17 | 1.16 | -4.15 | 0.7420 | -0.0729 | |||
| TEX / Terex Corporation | 0.02 | 1.96 | 1.15 | 25.98 | 0.7415 | 0.1222 | |||
| WFC / Wells Fargo & Company | 0.01 | -0.09 | 1.15 | 11.50 | 0.7413 | 0.0417 | |||
| BAX / Baxter International Inc. | 0.04 | 1.75 | 1.15 | -10.02 | 0.7390 | -0.1250 | |||
| FDX / FedEx Corporation | 0.01 | -15.18 | 1.14 | -20.95 | 0.7300 | -0.2413 | |||
| CVCO / Cavco Industries, Inc. | 0.00 | 1.10 | 0.7050 | 0.7050 | |||||
| TTMI / TTM Technologies, Inc. | 0.03 | -8.70 | 1.09 | 81.70 | 0.7019 | 0.2954 | |||
| ROCK / Gibraltar Industries, Inc. | 0.02 | -11.71 | 1.09 | -11.19 | 0.6983 | -0.1292 | |||
| BRK.B / Berkshire Hathaway Inc. | 0.00 | -9.54 | 1.06 | -17.54 | 0.6801 | -0.1873 | |||
| MLI / Mueller Industries, Inc. | 0.01 | 1.05 | 0.6754 | 0.6754 | |||||
| UFPI / UFP Industries, Inc. | 0.01 | 1.34 | 1.02 | -5.93 | 0.6521 | -0.0774 | |||
| FPX / First Trust Exchange-Traded Fund - First Trust US Equity Opportunities ETF | 0.01 | 0.30 | 0.98 | 30.16 | 0.6320 | 0.1207 | |||
| SON / Sonoco Products Company | 0.02 | -19.32 | 0.98 | -25.61 | 0.6290 | -0.2608 | |||
| ARE / Alexandria Real Estate Equities, Inc. | 0.01 | 11.12 | 0.96 | -12.79 | 0.6139 | -0.1266 | |||
| JPM / JPMorgan Chase & Co. | 0.00 | 0.00 | 0.95 | 18.14 | 0.6113 | 0.0670 | |||
| LOW / Lowe's Companies, Inc. | 0.00 | 0.00 | 0.88 | -4.85 | 0.5667 | -0.0602 | |||
| GO / Grocery Outlet Holding Corp. | 0.06 | 0.78 | 0.5033 | 0.5033 | |||||
| WY / Weyerhaeuser Company | 0.03 | 17.36 | 0.76 | 2.97 | 0.4902 | -0.0108 | |||
| USFR / WisdomTree Trust - WisdomTree Floating Rate Treasury Fund | 0.01 | 10.85 | 0.75 | 10.78 | 0.4821 | 0.0242 | |||
| WGO / Winnebago Industries, Inc. | 0.03 | 4.63 | 0.74 | -11.96 | 0.4733 | -0.0923 | |||
| PK / Park Hotels & Resorts Inc. | 0.07 | -5.36 | 0.73 | -9.42 | 0.4698 | -0.0756 | |||
| BRK.A / Berkshire Hathaway Inc. | 0.00 | 0.00 | 0.73 | -8.77 | 0.4680 | -0.0716 | |||
| FLS / Flowserve Corporation | 0.01 | -7.01 | 0.72 | -0.28 | 0.4594 | -0.0256 | |||
| EPD / Enterprise Products Partners L.P. - Limited Partnership | 0.02 | 0.00 | 0.70 | -9.22 | 0.4494 | -0.0713 | |||
| ETN / Eaton Corporation plc | 0.00 | -4.87 | 0.70 | 24.91 | 0.4482 | 0.0707 | |||
| ESGV / Vanguard World Fund - Vanguard ESG U.S. Stock ETF | 0.01 | 0.00 | 0.67 | 11.98 | 0.4325 | 0.0259 | |||
| APLE / Apple Hospitality REIT, Inc. | 0.06 | 10.96 | 0.67 | 0.30 | 0.4323 | -0.0212 | |||
| APD / Air Products and Chemicals, Inc. | 0.00 | 0.54 | 0.3443 | 0.3443 | |||||
| VYM / Vanguard Whitehall Funds - Vanguard High Dividend Yield ETF | 0.00 | 0.00 | 0.43 | 3.38 | 0.2752 | -0.0050 | |||
| NOC / Northrop Grumman Corporation | 0.00 | 0.00 | 0.42 | -2.55 | 0.2703 | -0.0210 | |||
| SCHV / Schwab Strategic Trust - Schwab U.S. Large-Cap Value ETF | 0.01 | 0.26 | 0.41 | 4.30 | 0.2652 | -0.0022 | |||
| SPY / SPDR S&P 500 ETF | 0.00 | 0.00 | 0.40 | 10.22 | 0.2569 | 0.0121 | |||
| SPYV / SPDR Series Trust - SPDR Portfolio S&P 500 Value ETF | 0.01 | -1.69 | 0.38 | 0.80 | 0.2445 | -0.0109 | |||
| VUG / Vanguard Index Funds - Vanguard Growth ETF | 0.00 | 0.00 | 0.33 | 18.02 | 0.2151 | 0.0236 | |||
| XOM / Exxon Mobil Corporation | 0.00 | 0.00 | 0.32 | -9.48 | 0.2029 | -0.0327 | |||
| SCHA / Schwab Strategic Trust - Schwab U.S. Small-Cap ETF | 0.01 | 0.00 | 0.32 | 7.88 | 0.2025 | 0.0052 | |||
| ABT / Abbott Laboratories | 0.00 | -3.52 | 0.31 | -0.95 | 0.2011 | -0.0128 | |||
| GILD / Gilead Sciences, Inc. | 0.00 | 0.00 | 0.31 | -0.97 | 0.1965 | -0.0125 | |||
| TCHP / T. Rowe Price Exchange-Traded Funds, Inc. - T. Rowe Price Blue Chip Growth ETF | 0.01 | 7.33 | 0.28 | 27.85 | 0.1804 | 0.0318 | |||
| BSV / Vanguard Bond Index Funds - Vanguard Short-Term Bond ETF | 0.00 | 0.00 | 0.28 | 0.72 | 0.1786 | -0.0083 | |||
| KO / The Coca-Cola Company | 0.00 | -4.78 | 0.25 | -6.02 | 0.1609 | -0.0191 | |||
| RSP / Invesco Exchange-Traded Fund Trust - Invesco S&P 500 Equal Weight ETF | 0.00 | 0.00 | 0.24 | 4.85 | 0.1534 | -0.0005 | |||
| COST / Costco Wholesale Corporation | 0.00 | -31.62 | 0.24 | -28.40 | 0.1526 | -0.0718 | |||
| HON / Honeywell International Inc. | 0.00 | 0.00 | 0.23 | 10.00 | 0.1488 | 0.0064 | |||
| SHEL / Shell plc - Depositary Receipt (Common Stock) | 0.00 | 0.00 | 0.21 | -3.65 | 0.1356 | -0.0129 | |||
| ALL / The Allstate Corporation | 0.00 | 0.00 | 0.21 | -2.80 | 0.1342 | -0.0111 | |||
| SKX / Skechers U.S.A., Inc. | 0.00 | -100.00 | 0.00 | 0.0000 | |||||
| IBM / International Business Machines Corporation | 0.00 | -100.00 | 0.00 | 0.0000 | |||||
| PEP / PepsiCo, Inc. | 0.00 | -100.00 | 0.00 | 0.0000 | |||||
| GJR / Strats Trust For Procter & Gambel Security - Preferred Security | 0.00 | -100.00 | 0.00 | 0.0000 | |||||
| PLUS / ePlus inc. | 0.00 | -100.00 | 0.00 | 0.0000 | |||||
| MCK / McKesson Corporation | 0.00 | -100.00 | 0.00 | 0.0000 | |||||
| QUAL / iShares Trust - iShares MSCI USA Quality Factor ETF | 0.00 | -100.00 | 0.00 | 0.0000 | |||||
| VSH / Vishay Intertechnology, Inc. | 0.00 | -100.00 | 0.00 | 0.0000 |