Mga Batayang Estadistika
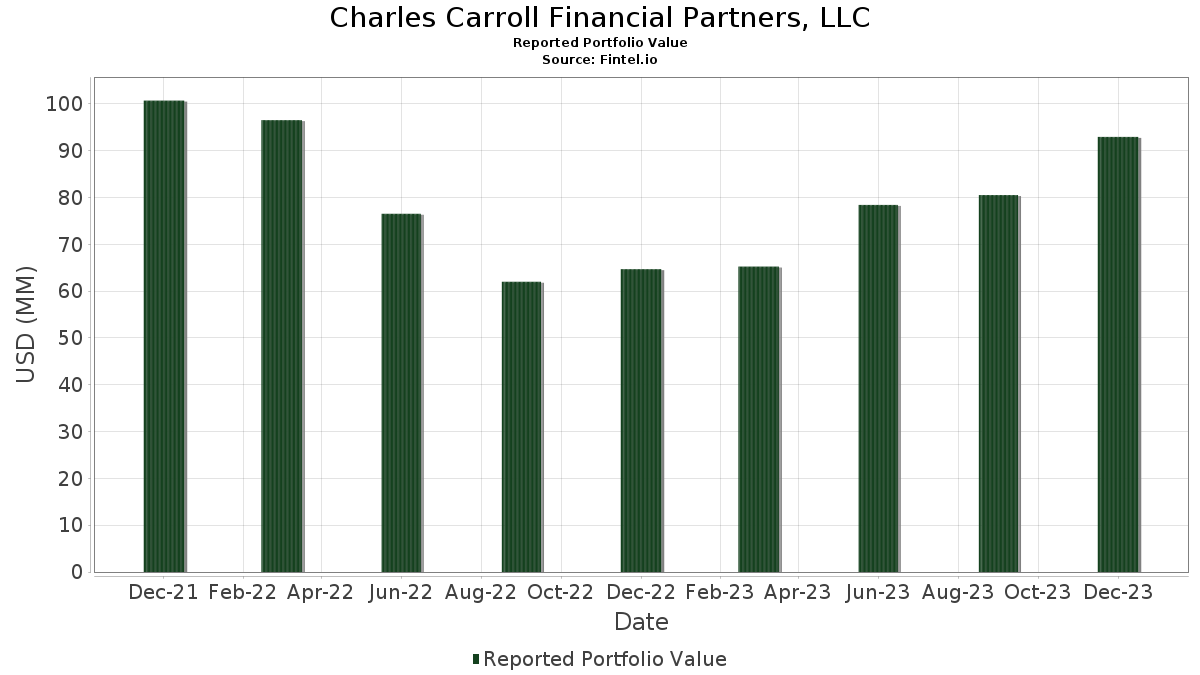
| Nilai Portofolio | $ 92,952,434 |
| Posisi Saat Ini | 38 |
Kepemilikan Terbaru, Kinerja, AUM (dari 13F, 13D)
Charles Carroll Financial Partners, LLC telah mengungkapkan total kepemilikan 38 dalam pengajuan SEC terbaru mereka. Nilai portofolio terbaru dihitung sebesar $ 92,952,434 USD. Aset yang Dikelola (AUM) sebenarnya adalah nilai ini ditambah kas (yang tidak diungkapkan). Aset-aset utama Charles Carroll Financial Partners, LLC adalah Apple Inc. (US:AAPL) , United Rentals, Inc. (US:URI) , Alphabet Inc. (US:GOOGL) , Microsoft Corporation (US:MSFT) , and Citigroup, Inc. (US:C.WSA) . Posisi baru Charles Carroll Financial Partners, LLC meliputi: iShares Trust - iShares Russell 2000 ETF (US:IWM) , .
Peningkatan Tertinggi Kuartal Ini
Kami menggunakan perubahan dalam alokasi portofolio karena ini adalah metrik yang paling bermakna. Perubahan dapat disebabkan oleh perdagangan atau perubahan harga saham.
| Keamanan | Saham (MM) |
Nilai (Juta Dolar AS) |
Portfolio % | ΔPorsyento ng Portfolio |
|---|---|---|---|---|
| 0.01 | 2.15 | 2.3087 | 1.2860 | |
| 0.01 | 2.00 | 2.1515 | 1.2072 | |
| 0.01 | 7.97 | 8.5749 | 1.0915 | |
| 0.01 | 1.99 | 2.1421 | 0.8311 | |
| 0.00 | 0.69 | 0.7396 | 0.7396 | |
| 0.02 | 6.74 | 7.2457 | 0.5955 | |
| 0.01 | 6.70 | 7.2095 | 0.5823 | |
| 0.01 | 1.61 | 1.7360 | 0.5659 | |
| 0.03 | 5.94 | 6.3876 | 0.4617 | |
| 0.01 | 2.95 | 3.1701 | 0.4580 |
Penurunan Tertinggi Kuartal Ini
Kami menggunakan perubahan dalam alokasi portofolio karena ini adalah metrik yang paling bermakna. Perubahan dapat disebabkan oleh perdagangan atau perubahan harga saham.
| Keamanan | Saham (MM) |
Nilai (Juta Dolar AS) |
Portfolio % | ΔPorsyento ng Portfolio |
|---|---|---|---|---|
| 0.01 | 1.27 | 1.3708 | -2.4385 | |
| 0.00 | 0.00 | -1.8409 | ||
| 0.05 | 9.98 | 10.7355 | -0.8978 | |
| 0.00 | 0.51 | 0.5456 | -0.8783 | |
| 0.00 | 0.00 | -0.8190 | ||
| 0.05 | 7.08 | 7.6145 | -0.5385 | |
| 0.00 | 0.41 | 0.4395 | -0.4076 | |
| 0.00 | 0.38 | 0.4117 | -0.3667 | |
| 0.00 | 0.00 | -0.2815 | ||
| 0.01 | 0.68 | 0.7276 | -0.2717 |
Pengajuan 13F dan Dana
Formulir ini diajukan pada 2024-02-06 untuk periode pelaporan 2023-12-31. Klik ikon tautan untuk melihat riwayat transaksi selengkapnya.
Tingkatkan ke versi premium untuk membuka data premium dan ekspor ke Excel. ![]() .
.
| Keamanan | Ketik | Harga Saham Rata-rata | Saham (MM) |
ΔSaham (%) |
ΔSaham (%) |
Nilai ($MM) |
Portpolyo (%) |
ΔPortofolio (%) |
|
|---|---|---|---|---|---|---|---|---|---|
| AAPL / Apple Inc. | 0.05 | -5.27 | 9.98 | 6.51 | 10.7355 | -0.8978 | |||
| URI / United Rentals, Inc. | 0.01 | 2.55 | 7.97 | 32.26 | 8.5749 | 1.0915 | |||
| GOOGL / Alphabet Inc. | 0.05 | 0.85 | 7.08 | 7.80 | 7.6145 | -0.5385 | |||
| MSFT / Microsoft Corporation | 0.02 | 5.60 | 6.74 | 25.77 | 7.2457 | 0.5955 | |||
| C.WSA / Citigroup, Inc. | 0.01 | 0.00 | 6.70 | 25.58 | 7.2095 | 0.5823 | |||
| JPM / JPMorgan Chase & Co. | 0.03 | 6.08 | 5.94 | 24.44 | 6.3876 | 0.4617 | |||
| INTU / Intuit Inc. | 0.01 | -0.30 | 5.19 | 21.96 | 5.5857 | 0.2983 | |||
| V / Visa Inc. | 0.02 | 2.24 | 4.75 | 15.74 | 5.1115 | 0.0132 | |||
| ADBE / Adobe Inc. | 0.01 | 0.00 | 3.87 | 16.98 | 4.1591 | 0.0558 | |||
| UNH / UnitedHealth Group Incorporated | 0.01 | 4.58 | 3.00 | 9.20 | 3.2317 | -0.1842 | |||
| META / Meta Platforms, Inc. | 0.01 | 14.43 | 2.95 | 34.89 | 3.1701 | 0.4580 | |||
| BA / The Boeing Company | 0.01 | -4.01 | 2.65 | 30.58 | 2.8533 | 0.3302 | |||
| NFLX / Netflix, Inc. | 0.00 | -10.80 | 2.23 | 14.99 | 2.4021 | -0.0085 | |||
| CRWD / CrowdStrike Holdings, Inc. | 0.01 | 70.83 | 2.15 | 160.63 | 2.3087 | 1.2860 | |||
| CRM / Salesforce, Inc. | 0.01 | 102.67 | 2.00 | 163.03 | 2.1515 | 1.2072 | |||
| AMG / Affiliated Managers Group, Inc. | 0.01 | 62.35 | 1.99 | 88.72 | 2.1421 | 0.8311 | |||
| AMZN / Amazon.com, Inc. | 0.01 | 5.73 | 1.82 | 26.37 | 1.9599 | 0.1698 | |||
| BRK.B / Berkshire Hathaway Inc. | 0.01 | 2.04 | 1.78 | 3.90 | 1.9185 | -0.2130 | |||
| ICE / Intercontinental Exchange, Inc. | 0.01 | 46.70 | 1.61 | 71.23 | 1.7360 | 0.5659 | |||
| BAC / Bank of America Corporation | 0.05 | -15.61 | 1.52 | 3.76 | 1.6351 | -0.1836 | |||
| AMD / Advanced Micro Devices, Inc. | 0.01 | 2.68 | 1.41 | 47.29 | 1.5186 | 0.3279 | |||
| SYK / Stryker Corporation | 0.00 | 20.16 | 1.36 | 31.65 | 1.4593 | 0.1801 | |||
| RSP / Invesco Exchange-Traded Fund Trust - Invesco S&P 500 Equal Weight ETF | 0.01 | -62.70 | 1.27 | -58.46 | 1.3708 | -2.4385 | |||
| GD / General Dynamics Corporation | 0.00 | 0.00 | 0.79 | 17.51 | 0.8452 | 0.0150 | |||
| SONY / Sony Group Corporation - Depositary Receipt (Common Stock) | 0.01 | 0.00 | 0.71 | 14.89 | 0.7640 | -0.0035 | |||
| IWM / iShares Trust - iShares Russell 2000 ETF | 0.00 | 0.69 | 0.7396 | 0.7396 | |||||
| MS / Morgan Stanley | 0.01 | -26.39 | 0.68 | -15.92 | 0.7276 | -0.2717 | |||
| NOW / ServiceNow, Inc. | 0.00 | 0.00 | 0.57 | 26.55 | 0.6156 | 0.0534 | |||
| GLP / Global Partners LP - Limited Partnership | 0.01 | 0.00 | 0.57 | 19.87 | 0.6100 | 0.0222 | |||
| CVX / Chevron Corporation | 0.00 | -50.00 | 0.51 | -55.76 | 0.5456 | -0.8783 | |||
| MDLZ / Mondelez International, Inc. | 0.01 | 0.00 | 0.47 | 4.42 | 0.5078 | -0.0538 | |||
| LBRDA / Liberty Broadband Corporation | 0.00 | -32.24 | 0.41 | -40.18 | 0.4395 | -0.4076 | |||
| PNC / The PNC Financial Services Group, Inc. | 0.00 | 0.00 | 0.40 | 26.20 | 0.4255 | 0.0361 | |||
| ZBRA / Zebra Technologies Corporation | 0.00 | -47.17 | 0.38 | -38.98 | 0.4117 | -0.3667 | |||
| HD / The Home Depot, Inc. | 0.00 | 0.00 | 0.29 | 14.84 | 0.3169 | -0.0020 | |||
| CVS / CVS Health Corporation | 0.00 | -38.07 | 0.22 | -29.90 | 0.2349 | -0.1523 | |||
| SYY / Sysco Corporation | 0.00 | 0.20 | 0.2165 | 0.2165 | |||||
| BRKL / Brookline Bancorp, Inc. | 0.01 | 0.00 | 0.11 | 19.78 | 0.1178 | 0.0042 | |||
| MRK / Merck & Co., Inc. | 0.00 | -100.00 | 0.00 | -100.00 | -0.8190 | ||||
| JNJ / Johnson & Johnson | 0.00 | -100.00 | 0.00 | -100.00 | -0.2815 | ||||
| EMXC / iShares, Inc. - iShares MSCI Emerging Markets ex China ETF | 0.00 | -100.00 | 0.00 | -100.00 | -1.8409 |