Mga Batayang Estadistika
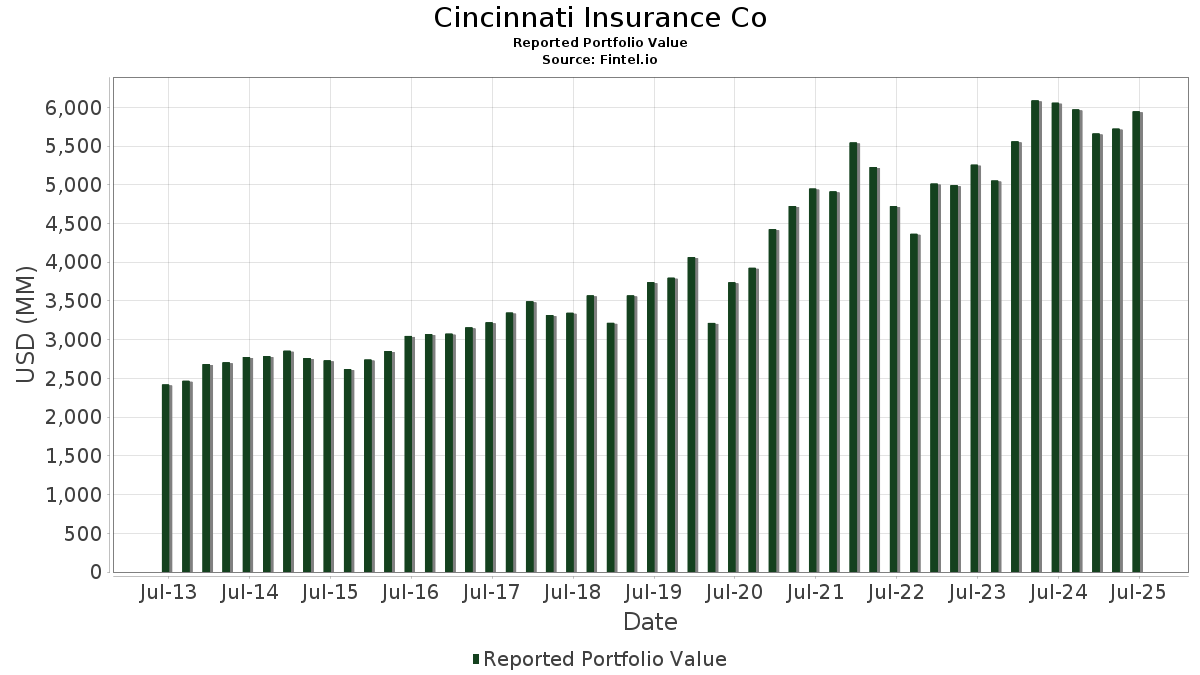
| Nilai Portofolio | $ 5,946,220,677 |
| Posisi Saat Ini | 60 |
Kepemilikan Terbaru, Kinerja, AUM (dari 13F, 13D)
Cincinnati Insurance Co telah mengungkapkan total kepemilikan 60 dalam pengajuan SEC terbaru mereka. Nilai portofolio terbaru dihitung sebesar $ 5,946,220,677 USD. Aset yang Dikelola (AUM) sebenarnya adalah nilai ini ditambah kas (yang tidak diungkapkan). Aset-aset utama Cincinnati Insurance Co adalah Microsoft Corporation (US:MSFT) , JPMorgan Chase & Co. (US:JPM) , AbbVie Inc. (US:ABBV) , Cummins Inc. (US:CMI) , and Accenture plc (US:ACN) .
Peningkatan Tertinggi Kuartal Ini
Kami menggunakan perubahan dalam alokasi portofolio karena ini adalah metrik yang paling bermakna. Perubahan dapat disebabkan oleh perdagangan atau perubahan harga saham.
| Keamanan | Saham (MM) |
Nilai (Juta Dolar AS) |
Portfolio % | ΔPorsyento ng Portfolio |
|---|---|---|---|---|
| 1.18 | 588.93 | 9.9043 | 2.1380 | |
| 1.51 | 438.40 | 7.3727 | 0.8911 | |
| 0.34 | 94.41 | 1.5877 | 0.5857 | |
| 0.56 | 134.39 | 2.2601 | 0.2704 | |
| 0.51 | 35.83 | 0.6025 | 0.2205 | |
| 1.05 | 77.29 | 1.2998 | 0.1749 | |
| 1.12 | 163.82 | 2.7551 | 0.1583 | |
| 0.39 | 44.22 | 0.7436 | 0.1496 | |
| 0.12 | 121.50 | 2.0434 | 0.1282 | |
| 1.33 | 92.55 | 1.5565 | 0.1181 |
Penurunan Tertinggi Kuartal Ini
Kami menggunakan perubahan dalam alokasi portofolio karena ini adalah metrik yang paling bermakna. Perubahan dapat disebabkan oleh perdagangan atau perubahan harga saham.
| Keamanan | Saham (MM) |
Nilai (Juta Dolar AS) |
Portfolio % | ΔPorsyento ng Portfolio |
|---|---|---|---|---|
| 0.22 | 68.66 | 1.1547 | -0.8595 | |
| 1.41 | 260.83 | 4.3865 | -0.7580 | |
| 1.24 | 163.80 | 2.7546 | -0.4955 | |
| 1.07 | 162.83 | 2.7384 | -0.3507 | |
| 0.64 | 91.06 | 1.5314 | -0.3276 | |
| 1.17 | 126.36 | 2.1251 | -0.3109 | |
| 1.03 | 163.70 | 2.7530 | -0.3067 | |
| 0.62 | 184.05 | 3.0952 | -0.2623 | |
| 0.39 | 113.65 | 1.9114 | -0.2119 | |
| 0.79 | 45.46 | 0.7645 | -0.2020 |
Pengajuan 13F dan Dana
Formulir ini diajukan pada 2025-08-07 untuk periode pelaporan 2025-06-30. Klik ikon tautan untuk melihat riwayat transaksi selengkapnya.
Tingkatkan ke versi premium untuk membuka data premium dan ekspor ke Excel. ![]() .
.
| Keamanan | Ketik | Harga Saham Rata-rata | Saham (MM) |
ΔSaham (%) |
ΔSaham (%) |
Nilai ($MM) |
Portpolyo (%) |
ΔPortofolio (%) |
|
|---|---|---|---|---|---|---|---|---|---|
| MSFT / Microsoft Corporation | 1.18 | 0.00 | 588.93 | 32.50 | 9.9043 | 2.1380 | |||
| JPM / JPMorgan Chase & Co. | 1.51 | 0.00 | 438.40 | 18.19 | 7.3727 | 0.8911 | |||
| ABBV / AbbVie Inc. | 1.41 | 0.00 | 260.83 | -11.41 | 4.3865 | -0.7580 | |||
| LAM RESEARCH ORD / (US5128073) | 2.49 | 242.58 | 0.0000 | ||||||
| CMI / Cummins Inc. | 0.61 | 0.00 | 198.60 | 4.49 | 3.3399 | 0.0187 | |||
| ACN / Accenture plc | 0.62 | 0.00 | 184.05 | -4.21 | 3.0952 | -0.2623 | |||
| RTX / RTX Corporation | 1.12 | 0.00 | 163.82 | 10.24 | 2.7551 | 0.1583 | |||
| PEP / PepsiCo, Inc. | 1.24 | 0.00 | 163.80 | -11.94 | 2.7546 | -0.4955 | |||
| PG / The Procter & Gamble Company | 1.03 | 0.00 | 163.70 | -6.51 | 2.7530 | -0.3067 | |||
| JNJ / Johnson & Johnson | 1.07 | 0.00 | 162.83 | -7.89 | 2.7384 | -0.3507 | |||
| ABT / Abbott Laboratories | 1.16 | 0.00 | 157.39 | 2.53 | 2.6469 | -0.0353 | |||
| ADI / Analog Devices, Inc. | 0.56 | 0.00 | 134.39 | 18.02 | 2.2601 | 0.2704 | |||
| APD / Air Products and Chemicals, Inc. | 0.47 | 0.00 | 132.35 | -4.36 | 2.2258 | -0.1923 | |||
| XOM / Exxon Mobil Corporation | 1.17 | 0.00 | 126.36 | -9.36 | 2.1251 | -0.3109 | |||
| BLK / BlackRock, Inc. | 0.12 | 0.00 | 121.50 | 10.86 | 2.0434 | 0.1282 | |||
| TJX / The TJX Companies, Inc. | 0.96 | 0.00 | 118.92 | 1.39 | 1.9999 | -0.0496 | |||
| CB / Chubb Limited | 0.39 | 0.00 | 114.07 | -4.06 | 1.9184 | -0.1593 | |||
| MCD / McDonald's Corporation | 0.39 | 0.00 | 113.65 | -6.47 | 1.9114 | -0.2119 | |||
| RPM / RPM International Inc. | 1.03 | 0.00 | 113.50 | -5.05 | 1.9087 | -0.1799 | |||
| WEC / WEC Energy Group, Inc. | 0.98 | 0.00 | 101.94 | -4.39 | 1.7143 | -0.1486 | |||
| USB / U.S. Bancorp | 2.20 | 0.00 | 99.53 | 7.18 | 1.6738 | 0.0511 | |||
| AVGO / Broadcom Inc. | 0.34 | 0.00 | 94.41 | 64.64 | 1.5877 | 0.5857 | |||
| DUK / Duke Energy Corporation | 0.79 | 0.00 | 93.79 | -3.25 | 1.5773 | -0.1167 | |||
| CSCO / Cisco Systems, Inc. | 1.33 | 0.00 | 92.55 | 12.43 | 1.5565 | 0.1181 | |||
| CVX / Chevron Corporation | 0.64 | 0.00 | 91.06 | -14.41 | 1.5314 | -0.3276 | |||
| AAPL / Apple Inc. | 0.42 | 0.00 | 86.17 | -7.64 | 1.4492 | -0.1810 | |||
| PFE / Pfizer Inc. | 3.48 | 0.00 | 84.40 | -4.34 | 1.4193 | -0.1223 | |||
| RF / Regions Financial Corporation | 3.55 | 0.00 | 83.40 | 8.24 | 1.4026 | 0.0562 | |||
| HD / The Home Depot, Inc. | 0.23 | 0.00 | 83.02 | 0.04 | 1.3963 | -0.0539 | |||
| MMM / 3M Company | 0.52 | 0.00 | 79.42 | 3.66 | 1.3357 | -0.0031 | |||
| MDLZ / Mondelez International, Inc. | 1.16 | 0.00 | 78.20 | -0.61 | 1.3151 | -0.0596 | |||
| HAS / Hasbro, Inc. | 1.05 | 0.00 | 77.29 | 20.05 | 1.2998 | 0.1749 | |||
| ENB / Enbridge Inc. | 1.65 | 0.00 | 74.64 | 2.28 | 1.2553 | -0.0199 | |||
| UNH / UnitedHealth Group Incorporated | 0.22 | 0.00 | 68.66 | -40.44 | 1.1547 | -0.8595 | |||
| QCOM / QUALCOMM Incorporated | 0.43 | 0.00 | 68.08 | 3.68 | 1.1450 | -0.0025 | |||
| NSC / Norfolk Southern Corporation | 0.26 | 0.00 | 67.68 | 8.07 | 1.1382 | 0.0439 | |||
| DOV / Dover Corporation | 0.37 | 0.00 | 67.57 | 4.30 | 1.1364 | 0.0043 | |||
| ADC / Agree Realty Corporation | 0.79 | 0.00 | 57.68 | -5.35 | 0.9700 | -0.0948 | |||
| HON / Honeywell International Inc. | 0.24 | 0.00 | 57.06 | 9.98 | 0.9595 | 0.0530 | |||
| WAL / Western Alliance Bancorporation | 0.72 | 0.00 | 56.54 | 1.50 | 0.9508 | -0.0225 | |||
| ADP / Automatic Data Processing, Inc. | 0.18 | 0.00 | 55.84 | 0.94 | 0.9390 | -0.0276 | |||
| VLO / Valero Energy Corporation | 0.36 | 0.00 | 47.93 | 1.78 | 0.8060 | -0.0168 | |||
| LYB / LyondellBasell Industries N.V. | 0.79 | 0.00 | 45.46 | -17.81 | 0.7645 | -0.2020 | |||
| DG / Dollar General Corporation | 0.39 | 0.00 | 44.22 | 30.08 | 0.7436 | 0.1496 | |||
| PM / Philip Morris International Inc. | 0.24 | 0.00 | 44.15 | 14.74 | 0.7426 | 0.0702 | |||
| SNA / Snap-on Incorporated | 0.12 | 0.00 | 38.56 | -7.66 | 0.6484 | -0.0812 | |||
| CMCSA / Comcast Corporation | 1.04 | 0.00 | 37.03 | -3.28 | 0.6227 | -0.0462 | |||
| MCHP / Microchip Technology Incorporated | 0.51 | 12.73 | 35.83 | 63.88 | 0.6025 | 0.2205 | |||
| MA / Mastercard Incorporated | 0.06 | 0.00 | 34.28 | 2.52 | 0.5765 | -0.0078 | |||
| NEE / NextEra Energy, Inc. | 0.49 | 0.00 | 34.09 | -2.07 | 0.5732 | -0.0350 | |||
| OC / Owens Corning | 0.21 | 0.00 | 29.15 | -3.71 | 0.4903 | -0.0388 | |||
| NSA / National Storage Affiliates Trust | 0.89 | 0.00 | 28.59 | -18.81 | 0.4808 | -0.1345 | |||
| PNW / Pinnacle West Capital Corporation | 0.30 | 0.00 | 26.56 | -6.07 | 0.4466 | -0.0474 | |||
| T / AT&T Inc. | 0.80 | 0.00 | 23.24 | 2.33 | 0.3908 | -0.0060 | |||
| PLD / Prologis, Inc. | 0.17 | 0.00 | 17.66 | -5.96 | 0.2970 | -0.0312 | |||
| VZ / Verizon Communications Inc. | 0.41 | 0.00 | 17.54 | -4.61 | 0.2949 | -0.0263 | |||
| AMT / American Tower Corporation | 0.06 | 0.00 | 13.26 | 1.57 | 0.2230 | -0.0051 | |||
| CME / CME Group Inc. | 0.03 | 0.00 | 8.24 | 3.90 | 0.1386 | -0.0000 | |||
| KINGSTONE COMPANIES, INC / WARRANT (9941426E2) | 0.09 | 1.26 | 0.0000 | ||||||
| HL ACQUISITION, INC., DBA HOSTA / (9941487P3) | 0.02 | 0.59 | 0.0000 | ||||||
| TOI / The Oncology Institute, Inc. | 0.00 | -100.00 | 0.00 | 0.0000 |