Mga Batayang Estadistika
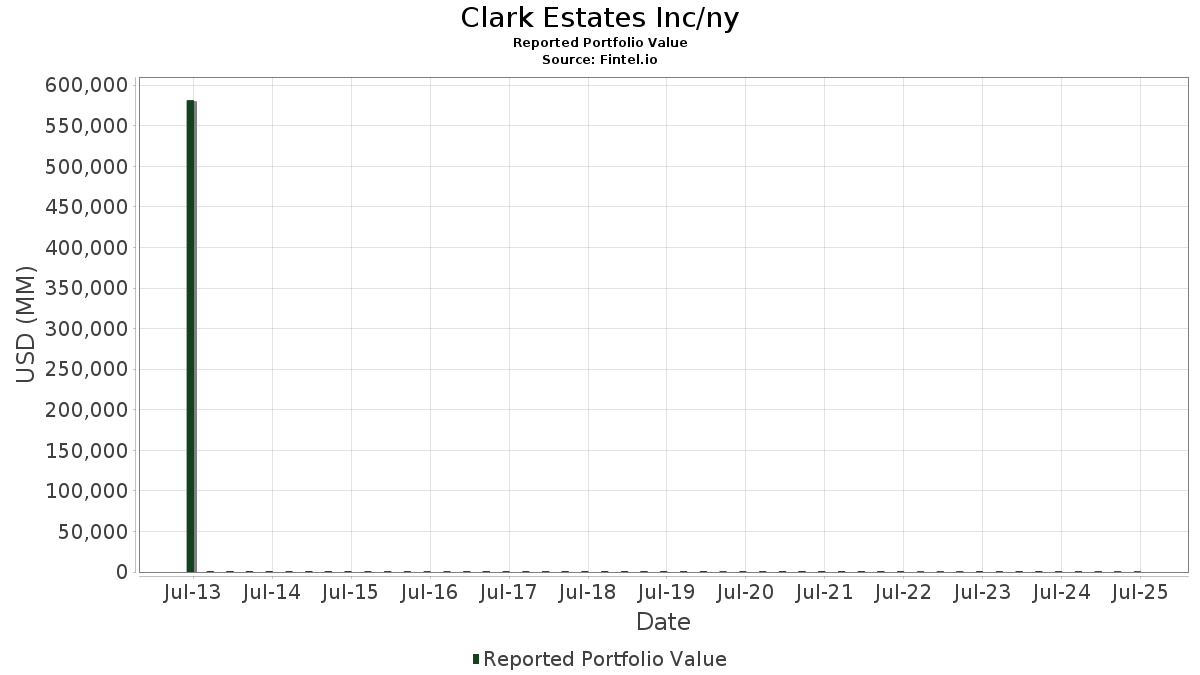
| Nilai Portofolio | $ 445,694,967 |
| Posisi Saat Ini | 97 |
Kepemilikan Terbaru, Kinerja, AUM (dari 13F, 13D)
Clark Estates Inc/ny telah mengungkapkan total kepemilikan 97 dalam pengajuan SEC terbaru mereka. Nilai portofolio terbaru dihitung sebesar $ 445,694,967 USD. Aset yang Dikelola (AUM) sebenarnya adalah nilai ini ditambah kas (yang tidak diungkapkan). Aset-aset utama Clark Estates Inc/ny adalah EA Series Trust - Euclidean Fundamental Value ETF (US:ECML) , IQVIA Holdings Inc. (US:IQV) , Baxter International Inc. (US:BAX) , Medtronic plc (US:MDT) , and Smith & Nephew plc - Depositary Receipt (Common Stock) (US:SNN) . Posisi baru Clark Estates Inc/ny meliputi: Gibraltar Industries, Inc. (US:ROCK) , Yelp Inc. (AT:YELP) , Minerals Technologies Inc. (US:MTX) , iShares Trust - iShares MSCI EAFE ETF (US:EFA) , and .
Peningkatan Tertinggi Kuartal Ini
Kami menggunakan perubahan dalam alokasi portofolio karena ini adalah metrik yang paling bermakna. Perubahan dapat disebabkan oleh perdagangan atau perubahan harga saham.
| Keamanan | Saham (MM) |
Nilai (Juta Dolar AS) |
Portfolio % | ΔPorsyento ng Portfolio |
|---|---|---|---|---|
| 0.12 | 15.50 | 3.4780 | 3.4698 | |
| 0.16 | 24.46 | 5.4876 | 1.9339 | |
| 0.07 | 12.12 | 2.7194 | 1.5365 | |
| 0.13 | 6.13 | 1.3753 | 1.3753 | |
| 3.09 | 95.04 | 21.3247 | 0.8772 | |
| 0.85 | 11.06 | 2.4812 | 0.5716 | |
| 0.02 | 2.26 | 0.5061 | 0.5061 | |
| 0.04 | 2.06 | 0.4633 | 0.4633 | |
| 0.09 | 2.06 | 0.4627 | 0.4627 | |
| 0.01 | 1.92 | 0.4315 | 0.4315 |
Penurunan Tertinggi Kuartal Ini
Kami menggunakan perubahan dalam alokasi portofolio karena ini adalah metrik yang paling bermakna. Perubahan dapat disebabkan oleh perdagangan atau perubahan harga saham.
| Keamanan | Saham (MM) |
Nilai (Juta Dolar AS) |
Portfolio % | ΔPorsyento ng Portfolio |
|---|---|---|---|---|
| 0.00 | 0.26 | 0.0573 | -1.2988 | |
| 0.40 | 10.41 | 2.3361 | -0.8894 | |
| 0.14 | 14.62 | 3.2807 | -0.8240 | |
| 0.18 | 11.01 | 2.4704 | -0.4926 | |
| 0.68 | 20.68 | 4.6389 | -0.4669 | |
| 0.03 | 0.97 | 0.2178 | -0.1696 | |
| 1.80 | 18.67 | 4.1881 | -0.1694 | |
| 1.42 | 2.18 | 0.4902 | -0.1466 | |
| 0.49 | 6.05 | 1.3563 | -0.1422 | |
| 0.11 | 2.47 | 0.5546 | -0.1355 |
Pengajuan 13F dan Dana
Formulir ini diajukan pada 2025-08-11 untuk periode pelaporan 2025-06-30. Klik ikon tautan untuk melihat riwayat transaksi selengkapnya.
Tingkatkan ke versi premium untuk membuka data premium dan ekspor ke Excel. ![]() .
.
| Keamanan | Ketik | Harga Saham Rata-rata | Saham (MM) |
ΔSaham (%) |
ΔSaham (%) |
Nilai ($MM) |
Portpolyo (%) |
ΔPortofolio (%) |
|
|---|---|---|---|---|---|---|---|---|---|
| ECML / EA Series Trust - Euclidean Fundamental Value ETF | 3.09 | -2.10 | 95.04 | -1.58 | 21.3247 | 0.8772 | |||
| IQV / IQVIA Holdings Inc. | 0.16 | 63.03 | 24.46 | 45.72 | 5.4876 | 1.9339 | |||
| BAX / Baxter International Inc. | 0.81 | 7.33 | 24.38 | -5.05 | 5.4691 | 0.0334 | |||
| MDT / Medtronic plc | 0.25 | 0.00 | 21.79 | -3.00 | 4.8896 | 0.1330 | |||
| SNN / Smith & Nephew plc - Depositary Receipt (Common Stock) | 0.68 | -20.59 | 20.68 | -14.26 | 4.6389 | -0.4669 | |||
| KVUE / Kenvue Inc. | 0.90 | 5.88 | 18.84 | -7.58 | 4.2264 | -0.0893 | |||
| HLN / Haleon plc - Depositary Receipt (Common Stock) | 1.80 | -10.00 | 18.67 | -9.30 | 4.1881 | -0.1694 | |||
| DIS / The Walt Disney Company | 0.12 | 16,566.67 | 15.50 | -67.27 | 3.4780 | 3.4698 | |||
| DEO / Diageo plc - Depositary Receipt (Common Stock) | 0.14 | -21.62 | 14.62 | -24.58 | 3.2807 | -0.8240 | |||
| FI / Fiserv, Inc. | 0.07 | 177.87 | 12.12 | 116.97 | 2.7194 | 1.5365 | |||
| BLCO / Bausch + Lomb Corporation | 0.85 | 36.66 | 11.06 | 22.61 | 2.4812 | 0.5716 | |||
| UL / Unilever PLC - Depositary Receipt (Common Stock) | 0.18 | -23.40 | 11.01 | -21.32 | 2.4704 | -0.4926 | |||
| SONY / Sony Group Corporation - Depositary Receipt (Common Stock) | 0.40 | -33.33 | 10.41 | -31.65 | 2.3361 | -0.8894 | |||
| PRKS / United Parks & Resorts Inc. | 0.13 | 6.13 | 1.3753 | 1.3753 | |||||
| AVNS / Avanos Medical, Inc. | 0.49 | 0.00 | 6.05 | -14.58 | 1.3563 | -0.1422 | |||
| HSII / Heidrick & Struggles International, Inc. | 0.07 | 0.00 | 3.08 | 6.83 | 0.6919 | 0.0808 | |||
| INDV / Indivior PLC | 0.20 | 9.30 | 3.00 | 69.07 | 0.6733 | 0.2975 | |||
| GILD / Gilead Sciences, Inc. | 0.03 | 0.00 | 2.89 | -1.03 | 0.6473 | 0.0300 | |||
| MO / Altria Group, Inc. | 0.05 | 0.00 | 2.85 | -2.30 | 0.6395 | 0.0217 | |||
| NXT / Nextracker Inc. | 0.05 | -15.01 | 2.71 | 9.64 | 0.6077 | 0.0847 | |||
| WLY / John Wiley & Sons, Inc. | 0.06 | 0.00 | 2.56 | 0.16 | 0.5733 | 0.0331 | |||
| CPRX / Catalyst Pharmaceuticals, Inc. | 0.11 | -15.25 | 2.47 | -24.15 | 0.5546 | -0.1355 | |||
| MD / Pediatrix Medical Group, Inc. | 0.17 | -16.27 | 2.46 | -17.07 | 0.5516 | -0.0762 | |||
| REZI / Resideo Technologies, Inc. | 0.11 | 0.00 | 2.41 | 24.60 | 0.5400 | 0.1311 | |||
| INCY / Incyte Corporation | 0.03 | 0.00 | 2.38 | 12.48 | 0.5340 | 0.0860 | |||
| SNX / TD SYNNEX Corporation | 0.02 | 0.00 | 2.35 | 30.53 | 0.5267 | 0.1459 | |||
| HALO / Halozyme Therapeutics, Inc. | 0.04 | 0.00 | 2.33 | -18.48 | 0.5237 | -0.0825 | |||
| DELL / Dell Technologies Inc. | 0.02 | 2.26 | 0.5061 | 0.5061 | |||||
| VNT / Vontier Corporation | 0.06 | 0.00 | 2.24 | 12.29 | 0.5023 | 0.0803 | |||
| NTCT / NetScout Systems, Inc. | 0.09 | 0.00 | 2.21 | 18.04 | 0.4949 | 0.0994 | |||
| OSK / Oshkosh Corporation | 0.02 | 0.00 | 2.20 | 20.72 | 0.4941 | 0.1077 | |||
| DDD / 3D Systems Corporation | 1.42 | 0.00 | 2.18 | -27.37 | 0.4902 | -0.1466 | |||
| LEA / Lear Corporation | 0.02 | 0.00 | 2.18 | 7.66 | 0.4889 | 0.0604 | |||
| NXST / Nexstar Media Group, Inc. | 0.01 | 0.00 | 2.15 | -3.49 | 0.4834 | 0.0107 | |||
| ROCK / Gibraltar Industries, Inc. | 0.04 | 2.06 | 0.4633 | 0.4633 | |||||
| SHOO / Steven Madden, Ltd. | 0.09 | 2.06 | 0.4627 | 0.4627 | |||||
| SJM / The J. M. Smucker Company | 0.02 | 0.00 | 2.06 | -17.10 | 0.4624 | -0.0638 | |||
| BBWI / Bath & Body Works, Inc. | 0.07 | 0.00 | 2.03 | -1.17 | 0.4556 | 0.0205 | |||
| MTCH / Match Group, Inc. | 0.06 | 0.00 | 2.00 | -0.99 | 0.4491 | 0.0210 | |||
| PFE / Pfizer Inc. | 0.08 | 0.00 | 1.98 | -4.36 | 0.4435 | 0.0060 | |||
| WEX / WEX Inc. | 0.01 | 0.00 | 1.95 | -6.47 | 0.4383 | -0.0038 | |||
| TGNA / TEGNA Inc. | 0.12 | 0.00 | 1.95 | -7.97 | 0.4378 | -0.0113 | |||
| UPBD / Upbound Group, Inc. | 0.08 | 0.00 | 1.93 | 4.77 | 0.4336 | 0.0430 | |||
| CTSH / Cognizant Technology Solutions Corporation | 0.02 | 0.00 | 1.93 | 1.96 | 0.4328 | 0.0324 | |||
| EXPE / Expedia Group, Inc. | 0.01 | 1.92 | 0.4315 | 0.4315 | |||||
| BIIB / Biogen Inc. | 0.02 | 29.70 | 1.92 | 19.02 | 0.4311 | 0.0894 | |||
| CROX / Crocs, Inc. | 0.02 | 0.00 | 1.92 | -4.62 | 0.4308 | 0.0045 | |||
| PINC / Premier, Inc. | 0.09 | 0.00 | 1.91 | 13.80 | 0.4292 | 0.0731 | |||
| YELP / Yelp Inc. | 0.06 | 1.91 | 0.4275 | 0.4275 | |||||
| MMS / Maximus, Inc. | 0.03 | 0.00 | 1.91 | 2.97 | 0.4274 | 0.0356 | |||
| HRMY / Harmony Biosciences Holdings, Inc. | 0.06 | 0.00 | 1.90 | -4.77 | 0.4254 | 0.0038 | |||
| LEN / Lennar Corporation | 0.02 | 0.00 | 1.88 | -3.64 | 0.4219 | 0.0088 | |||
| MTX / Minerals Technologies Inc. | 0.03 | 1.88 | 0.4213 | 0.4213 | |||||
| PVH / PVH Corp. | 0.03 | 39.72 | 1.87 | 48.22 | 0.4202 | 0.1528 | |||
| YETI / YETI Holdings, Inc. | 0.06 | 0.00 | 1.87 | -4.80 | 0.4187 | 0.0038 | |||
| TDC / Teradata Corporation | 0.08 | 0.00 | 1.87 | -0.75 | 0.4185 | 0.0206 | |||
| TAP / Molson Coors Beverage Company | 0.04 | 0.00 | 1.86 | -21.00 | 0.4179 | -0.0813 | |||
| TRIP / Tripadvisor, Inc. | 0.14 | 0.00 | 1.82 | -7.88 | 0.4093 | -0.0101 | |||
| CARS / Cars.com Inc. | 0.15 | 1.81 | 0.4068 | 0.4068 | |||||
| OMC / Omnicom Group Inc. | 0.03 | 0.00 | 1.81 | -13.26 | 0.4068 | -0.0356 | |||
| BMY / Bristol-Myers Squibb Company | 0.04 | 12.34 | 1.80 | -14.72 | 0.4030 | -0.0430 | |||
| TFX / Teleflex Incorporated | 0.01 | 0.00 | 1.78 | -14.33 | 0.3983 | -0.0405 | |||
| AMWD / American Woodmark Corporation | 0.03 | 1.77 | 0.3976 | 0.3976 | |||||
| ZD / Ziff Davis, Inc. | 0.06 | 35.42 | 1.76 | 9.09 | 0.3960 | 0.0534 | |||
| UTHR / United Therapeutics Corporation | 0.01 | 1.75 | 0.3933 | 0.3933 | |||||
| ALSN / Allison Transmission Holdings, Inc. | 0.02 | 0.00 | 1.69 | -0.71 | 0.3783 | 0.0188 | |||
| CMCSA / Comcast Corporation | 0.04 | 0.00 | 1.57 | -3.27 | 0.3520 | 0.0086 | |||
| HPQ / HP Inc. | 0.06 | 0.00 | 1.55 | -11.69 | 0.3475 | -0.0237 | |||
| CNXC / Concentrix Corporation | 0.03 | 0.00 | 1.54 | -5.00 | 0.3456 | 0.0023 | |||
| VTRS / Viatris Inc. | 0.17 | 0.00 | 1.53 | 2.54 | 0.3438 | 0.0274 | |||
| KHC / The Kraft Heinz Company | 0.06 | 0.00 | 1.53 | -15.18 | 0.3425 | -0.0384 | |||
| SWKS / Skyworks Solutions, Inc. | 0.02 | 0.00 | 1.51 | 15.33 | 0.3377 | 0.0613 | |||
| BWA / BorgWarner Inc. | 0.04 | 0.00 | 1.44 | 16.90 | 0.3230 | 0.0622 | |||
| WU / The Western Union Company | 0.15 | 0.00 | 1.29 | -20.40 | 0.2891 | -0.0537 | |||
| HAL / Halliburton Company | 0.06 | 0.00 | 1.25 | -19.64 | 0.2809 | -0.0491 | |||
| DXC / DXC Technology Company | 0.08 | 0.00 | 1.23 | -10.33 | 0.2768 | -0.0145 | |||
| MAN / ManpowerGroup Inc. | 0.03 | 0.00 | 1.18 | -30.19 | 0.2657 | -0.0935 | |||
| STTK / Shattuck Labs, Inc. | 1.48 | 0.00 | 1.17 | -16.69 | 0.2622 | -0.0347 | |||
| XPOF / Xponential Fitness, Inc. | 0.14 | 0.00 | 1.08 | -10.04 | 0.2432 | -0.0120 | |||
| EMBC / Embecta Corp. | 0.11 | 0.00 | 1.02 | -24.01 | 0.2287 | -0.0553 | |||
| HELE / Helen of Troy Limited | 0.03 | 0.00 | 0.97 | -46.97 | 0.2178 | -0.1696 | |||
| DH / Definitive Healthcare Corp. | 0.24 | 0.00 | 0.93 | 34.97 | 0.2097 | 0.0631 | |||
| PG / The Procter & Gamble Company | 0.01 | 0.00 | 0.92 | -6.44 | 0.2055 | -0.0019 | |||
| IBM / International Business Machines Corporation | 0.00 | 0.00 | 0.90 | 18.58 | 0.2021 | 0.0412 | |||
| SPY / SPDR S&P 500 ETF | 0.00 | 0.00 | 0.65 | 10.53 | 0.1461 | 0.0213 | |||
| AAPL / Apple Inc. | 0.00 | 0.00 | 0.64 | -7.67 | 0.1432 | -0.0031 | |||
| JNJ / Johnson & Johnson | 0.00 | 0.00 | 0.63 | -7.79 | 0.1407 | -0.0035 | |||
| AMZN / Amazon.com, Inc. | 0.00 | 0.00 | 0.54 | 15.30 | 0.1201 | 0.0218 | |||
| MSFT / Microsoft Corporation | 0.00 | 0.00 | 0.42 | 32.50 | 0.0952 | 0.0274 | |||
| VB / Vanguard Index Funds - Vanguard Small-Cap ETF | 0.00 | 0.00 | 0.32 | 6.69 | 0.0718 | 0.0084 | |||
| CPNG / Coupang, Inc. | 0.01 | 0.00 | 0.28 | 36.95 | 0.0624 | 0.0193 | |||
| GOOGL / Alphabet Inc. | 0.00 | -96.50 | 0.26 | -96.02 | 0.0573 | -1.2988 | |||
| XOM / Exxon Mobil Corporation | 0.00 | 0.00 | 0.24 | -9.47 | 0.0538 | -0.0022 | |||
| CB / Chubb Limited | 0.00 | 0.00 | 0.23 | -4.15 | 0.0520 | 0.0009 | |||
| NOW / ServiceNow, Inc. | 0.00 | 0.23 | 0.0519 | 0.0519 | |||||
| JPM / JPMorgan Chase & Co. | 0.00 | 0.22 | 0.0488 | 0.0488 | |||||
| EFA / iShares Trust - iShares MSCI EAFE ETF | 0.00 | 0.21 | 0.0475 | 0.0475 | |||||
| DNB / Dun & Bradstreet Holdings, Inc. | 0.00 | -100.00 | 0.00 | 0.0000 | |||||
| CI / The Cigna Group | 0.00 | -100.00 | 0.00 | 0.0000 | |||||
| GEHC / GE HealthCare Technologies Inc. | 0.00 | -100.00 | 0.00 | 0.0000 | |||||
| PM / Philip Morris International Inc. | 0.00 | -100.00 | 0.00 | 0.0000 | |||||
| HOG / Harley-Davidson, Inc. | 0.00 | -100.00 | 0.00 | 0.0000 | |||||
| DOX / Amdocs Limited | 0.00 | -100.00 | 0.00 | 0.0000 | |||||
| FTDR / Frontdoor, Inc. | 0.00 | -100.00 | 0.00 | 0.0000 | |||||
| LNTH / Lantheus Holdings, Inc. | 0.00 | -100.00 | 0.00 | 0.0000 | |||||
| THRY / Thryv Holdings, Inc. | 0.00 | -100.00 | 0.00 | 0.0000 | |||||
| CVS / CVS Health Corporation | 0.00 | -100.00 | 0.00 | 0.0000 | |||||
| PRDO / Perdoceo Education Corporation | 0.00 | -100.00 | 0.00 | 0.0000 |