Mga Batayang Estadistika
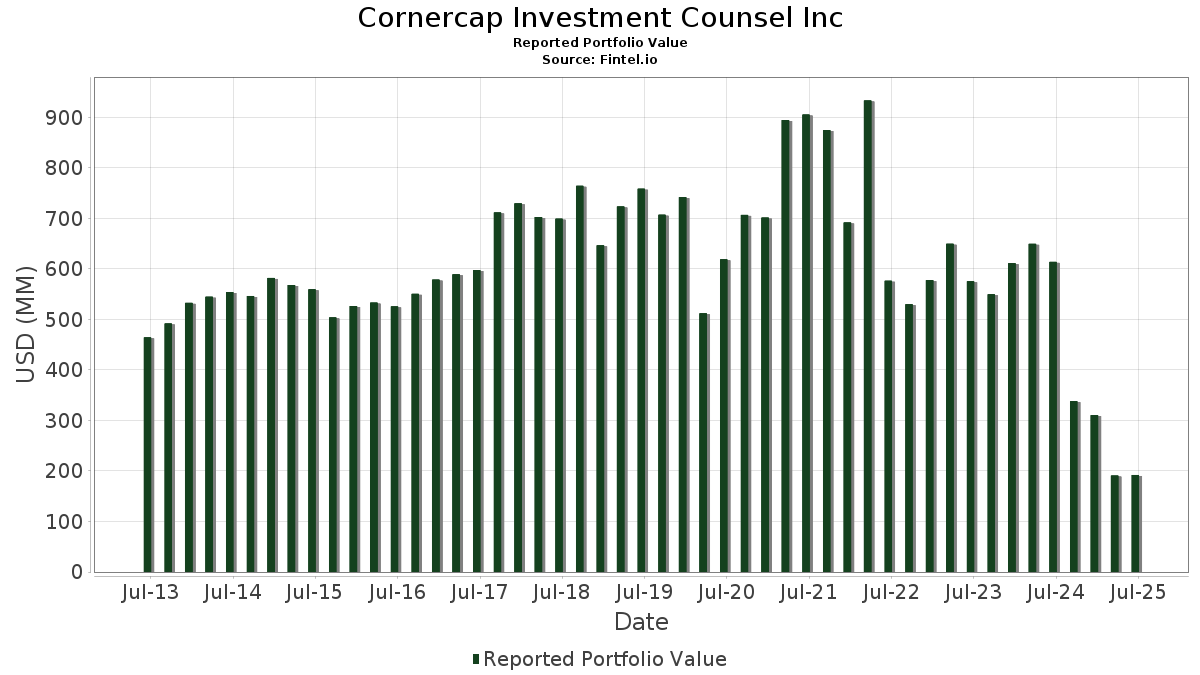
| Nilai Portofolio | $ 192,019,094 |
| Posisi Saat Ini | 152 |
Kepemilikan Terbaru, Kinerja, AUM (dari 13F, 13D)
Cornercap Investment Counsel Inc telah mengungkapkan total kepemilikan 152 dalam pengajuan SEC terbaru mereka. Nilai portofolio terbaru dihitung sebesar $ 192,019,094 USD. Aset yang Dikelola (AUM) sebenarnya adalah nilai ini ditambah kas (yang tidak diungkapkan). Aset-aset utama Cornercap Investment Counsel Inc adalah Johnson & Johnson (US:JNJ) , Wells Fargo & Company (US:WFC) , Cisco Systems, Inc. (US:CSCO) , The Walt Disney Company (US:DIS) , and JPMorgan Chase & Co. (US:JPM) . Posisi baru Cornercap Investment Counsel Inc meliputi: GE HealthCare Technologies Inc. (US:GEHC) , Zebra Technologies Corporation (US:ZBRA) , Ralliant Corporation (US:RAL) , .
Peningkatan Tertinggi Kuartal Ini
Kami menggunakan perubahan dalam alokasi portofolio karena ini adalah metrik yang paling bermakna. Perubahan dapat disebabkan oleh perdagangan atau perubahan harga saham.
| Keamanan | Saham (MM) |
Nilai (Juta Dolar AS) |
Portfolio % | ΔPorsyento ng Portfolio |
|---|---|---|---|---|
| 0.02 | 1.59 | 0.8259 | 0.8259 | |
| 0.04 | 1.51 | 0.7845 | 0.7845 | |
| 0.01 | 1.49 | 0.7736 | 0.7736 | |
| 0.01 | 1.44 | 0.7517 | 0.7517 | |
| 0.02 | 1.38 | 0.7175 | 0.7175 | |
| 0.00 | 1.00 | 0.5188 | 0.5188 | |
| 0.00 | 0.91 | 0.4752 | 0.4752 | |
| 0.01 | 1.74 | 0.9049 | 0.4447 | |
| 0.01 | 1.47 | 0.7652 | 0.4311 | |
| 0.00 | 0.81 | 0.4193 | 0.4193 |
Penurunan Tertinggi Kuartal Ini
Kami menggunakan perubahan dalam alokasi portofolio karena ini adalah metrik yang paling bermakna. Perubahan dapat disebabkan oleh perdagangan atau perubahan harga saham.
| Keamanan | Saham (MM) |
Nilai (Juta Dolar AS) |
Portfolio % | ΔPorsyento ng Portfolio |
|---|---|---|---|---|
| 0.00 | 0.75 | 0.3916 | -0.4285 | |
| 0.04 | 1.78 | 0.9246 | -0.3311 | |
| 0.00 | 2.40 | 1.2481 | -0.3298 | |
| 0.02 | 1.41 | 0.7338 | -0.2979 | |
| 0.03 | 1.33 | 0.6943 | -0.2568 | |
| 0.03 | 2.35 | 1.2216 | -0.2513 | |
| 0.02 | 1.03 | 0.5341 | -0.2387 | |
| 0.02 | 3.73 | 1.9401 | -0.2285 | |
| 0.01 | 1.92 | 1.0016 | -0.2043 | |
| 0.02 | 1.93 | 1.0026 | -0.1691 |
Pengajuan 13F dan Dana
Formulir ini diajukan pada 2025-08-06 untuk periode pelaporan 2025-06-30. Klik ikon tautan untuk melihat riwayat transaksi selengkapnya.
Tingkatkan ke versi premium untuk membuka data premium dan ekspor ke Excel. ![]() .
.
| Keamanan | Ketik | Harga Saham Rata-rata | Saham (MM) |
ΔSaham (%) |
ΔSaham (%) |
Nilai ($MM) |
Portpolyo (%) |
ΔPortofolio (%) |
|
|---|---|---|---|---|---|---|---|---|---|
| JNJ / Johnson & Johnson | 0.02 | -2.22 | 3.73 | -9.94 | 1.9401 | -0.2285 | |||
| WFC / Wells Fargo & Company | 0.04 | -13.85 | 3.50 | -3.85 | 1.8209 | -0.0857 | |||
| CSCO / Cisco Systems, Inc. | 0.05 | -2.26 | 3.45 | 9.87 | 1.7972 | 0.1508 | |||
| DIS / The Walt Disney Company | 0.02 | -2.30 | 2.85 | 22.76 | 1.4858 | 0.2673 | |||
| JPM / JPMorgan Chase & Co. | 0.01 | -20.62 | 2.48 | -6.21 | 1.2894 | -0.0943 | |||
| META / Meta Platforms, Inc. | 0.00 | -37.82 | 2.40 | -20.37 | 1.2481 | -0.3298 | |||
| COP / ConocoPhillips | 0.03 | -2.29 | 2.35 | -16.52 | 1.2216 | -0.2513 | |||
| C / Citigroup Inc. | 0.03 | -13.09 | 2.31 | 4.19 | 1.2045 | 0.0409 | |||
| BKNG / Booking Holdings Inc. | 0.00 | -1.55 | 2.20 | 23.68 | 1.1457 | 0.2134 | |||
| SCHW / The Charles Schwab Corporation | 0.02 | -2.10 | 2.10 | 14.11 | 1.0915 | 0.1285 | |||
| ABBV / AbbVie Inc. | 0.01 | 21.67 | 2.01 | 7.82 | 1.0491 | 0.0693 | |||
| CVS / CVS Health Corporation | 0.03 | -2.00 | 2.01 | -0.25 | 1.0452 | -0.0094 | |||
| VST / Vistra Corp. | 0.01 | -32.81 | 1.97 | 10.87 | 1.0257 | 0.0945 | |||
| MRK / Merck & Co., Inc. | 0.02 | -2.33 | 1.93 | -13.83 | 1.0026 | -0.1691 | |||
| CVX / Chevron Corporation | 0.01 | -2.31 | 1.92 | -16.39 | 1.0016 | -0.2043 | |||
| CMCSA / Comcast Corporation | 0.05 | -2.45 | 1.85 | -5.65 | 0.9653 | -0.0646 | |||
| HCA / HCA Healthcare, Inc. | 0.00 | -2.13 | 1.78 | 8.48 | 0.9269 | 0.0669 | |||
| BMY / Bristol-Myers Squibb Company | 0.04 | -2.33 | 1.78 | -25.89 | 0.9246 | -0.3311 | |||
| AMD / Advanced Micro Devices, Inc. | 0.01 | 43.33 | 1.74 | 98.06 | 0.9049 | 0.4447 | |||
| MA / Mastercard Incorporated | 0.00 | -0.87 | 1.74 | 1.64 | 0.9037 | 0.0086 | |||
| NTRS / Northern Trust Corporation | 0.01 | -17.63 | 1.72 | 5.83 | 0.8983 | 0.0441 | |||
| V / Visa Inc. | 0.00 | -2.12 | 1.72 | -0.86 | 0.8960 | -0.0136 | |||
| NEM / Newmont Corporation | 0.03 | -2.24 | 1.71 | 18.00 | 0.8912 | 0.1307 | |||
| RF / Regions Financial Corporation | 0.07 | -2.27 | 1.70 | 5.78 | 0.8863 | 0.0428 | |||
| TFC / Truist Financial Corporation | 0.04 | -2.25 | 1.67 | 2.08 | 0.8701 | 0.0123 | |||
| HIG / The Hartford Insurance Group, Inc. | 0.01 | -2.14 | 1.67 | 0.36 | 0.8687 | -0.0029 | |||
| MSFT / Microsoft Corporation | 0.00 | -2.37 | 1.66 | 29.34 | 0.8660 | 0.1921 | |||
| LDOS / Leidos Holdings, Inc. | 0.01 | -2.22 | 1.65 | 14.32 | 0.8609 | 0.1028 | |||
| MO / Altria Group, Inc. | 0.03 | -2.18 | 1.62 | -4.42 | 0.8453 | -0.0452 | |||
| GOOGL / Alphabet Inc. | 0.01 | -2.28 | 1.60 | 11.40 | 0.8343 | 0.0801 | |||
| BAC / Bank of America Corporation | 0.03 | -2.39 | 1.60 | 10.71 | 0.8343 | 0.0755 | |||
| SPGI / S&P Global Inc. | 0.00 | -2.23 | 1.60 | 1.46 | 0.8315 | 0.0065 | |||
| ULTA / Ulta Beauty, Inc. | 0.00 | -2.35 | 1.59 | 24.63 | 0.8303 | 0.1596 | |||
| FNF / Fidelity National Financial, Inc. | 0.03 | -2.07 | 1.59 | -15.61 | 0.8276 | -0.1601 | |||
| PM / Philip Morris International Inc. | 0.01 | -24.79 | 1.59 | -13.71 | 0.8261 | -0.1376 | |||
| GEHC / GE HealthCare Technologies Inc. | 0.02 | 1.59 | 0.8259 | 0.8259 | |||||
| LRCX / Lam Research Corporation | 0.02 | -2.54 | 1.58 | 30.50 | 0.8245 | 0.1884 | |||
| TMUS / T-Mobile US, Inc. | 0.01 | -2.09 | 1.58 | -12.54 | 0.8210 | -0.1239 | |||
| EA / Electronic Arts Inc. | 0.01 | -2.25 | 1.57 | 8.04 | 0.8189 | 0.0557 | |||
| GILD / Gilead Sciences, Inc. | 0.01 | -2.19 | 1.57 | -3.21 | 0.8169 | -0.0329 | |||
| MCO / Moody's Corporation | 0.00 | 89.34 | 1.57 | 104.04 | 0.8166 | 0.4135 | |||
| SYY / Sysco Corporation | 0.02 | -2.22 | 1.55 | -1.34 | 0.8065 | -0.0162 | |||
| MMM / 3M Company | 0.01 | -18.16 | 1.54 | -15.19 | 0.8028 | -0.1498 | |||
| SSNC / SS&C Technologies Holdings, Inc. | 0.02 | 71.22 | 1.54 | 69.72 | 0.8003 | 0.3256 | |||
| CAT / Caterpillar Inc. | 0.00 | -2.40 | 1.53 | 14.88 | 0.7966 | 0.0985 | |||
| ELV / Elevance Health, Inc. | 0.00 | -2.10 | 1.53 | -12.45 | 0.7951 | -0.1191 | |||
| TRV / The Travelers Companies, Inc. | 0.01 | -17.90 | 1.52 | -16.94 | 0.7918 | -0.1679 | |||
| RTX / RTX Corporation | 0.01 | -21.08 | 1.51 | -12.98 | 0.7861 | -0.1235 | |||
| PPL / PPL Corporation | 0.04 | 1.51 | 0.7845 | 0.7845 | |||||
| MET / MetLife, Inc. | 0.02 | -2.28 | 1.50 | -2.09 | 0.7813 | -0.0223 | |||
| BR / Broadridge Financial Solutions, Inc. | 0.01 | 85.98 | 1.49 | 86.50 | 0.7772 | 0.3575 | |||
| PEP / PepsiCo, Inc. | 0.01 | 1.49 | 0.7736 | 0.7736 | |||||
| DUK / Duke Energy Corporation | 0.01 | -2.19 | 1.48 | -5.36 | 0.7723 | -0.0494 | |||
| ADBE / Adobe Inc. | 0.00 | -2.23 | 1.48 | -1.40 | 0.7701 | -0.0159 | |||
| WDAY / Workday, Inc. | 0.01 | 124.33 | 1.47 | 130.61 | 0.7652 | 0.4311 | |||
| PFE / Pfizer Inc. | 0.06 | -2.28 | 1.46 | -6.53 | 0.7609 | -0.0586 | |||
| WTW / Willis Towers Watson Public Limited Company | 0.00 | -2.08 | 1.45 | -11.18 | 0.7574 | -0.1012 | |||
| ACN / Accenture plc | 0.00 | -2.24 | 1.45 | -6.40 | 0.7551 | -0.0567 | |||
| LEN / Lennar Corporation | 0.01 | 1.44 | 0.7517 | 0.7517 | |||||
| EXPE / Expedia Group, Inc. | 0.01 | -10.60 | 1.43 | -10.33 | 0.7467 | -0.0913 | |||
| CTRA / Coterra Energy Inc. | 0.06 | -2.22 | 1.43 | -14.15 | 0.7463 | -0.1287 | |||
| SLB / Schlumberger Limited | 0.04 | 10.56 | 1.43 | -10.58 | 0.7438 | -0.0938 | |||
| DVN / Devon Energy Corporation | 0.04 | 44.28 | 1.42 | 22.69 | 0.7409 | 0.1331 | |||
| ZM / Zoom Communications Inc. | 0.02 | -2.36 | 1.42 | 3.27 | 0.7395 | 0.0182 | |||
| USB / U.S. Bancorp | 0.03 | -2.42 | 1.41 | 4.59 | 0.7363 | 0.0275 | |||
| EBAY / eBay Inc. | 0.02 | -34.87 | 1.41 | -28.37 | 0.7338 | -0.2979 | |||
| LMT / Lockheed Martin Corporation | 0.00 | -2.13 | 1.38 | 1.47 | 0.7202 | 0.0057 | |||
| XEL / Xcel Energy Inc. | 0.02 | 1.38 | 0.7175 | 0.7175 | |||||
| TXT / Textron Inc. | 0.02 | -2.49 | 1.37 | 8.37 | 0.7152 | 0.0507 | |||
| MSCI / MSCI Inc. | 0.00 | -2.22 | 1.37 | -0.29 | 0.7133 | -0.0068 | |||
| TEAM / Atlassian Corporation | 0.01 | -2.30 | 1.36 | -6.52 | 0.7097 | -0.0544 | |||
| CSX / CSX Corporation | 0.04 | -2.49 | 1.34 | 8.06 | 0.6982 | 0.0481 | |||
| VZ / Verizon Communications Inc. | 0.03 | -22.96 | 1.33 | -26.52 | 0.6943 | -0.2568 | |||
| CI / The Cigna Group | 0.00 | -2.30 | 1.32 | -1.86 | 0.6880 | -0.0175 | |||
| TROW / T. Rowe Price Group, Inc. | 0.01 | -2.47 | 1.30 | 2.52 | 0.6786 | 0.0118 | |||
| EOG / EOG Resources, Inc. | 0.01 | -2.39 | 1.30 | -8.97 | 0.6769 | -0.0716 | |||
| NTAP / NetApp, Inc. | 0.01 | -2.64 | 1.30 | 18.16 | 0.6746 | 0.0995 | |||
| OXY / Occidental Petroleum Corporation | 0.03 | -2.35 | 1.29 | -16.90 | 0.6735 | -0.1423 | |||
| KHC / The Kraft Heinz Company | 0.05 | -2.22 | 1.29 | -17.05 | 0.6718 | -0.1433 | |||
| QCOM / QUALCOMM Incorporated | 0.01 | -2.50 | 1.27 | 1.12 | 0.6595 | 0.0027 | |||
| GIS / General Mills, Inc. | 0.02 | -2.25 | 1.26 | -15.35 | 0.6551 | -0.1235 | |||
| PFG / Principal Financial Group, Inc. | 0.02 | -2.41 | 1.25 | -8.14 | 0.6528 | -0.0625 | |||
| KMB / Kimberly-Clark Corporation | 0.01 | -2.30 | 1.22 | -11.43 | 0.6341 | -0.0867 | |||
| CRM / Salesforce, Inc. | 0.00 | -2.43 | 1.21 | -0.90 | 0.6327 | -0.0097 | |||
| MAS / Masco Corporation | 0.02 | -2.46 | 1.21 | -9.72 | 0.6286 | -0.0724 | |||
| TMO / Thermo Fisher Scientific Inc. | 0.00 | -2.19 | 1.19 | -20.35 | 0.6223 | -0.1638 | |||
| FDX / FedEx Corporation | 0.01 | -2.49 | 1.15 | -9.11 | 0.5982 | -0.0641 | |||
| AVY / Avery Dennison Corporation | 0.01 | -2.51 | 1.13 | -3.91 | 0.5892 | -0.0279 | |||
| UPS / United Parcel Service, Inc. | 0.01 | -2.60 | 1.03 | -10.69 | 0.5358 | -0.0676 | |||
| FTV / Fortive Corporation | 0.02 | -2.33 | 1.03 | -30.46 | 0.5341 | -0.2387 | |||
| HOLX / Hologic, Inc. | 0.02 | -2.79 | 1.02 | 2.51 | 0.5325 | 0.0097 | |||
| ETR / Entergy Corporation | 0.01 | -1.96 | 1.01 | -4.62 | 0.5267 | -0.0295 | |||
| AMAT / Applied Materials, Inc. | 0.01 | -3.04 | 1.01 | 22.28 | 0.5262 | 0.0931 | |||
| CEG / Constellation Energy Corporation | 0.00 | -2.35 | 1.01 | 56.45 | 0.5239 | 0.1865 | |||
| APTV / Aptiv PLC | 0.01 | -2.15 | 1.00 | 12.09 | 0.5218 | 0.0536 | |||
| COF / Capital One Financial Corporation | 0.00 | 1.00 | 0.5188 | 0.5188 | |||||
| BIIB / Biogen Inc. | 0.01 | -2.68 | 0.99 | -10.64 | 0.5163 | -0.0656 | |||
| VEEV / Veeva Systems Inc. | 0.00 | -2.21 | 0.97 | 21.64 | 0.5039 | 0.0867 | |||
| CTVA / Corteva, Inc. | 0.01 | -2.17 | 0.95 | 15.94 | 0.4965 | 0.0651 | |||
| KR / The Kroger Co. | 0.01 | -2.03 | 0.94 | 3.85 | 0.4919 | 0.0149 | |||
| TGT / Target Corporation | 0.01 | -2.80 | 0.94 | -8.08 | 0.4917 | -0.0470 | |||
| WAB / Westinghouse Air Brake Technologies Corporation | 0.00 | -2.12 | 0.92 | 13.05 | 0.4783 | 0.0522 | |||
| ZBRA / Zebra Technologies Corporation | 0.00 | 0.91 | 0.4752 | 0.4752 | |||||
| MS / Morgan Stanley | 0.01 | -2.27 | 0.90 | 18.05 | 0.4668 | 0.0685 | |||
| TJX / The TJX Companies, Inc. | 0.01 | -2.04 | 0.87 | -0.68 | 0.4539 | -0.0062 | |||
| PNR / Pentair plc | 0.01 | -2.28 | 0.85 | 14.61 | 0.4416 | 0.0539 | |||
| TER / Teradyne, Inc. | 0.01 | 60.85 | 0.82 | 75.21 | 0.4275 | 0.1817 | |||
| NI / NiSource Inc. | 0.02 | -2.18 | 0.81 | -1.58 | 0.4225 | -0.0096 | |||
| NOW / ServiceNow, Inc. | 0.00 | -2.11 | 0.81 | 26.41 | 0.4214 | 0.0858 | |||
| LHX / L3Harris Technologies, Inc. | 0.00 | 0.81 | 0.4193 | 0.4193 | |||||
| TEL / TE Connectivity plc | 0.00 | -2.32 | 0.80 | 16.59 | 0.4172 | 0.0569 | |||
| CRBG / Corebridge Financial, Inc. | 0.02 | -2.36 | 0.80 | 9.92 | 0.4157 | 0.0345 | |||
| HON / Honeywell International Inc. | 0.00 | -2.21 | 0.80 | 7.58 | 0.4142 | 0.0265 | |||
| D / Dominion Energy, Inc. | 0.01 | -2.21 | 0.78 | -1.39 | 0.4068 | -0.0086 | |||
| DD / DuPont de Nemours, Inc. | 0.01 | 27.97 | 0.77 | 17.50 | 0.4024 | 0.0577 | |||
| UNH / UnitedHealth Group Incorporated | 0.00 | 0.77 | 0.3992 | 0.3992 | |||||
| EVRG / Evergy, Inc. | 0.01 | -2.19 | 0.76 | -2.31 | 0.3973 | -0.0117 | |||
| FI / Fiserv, Inc. | 0.00 | 0.76 | 0.3952 | 0.3952 | |||||
| CMI / Cummins Inc. | 0.00 | -2.20 | 0.76 | 2.30 | 0.3943 | 0.0059 | |||
| DOV / Dover Corporation | 0.00 | -53.91 | 0.75 | -51.98 | 0.3916 | -0.4285 | |||
| CTSH / Cognizant Technology Solutions Corporation | 0.01 | -2.29 | 0.74 | -0.27 | 0.3846 | -0.0039 | |||
| APP / AppLovin Corporation | 0.00 | -31.32 | 0.74 | -9.25 | 0.3834 | -0.0420 | |||
| LAMR / Lamar Advertising Company | 0.01 | -2.25 | 0.72 | 4.34 | 0.3757 | 0.0129 | |||
| WPC / W. P. Carey Inc. | 0.01 | -2.25 | 0.72 | -3.38 | 0.3727 | -0.0156 | |||
| AIG / American International Group, Inc. | 0.01 | -2.24 | 0.71 | -3.78 | 0.3716 | -0.0171 | |||
| LYB / LyondellBasell Industries N.V. | 0.01 | -3.09 | 0.71 | -20.41 | 0.3679 | -0.0971 | |||
| FR / First Industrial Realty Trust, Inc. | 0.01 | -2.24 | 0.68 | -12.80 | 0.3549 | -0.0548 | |||
| NNN / NNN REIT, Inc. | 0.02 | -2.32 | 0.68 | -1.02 | 0.3526 | -0.0063 | |||
| TSN / Tyson Foods, Inc. | 0.01 | -2.21 | 0.67 | -14.36 | 0.3514 | -0.0613 | |||
| O / Realty Income Corporation | 0.01 | -2.30 | 0.66 | -3.07 | 0.3451 | -0.0130 | |||
| HD / The Home Depot, Inc. | 0.00 | -2.38 | 0.66 | -2.36 | 0.3450 | -0.0106 | |||
| MAA / Mid-America Apartment Communities, Inc. | 0.00 | -2.20 | 0.65 | -13.65 | 0.3364 | -0.0556 | |||
| MDT / Medtronic plc | 0.01 | -2.38 | 0.63 | -5.40 | 0.3290 | -0.0208 | |||
| ELS / Equity LifeStyle Properties, Inc. | 0.01 | -2.26 | 0.63 | -9.74 | 0.3285 | -0.0375 | |||
| MPC / Marathon Petroleum Corporation | 0.00 | -2.70 | 0.61 | 10.91 | 0.3181 | 0.0294 | |||
| NBIX / Neurocrine Biosciences, Inc. | 0.00 | -2.68 | 0.61 | 10.51 | 0.3181 | 0.0285 | |||
| PINS / Pinterest, Inc. | 0.02 | -2.81 | 0.60 | 12.50 | 0.3144 | 0.0329 | |||
| GLPI / Gaming and Leisure Properties, Inc. | 0.01 | -2.31 | 0.60 | -10.43 | 0.3133 | -0.0388 | |||
| CUBE / CubeSmart | 0.01 | -2.45 | 0.60 | -2.93 | 0.3108 | -0.0115 | |||
| NXPI / NXP Semiconductors N.V. | 0.00 | -2.60 | 0.58 | 11.95 | 0.3028 | 0.0306 | |||
| SBAC / SBA Communications Corporation | 0.00 | -2.42 | 0.58 | 4.15 | 0.3007 | 0.0101 | |||
| HST / Host Hotels & Resorts, Inc. | 0.04 | -2.63 | 0.56 | 5.25 | 0.2922 | 0.0127 | |||
| OC / Owens Corning | 0.00 | -2.56 | 0.52 | -6.27 | 0.2729 | -0.0199 | |||
| BBY / Best Buy Co., Inc. | 0.01 | -2.65 | 0.52 | -11.22 | 0.2719 | -0.0364 | |||
| AKAM / Akamai Technologies, Inc. | 0.01 | -2.79 | 0.46 | -3.77 | 0.2399 | -0.0109 | |||
| CAG / Conagra Brands, Inc. | 0.02 | -2.50 | 0.44 | -25.08 | 0.2302 | -0.0795 | |||
| AMT / American Tower Corporation | 0.00 | 0.38 | 0.1968 | 0.1968 | |||||
| VICI / VICI Properties Inc. | 0.01 | -2.21 | 0.37 | -2.14 | 0.1908 | -0.0057 | |||
| EQIX / Equinix, Inc. | 0.00 | 0.32 | 0.1674 | 0.1674 | |||||
| ADC / Agree Realty Corporation | 0.00 | -2.23 | 0.32 | -7.25 | 0.1667 | -0.0147 | |||
| RAL / Ralliant Corporation | 0.01 | 0.32 | 0.1656 | 0.1656 | |||||
| KIM / Kimco Realty Corporation | 0.01 | -2.39 | 0.31 | -3.38 | 0.1637 | -0.0069 | |||
| TEVA / Teva Pharmaceutical Industries Limited - Depositary Receipt (Common Stock) | 0.00 | -100.00 | 0.00 | 0.0000 | |||||
| STAG / STAG Industrial, Inc. | 0.00 | -100.00 | 0.00 | 0.0000 | |||||
| XYZ / Block, Inc. | 0.00 | -100.00 | 0.00 | 0.0000 | |||||
| EQR / Equity Residential | 0.00 | -100.00 | 0.00 | 0.0000 | |||||
| DASH / DoorDash, Inc. | 0.00 | -100.00 | 0.00 | 0.0000 | |||||
| APO / Apollo Global Management, Inc. | 0.00 | -100.00 | 0.00 | 0.0000 | |||||
| BAX / Baxter International Inc. | 0.00 | -100.00 | 0.00 | 0.0000 | |||||
| DELL / Dell Technologies Inc. | 0.00 | -100.00 | 0.00 | 0.0000 | |||||
| DAL / Delta Air Lines, Inc. | 0.00 | -100.00 | 0.00 | 0.0000 | |||||
| UHS / Universal Health Services, Inc. | 0.00 | -100.00 | 0.00 | 0.0000 | |||||
| EIX / Edison International | 0.00 | -100.00 | 0.00 | 0.0000 | |||||
| DFS / Discover Financial Services | 0.00 | -100.00 | 0.00 | 0.0000 | |||||
| NRG / NRG Energy, Inc. | 0.00 | -100.00 | 0.00 | 0.0000 |