Mga Batayang Estadistika
| Nilai Portofolio | $ 700,025 |
| Posisi Saat Ini | 71 |
Kepemilikan Terbaru, Kinerja, AUM (dari 13F, 13D)
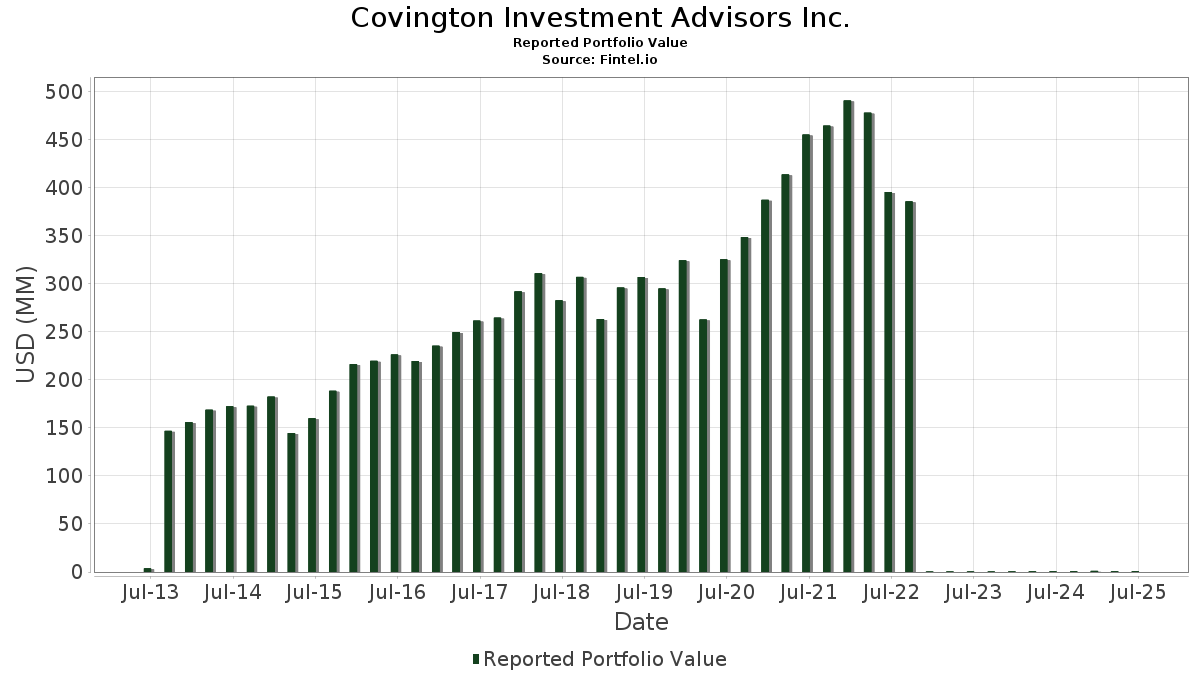
Covington Investment Advisors Inc. telah mengungkapkan total kepemilikan 71 dalam pengajuan SEC terbaru mereka. Nilai portofolio terbaru dihitung sebesar $ 700,025 USD. Aset yang Dikelola (AUM) sebenarnya adalah nilai ini ditambah kas (yang tidak diungkapkan). Aset-aset utama Covington Investment Advisors Inc. adalah Microsoft Corporation (US:MSFT) , Alphabet Inc. (US:GOOG) , Broadcom Inc. (US:AVGO) , NVIDIA Corporation (US:NVDA) , and Apple Inc. (US:AAPL) . Posisi baru Covington Investment Advisors Inc. meliputi: Lam Research Corporation (US:LRCX) , Synopsys, Inc. (US:SNPS) , Cactus, Inc. (US:WHD) , .
Peningkatan Tertinggi Kuartal Ini
Kami menggunakan perubahan dalam alokasi portofolio karena ini adalah metrik yang paling bermakna. Perubahan dapat disebabkan oleh perdagangan atau perubahan harga saham.
| Keamanan | Saham (MM) |
Nilai (Juta Dolar AS) |
Portfolio % | ΔPorsyento ng Portfolio |
|---|---|---|---|---|
| 0.14 | 0.04 | 5.5292 | 1.7469 | |
| 0.02 | 0.01 | 1.3420 | 1.3420 | |
| 0.09 | 0.05 | 6.6832 | 1.2118 | |
| 0.20 | 0.03 | 4.4220 | 1.1430 | |
| 0.07 | 0.01 | 1.3795 | 0.7597 | |
| 0.12 | 0.01 | 0.7535 | 0.7535 | |
| 0.02 | 0.02 | 2.3111 | 0.6829 | |
| 0.17 | 0.02 | 2.5303 | 0.5030 | |
| 0.12 | 0.03 | 3.6853 | 0.4395 | |
| 0.02 | 0.01 | 1.1361 | 0.3478 |
Penurunan Tertinggi Kuartal Ini
Kami menggunakan perubahan dalam alokasi portofolio karena ini adalah metrik yang paling bermakna. Perubahan dapat disebabkan oleh perdagangan atau perubahan harga saham.
| Keamanan | Saham (MM) |
Nilai (Juta Dolar AS) |
Portfolio % | ΔPorsyento ng Portfolio |
|---|---|---|---|---|
| 0.00 | 0.00 | -2.1340 | ||
| 0.03 | 0.00 | 0.6361 | -0.9012 | |
| 0.09 | 0.02 | 2.3165 | -0.7934 | |
| 0.13 | 0.03 | 3.9453 | -0.7588 | |
| 0.03 | 0.01 | 1.9709 | -0.5205 | |
| 0.03 | 0.01 | 2.0824 | -0.4629 | |
| 0.11 | 0.01 | 1.4594 | -0.3691 | |
| 0.02 | 0.02 | 2.4069 | -0.3251 | |
| 0.04 | 0.01 | 1.4541 | -0.2287 | |
| 0.06 | 0.01 | 1.2231 | -0.2108 |
Pengajuan 13F dan Dana
Formulir ini diajukan pada 2025-08-12 untuk periode pelaporan 2025-06-30. Klik ikon tautan untuk melihat riwayat transaksi selengkapnya.
Tingkatkan ke versi premium untuk membuka data premium dan ekspor ke Excel. ![]() .
.
| Keamanan | Ketik | Harga Saham Rata-rata | Saham (MM) |
ΔSaham (%) |
ΔSaham (%) |
Nilai ($MM) |
Portpolyo (%) |
ΔPortofolio (%) |
|
|---|---|---|---|---|---|---|---|---|---|
| MSFT / Microsoft Corporation | 0.09 | 0.29 | 0.05 | 31.43 | 6.6832 | 1.2118 | |||
| GOOG / Alphabet Inc. | 0.23 | -2.92 | 0.04 | 11.11 | 5.7452 | 0.0749 | |||
| AVGO / Broadcom Inc. | 0.14 | -3.40 | 0.04 | 58.33 | 5.5292 | 1.7469 | |||
| NVDA / NVIDIA Corporation | 0.20 | 0.65 | 0.03 | 42.86 | 4.4220 | 1.1430 | |||
| AAPL / Apple Inc. | 0.13 | -1.21 | 0.03 | -10.00 | 3.9453 | -0.7588 | |||
| AMZN / Amazon.com, Inc. | 0.12 | 7.12 | 0.03 | 25.00 | 3.6853 | 0.4395 | |||
| V / Visa Inc. | 0.06 | 0.15 | 0.02 | 5.26 | 2.8772 | -0.2078 | |||
| PNC / The PNC Financial Services Group, Inc. | 0.10 | 1.37 | 0.02 | 6.25 | 2.5572 | -0.0306 | |||
| ANET / Arista Networks Inc | 0.17 | 2.83 | 0.02 | 30.77 | 2.5303 | 0.5030 | |||
| SPGI / S&P Global Inc. | 0.03 | 1.89 | 0.02 | 0.00 | 2.4265 | -0.0703 | |||
| LLY / Eli Lilly and Company | 0.02 | 1.55 | 0.02 | -5.88 | 2.4069 | -0.3251 | |||
| LRCX / Lam Research Corporation | 0.17 | 0.02 | 0.0000 | ||||||
| FI / Fiserv, Inc. | 0.09 | 3.80 | 0.02 | -20.00 | 2.3165 | -0.7934 | |||
| C.WSA / Citigroup, Inc. | 0.02 | 2.45 | 0.02 | 14.29 | 2.3156 | 0.0976 | |||
| META / Meta Platforms, Inc. | 0.02 | 20.59 | 0.02 | 60.00 | 2.3111 | 0.6829 | |||
| RTX / RTX Corporation | 0.11 | -0.04 | 0.02 | 7.14 | 2.2758 | 0.0288 | |||
| WSO / Watsco, Inc. | 0.03 | 2.44 | 0.01 | -12.50 | 2.0824 | -0.4629 | |||
| TMO / Thermo Fisher Scientific Inc. | 0.03 | 5.62 | 0.01 | -18.75 | 1.9709 | -0.5205 | |||
| DRI / Darden Restaurants, Inc. | 0.06 | -0.98 | 0.01 | 0.00 | 1.8032 | -0.0852 | |||
| TXN / Texas Instruments Incorporated | 0.06 | -10.81 | 0.01 | 0.00 | 1.6797 | -0.0938 | |||
| HD / The Home Depot, Inc. | 0.03 | -1.26 | 0.01 | 0.00 | 1.5412 | -0.1561 | |||
| A / Agilent Technologies, Inc. | 0.09 | 2.13 | 0.01 | 0.00 | 1.5047 | -0.0841 | |||
| COP / ConocoPhillips | 0.11 | 1.62 | 0.01 | -9.09 | 1.4594 | -0.3691 | |||
| APD / Air Products and Chemicals, Inc. | 0.04 | -1.71 | 0.01 | 0.00 | 1.4541 | -0.2287 | |||
| ABT / Abbott Laboratories | 0.07 | 0.32 | 0.01 | 200.00 | 1.3795 | 0.7597 | |||
| JPM / JPMorgan Chase & Co. | 0.03 | -3.20 | 0.01 | 12.50 | 1.3527 | 0.0665 | |||
| SNPS / Synopsys, Inc. | 0.02 | 0.01 | 1.3420 | 1.3420 | |||||
| MCD / McDonald's Corporation | 0.03 | 0.17 | 0.01 | -11.11 | 1.2542 | -0.2054 | |||
| JNJ / Johnson & Johnson | 0.06 | 0.75 | 0.01 | -11.11 | 1.2231 | -0.2108 | |||
| IBMP / iShares Trust - iShares iBonds Dec 2027 Term Muni Bond ETF | 0.33 | 1.37 | 0.01 | 0.00 | 1.1918 | -0.0838 | |||
| CTVA / Corteva, Inc. | 0.11 | -0.31 | 0.01 | 14.29 | 1.1855 | 0.0931 | |||
| VCIT / Vanguard Scottsdale Funds - Vanguard Intermediate-Term Corporate Bond ETF | 0.10 | -1.04 | 0.01 | 14.29 | 1.1430 | -0.0960 | |||
| SYK / Stryker Corporation | 0.02 | 0.03 | 0.01 | 0.00 | 1.1378 | -0.0266 | |||
| CAT / Caterpillar Inc. | 0.02 | 33.21 | 0.01 | 40.00 | 1.1361 | 0.3478 | |||
| IBMO / iShares Trust - iShares iBonds Dec 2026 Term Muni Bond ETF | 0.31 | 1.76 | 0.01 | 0.00 | 1.1222 | -0.0866 | |||
| IBMQ / iShares Trust - iShares iBonds Dec 2028 Term Muni Bond ETF | 0.31 | 9.30 | 0.01 | 0.00 | 1.1194 | 0.0105 | |||
| WMT / Walmart Inc. | 0.08 | -5.80 | 0.01 | 0.00 | 1.1108 | -0.0410 | |||
| COST / Costco Wholesale Corporation | 0.01 | -2.86 | 0.01 | 0.00 | 1.0891 | -0.0762 | |||
| LHX / L3Harris Technologies, Inc. | 0.03 | 0.51 | 0.01 | 16.67 | 1.0500 | 0.1016 | |||
| BX / Blackstone Inc. | 0.05 | -0.95 | 0.01 | 16.67 | 1.0448 | -0.0275 | |||
| PG / The Procter & Gamble Company | 0.04 | 10.15 | 0.01 | 0.00 | 0.9834 | -0.0556 | |||
| HON / Honeywell International Inc. | 0.03 | 3.20 | 0.01 | 20.00 | 0.9473 | 0.0392 | |||
| IBMN / iShares Trust - iShares iBonds Dec 2025 Term Muni Bond ETF | 0.24 | -6.94 | 0.01 | -14.29 | 0.9364 | -0.1577 | |||
| DUK / Duke Energy Corporation | 0.05 | 0.21 | 0.01 | 0.00 | 0.8585 | -0.1049 | |||
| PLD / Prologis, Inc. | 0.06 | 18.27 | 0.01 | 0.00 | 0.8361 | 0.0182 | |||
| KO / The Coca-Cola Company | 0.08 | 5.82 | 0.01 | 0.00 | 0.8303 | -0.0338 | |||
| VYM / Vanguard Whitehall Funds - Vanguard High Dividend Yield ETF | 0.04 | 2.17 | 0.01 | 0.00 | 0.8130 | -0.0244 | |||
| WHD / Cactus, Inc. | 0.12 | 0.01 | 0.7535 | 0.7535 | |||||
| CVX / Chevron Corporation | 0.03 | -47.41 | 0.00 | -55.56 | 0.6361 | -0.9012 | |||
| PEP / PepsiCo, Inc. | 0.03 | 13.40 | 0.00 | 0.00 | 0.5907 | -0.0527 | |||
| CEG / Constellation Energy Corporation | 0.01 | -0.02 | 0.00 | 50.00 | 0.5698 | 0.1824 | |||
| NEE / NextEra Energy, Inc. | 0.06 | -0.56 | 0.00 | -25.00 | 0.5640 | -0.0661 | |||
| VUG / Vanguard Index Funds - Vanguard Growth ETF | 0.01 | 0.79 | 0.00 | 0.00 | 0.5344 | 0.0464 | |||
| EXC / Exelon Corporation | 0.05 | 0.15 | 0.00 | 0.00 | 0.3318 | -0.0508 | |||
| VO / Vanguard Index Funds - Vanguard Mid-Cap ETF | 0.01 | 5.18 | 0.00 | 100.00 | 0.3181 | 0.0140 | |||
| IBDS / iShares Trust - iShares iBonds Dec 2027 Term Corporate ETF | 0.09 | 2.62 | 0.00 | 0.00 | 0.2971 | -0.0166 | |||
| IBDR / iShares Trust - iShares iBonds Dec 2026 Term Corporate ETF | 0.08 | 0.38 | 0.00 | 0.00 | 0.2900 | -0.0238 | |||
| IBDQ / iShares Trust - iShares iBonds Dec 2025 Term Corporate ETF | 0.08 | -0.60 | 0.00 | 0.00 | 0.2860 | -0.0267 | |||
| IBDT / iShares Trust - iShares iBonds Dec 2028 Term Corporate ETF | 0.08 | 15.98 | 0.00 | 0.00 | 0.2824 | 0.0191 | |||
| WAB / Westinghouse Air Brake Technologies Corporation | 0.01 | -1.02 | 0.00 | 0.00 | 0.2750 | 0.0131 | |||
| VBK / Vanguard Index Funds - Vanguard Small-Cap Growth ETF | 0.01 | -0.24 | 0.00 | 0.00 | 0.2464 | 0.0021 | |||
| PH / Parker-Hannifin Corporation | 0.00 | 16.61 | 0.00 | 0.00 | 0.2270 | 0.0427 | |||
| BRK.B / Berkshire Hathaway Inc. | 0.00 | 0.00 | 0.00 | 0.00 | 0.1613 | -0.0311 | |||
| SCHX / Schwab Strategic Trust - Schwab U.S. Large-Cap ETF | 0.04 | 4.04 | 0.00 | 0.1226 | 0.0068 | ||||
| VOO / Vanguard Index Funds - Vanguard S&P 500 ETF | 0.00 | -3.57 | 0.00 | 0.1206 | -0.0024 | ||||
| GOOGL / Alphabet Inc. | 0.00 | 30.73 | 0.00 | 0.1193 | 0.0321 | ||||
| GD / General Dynamics Corporation | 0.00 | -3.75 | 0.00 | 0.0770 | -0.0043 | ||||
| SCHD / Schwab Strategic Trust - Schwab U.S. Dividend Equity ETF | 0.02 | 4.50 | 0.00 | 0.0753 | -0.0074 | ||||
| SPY / SPDR S&P 500 ETF | 0.00 | 0.00 | 0.00 | 0.0466 | 0.0007 | ||||
| RSG / Republic Services, Inc. | 0.00 | 0.00 | 0.00 | 0.0370 | -0.0025 | ||||
| VV / Vanguard Index Funds - Vanguard Large-Cap ETF | 0.00 | 0.00 | 0.0316 | 0.0316 | |||||
| HSY / The Hershey Company | 0.00 | -100.00 | 0.00 | 0.0000 | |||||
| NSC / Norfolk Southern Corporation | 0.00 | -100.00 | 0.00 | 0.0000 | |||||
| ACN / Accenture plc | 0.00 | -100.00 | 0.00 | -100.00 | -2.1340 |