Mga Batayang Estadistika
| Nilai Portofolio | $ 89,374,984 |
| Posisi Saat Ini | 72 |
Kepemilikan Terbaru, Kinerja, AUM (dari 13F, 13D)
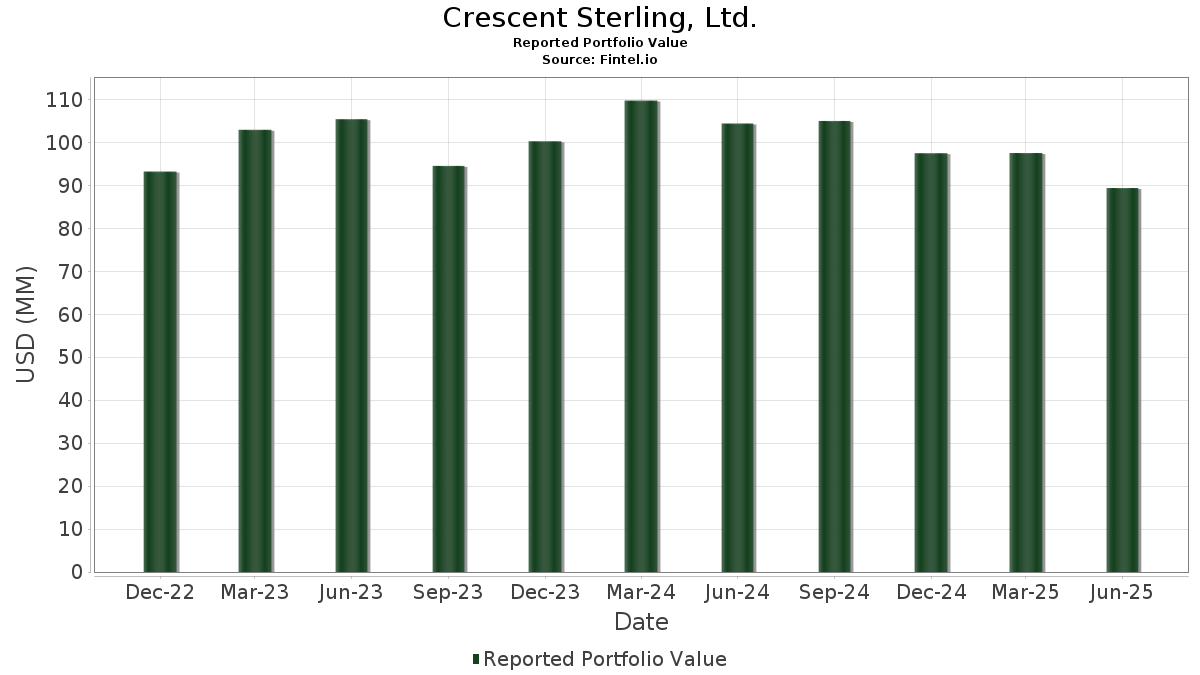
Crescent Sterling, Ltd. telah mengungkapkan total kepemilikan 72 dalam pengajuan SEC terbaru mereka. Nilai portofolio terbaru dihitung sebesar $ 89,374,984 USD. Aset yang Dikelola (AUM) sebenarnya adalah nilai ini ditambah kas (yang tidak diungkapkan). Aset-aset utama Crescent Sterling, Ltd. adalah Schwab Strategic Trust - Schwab U.S. Dividend Equity ETF (US:SCHD) , Microsoft Corporation (US:MSFT) , JPMorgan Chase & Co. (US:JPM) , Apple Inc. (US:AAPL) , and Johnson & Johnson (US:JNJ) . Posisi baru Crescent Sterling, Ltd. meliputi: SPDR Series Trust - SPDR S&P Aerospace & Defense ETF (US:XAR) , .
Peningkatan Tertinggi Kuartal Ini
Kami menggunakan perubahan dalam alokasi portofolio karena ini adalah metrik yang paling bermakna. Perubahan dapat disebabkan oleh perdagangan atau perubahan harga saham.
| Keamanan | Saham (MM) |
Nilai (Juta Dolar AS) |
Portfolio % | ΔPorsyento ng Portfolio |
|---|---|---|---|---|
| 0.01 | 5.46 | 6.1132 | 1.5501 | |
| 0.02 | 4.55 | 5.0878 | 0.7174 | |
| 0.01 | 1.23 | 1.3742 | 0.4992 | |
| 0.00 | 1.12 | 1.2540 | 0.4916 | |
| 0.07 | 1.94 | 2.1747 | 0.4845 | |
| 0.00 | 2.54 | 2.8416 | 0.4509 | |
| 0.00 | 0.64 | 0.7156 | 0.4287 | |
| 0.04 | 3.02 | 3.3797 | 0.3432 | |
| 0.00 | 0.25 | 0.2842 | 0.2842 | |
| 0.00 | 0.23 | 0.2620 | 0.2620 |
Penurunan Tertinggi Kuartal Ini
Kami menggunakan perubahan dalam alokasi portofolio karena ini adalah metrik yang paling bermakna. Perubahan dapat disebabkan oleh perdagangan atau perubahan harga saham.
| Keamanan | Saham (MM) |
Nilai (Juta Dolar AS) |
Portfolio % | ΔPorsyento ng Portfolio |
|---|---|---|---|---|
| 0.02 | 2.07 | 2.3178 | -0.6957 | |
| 0.02 | 3.96 | 4.4319 | -0.6889 | |
| 0.04 | 1.07 | 1.1969 | -0.6530 | |
| 0.02 | 1.89 | 2.1117 | -0.6399 | |
| 0.00 | 0.46 | 0.5103 | -0.6097 | |
| 0.02 | 3.12 | 3.4864 | -0.6063 | |
| 0.02 | 2.90 | 3.2474 | -0.5298 | |
| 0.02 | 2.94 | 3.2856 | -0.4367 | |
| 0.01 | 2.50 | 2.7963 | -0.2351 | |
| 0.02 | 3.39 | 3.7966 | -0.2226 |
Pengajuan 13F dan Dana
Formulir ini diajukan pada 2025-08-04 untuk periode pelaporan 2025-06-30. Klik ikon tautan untuk melihat riwayat transaksi selengkapnya.
Tingkatkan ke versi premium untuk membuka data premium dan ekspor ke Excel. ![]() .
.
| Keamanan | Ketik | Harga Saham Rata-rata | Saham (MM) |
ΔSaham (%) |
ΔSaham (%) |
Nilai ($MM) |
Portpolyo (%) |
ΔPortofolio (%) |
|
|---|---|---|---|---|---|---|---|---|---|
| SCHD / Schwab Strategic Trust - Schwab U.S. Dividend Equity ETF | 0.24 | -1.13 | 6.40 | -6.30 | 7.1572 | 0.1571 | |||
| MSFT / Microsoft Corporation | 0.01 | -7.34 | 5.46 | 22.76 | 6.1132 | 1.5501 | |||
| JPM / JPMorgan Chase & Co. | 0.02 | -9.73 | 4.55 | 6.69 | 5.0878 | 0.7174 | |||
| AAPL / Apple Inc. | 0.02 | -14.13 | 3.96 | -20.69 | 4.4319 | -0.6889 | |||
| JNJ / Johnson & Johnson | 0.02 | -6.01 | 3.39 | -13.42 | 3.7966 | -0.2226 | |||
| CVX / Chevron Corporation | 0.02 | -8.79 | 3.12 | -21.95 | 3.4864 | -0.6063 | |||
| CSCO / Cisco Systems, Inc. | 0.04 | -9.27 | 3.02 | 1.99 | 3.3797 | 0.3432 | |||
| PG / The Procter & Gamble Company | 0.02 | -13.47 | 2.94 | -19.12 | 3.2856 | -0.4367 | |||
| HD / The Home Depot, Inc. | 0.01 | -4.28 | 2.93 | -4.22 | 3.2751 | 0.1404 | |||
| ABBV / AbbVie Inc. | 0.02 | -11.06 | 2.90 | -21.21 | 3.2474 | -0.5298 | |||
| MDY / SPDR S&P MidCap 400 ETF Trust | 0.00 | 2.59 | 2.54 | 8.92 | 2.8416 | 0.4509 | |||
| AMGN / Amgen Inc. | 0.01 | -5.67 | 2.50 | -15.46 | 2.7963 | -0.2351 | |||
| APD / Air Products and Chemicals, Inc. | 0.01 | -6.33 | 2.11 | -10.39 | 2.3556 | -0.0541 | |||
| PEP / PepsiCo, Inc. | 0.02 | -19.96 | 2.07 | -29.51 | 2.3178 | -0.6957 | |||
| SCHG / Schwab Strategic Trust - Schwab U.S. Large-Cap Growth ETF | 0.07 | 1.08 | 1.94 | 17.90 | 2.1747 | 0.4845 | |||
| XOM / Exxon Mobil Corporation | 0.02 | -22.40 | 1.89 | -29.67 | 2.1117 | -0.6399 | |||
| WMT / Walmart Inc. | 0.02 | -4.39 | 1.57 | 6.52 | 1.7546 | 0.2445 | |||
| PSX / Phillips 66 | 0.01 | -12.25 | 1.54 | -15.22 | 1.7274 | -0.1398 | |||
| HON / Honeywell International Inc. | 0.01 | -3.92 | 1.54 | 5.69 | 1.7257 | 0.2290 | |||
| QCOM / QUALCOMM Incorporated | 0.01 | -6.42 | 1.40 | -2.99 | 1.5615 | 0.0865 | |||
| ABT / Abbott Laboratories | 0.01 | 2.85 | 1.37 | 5.46 | 1.5355 | 0.2011 | |||
| SWK / Stanley Black & Decker, Inc. | 0.02 | -8.98 | 1.34 | -19.78 | 1.5018 | -0.2141 | |||
| VZ / Verizon Communications Inc. | 0.03 | -1.06 | 1.32 | -5.57 | 1.4803 | 0.0428 | |||
| NVDA / NVIDIA Corporation | 0.01 | -1.27 | 1.23 | 43.96 | 1.3742 | 0.4992 | |||
| INTU / Intuit Inc. | 0.00 | 17.51 | 1.12 | 50.74 | 1.2540 | 0.4916 | |||
| DOW / Dow Inc. | 0.04 | -21.81 | 1.07 | -40.74 | 1.1969 | -0.6530 | |||
| AMZN / Amazon.com, Inc. | 0.00 | -4.83 | 1.07 | 9.77 | 1.1940 | 0.1968 | |||
| SCHM / Schwab Strategic Trust - Schwab U.S. Mid-Cap ETF | 0.04 | -7.95 | 1.02 | -1.45 | 1.1451 | 0.0802 | |||
| SHEL / Shell plc - Depositary Receipt (Common Stock) | 0.01 | -3.43 | 1.00 | -7.26 | 1.1166 | 0.0138 | |||
| CMI / Cummins Inc. | 0.00 | -6.02 | 0.95 | -1.77 | 1.0590 | 0.0707 | |||
| CRM / Salesforce, Inc. | 0.00 | 9.26 | 0.92 | 11.02 | 1.0261 | 0.1791 | |||
| COST / Costco Wholesale Corporation | 0.00 | 0.99 | 0.91 | 5.72 | 1.0146 | 0.1350 | |||
| SCHA / Schwab Strategic Trust - Schwab U.S. Small-Cap ETF | 0.03 | -16.36 | 0.87 | -9.72 | 0.9776 | -0.0144 | |||
| VV / Vanguard Index Funds - Vanguard Large-Cap ETF | 0.00 | 0.00 | 0.86 | 10.89 | 0.9577 | 0.1670 | |||
| TXN / Texas Instruments Incorporated | 0.00 | -23.06 | 0.81 | -11.11 | 0.9044 | -0.0280 | |||
| DUK / Duke Energy Corporation | 0.01 | -1.93 | 0.75 | -5.19 | 0.8388 | 0.0286 | |||
| KMB / Kimberly-Clark Corporation | 0.01 | -5.28 | 0.74 | -14.09 | 0.8328 | -0.0560 | |||
| MA / Mastercard Incorporated | 0.00 | -22.69 | 0.73 | -20.81 | 0.8142 | -0.1272 | |||
| SCHF / Schwab Strategic Trust - Schwab International Equity ETF | 0.03 | -0.18 | 0.71 | 11.55 | 0.7894 | 0.1407 | |||
| PCAR / PACCAR Inc | 0.01 | -3.15 | 0.70 | -5.52 | 0.7861 | 0.0242 | |||
| ORCL / Oracle Corporation | 0.00 | 46.18 | 0.64 | 129.03 | 0.7156 | 0.4287 | |||
| SPYG / SPDR Series Trust - SPDR Portfolio S&P 500 Growth ETF | 0.01 | -21.89 | 0.62 | -7.45 | 0.6959 | 0.0074 | |||
| CB / Chubb Limited | 0.00 | 48.92 | 0.60 | 42.82 | 0.6691 | 0.2399 | |||
| LMT / Lockheed Martin Corporation | 0.00 | -2.38 | 0.59 | 1.37 | 0.6602 | 0.0624 | |||
| VIOG / Vanguard Admiral Funds - Vanguard S&P Small-Cap 600 Growth ETF | 0.00 | 22.15 | 0.50 | 30.89 | 0.5599 | 0.1675 | |||
| CSX / CSX Corporation | 0.01 | -1.99 | 0.48 | 8.56 | 0.5403 | 0.0846 | |||
| GIS / General Mills, Inc. | 0.01 | -25.40 | 0.47 | -35.39 | 0.5279 | -0.2205 | |||
| MRK / Merck & Co., Inc. | 0.01 | -9.28 | 0.46 | -20.00 | 0.5151 | -0.0750 | |||
| VLO / Valero Energy Corporation | 0.00 | -58.97 | 0.46 | -58.24 | 0.5103 | -0.6097 | |||
| KO / The Coca-Cola Company | 0.01 | -28.09 | 0.45 | -29.07 | 0.5034 | -0.1460 | |||
| WDIV / SPDR Index Shares Funds - SPDR S&P Global Dividend ETF | 0.01 | -17.37 | 0.45 | -10.44 | 0.4991 | -0.0118 | |||
| DD / DuPont de Nemours, Inc. | 0.01 | -16.84 | 0.45 | -23.67 | 0.4984 | -0.0996 | |||
| SPYV / SPDR Series Trust - SPDR Portfolio S&P 500 Value ETF | 0.01 | -16.01 | 0.44 | -13.95 | 0.4974 | -0.0322 | |||
| LLY / Eli Lilly and Company | 0.00 | 0.00 | 0.43 | -5.48 | 0.4823 | 0.0140 | |||
| LHX / L3Harris Technologies, Inc. | 0.00 | -5.52 | 0.43 | 13.23 | 0.4799 | 0.0914 | |||
| IQLT / iShares Trust - iShares MSCI Intl Quality Factor ETF | 0.01 | -7.44 | 0.42 | 0.72 | 0.4692 | 0.0426 | |||
| GPC / Genuine Parts Company | 0.00 | -1.24 | 0.39 | 0.78 | 0.4331 | 0.0384 | |||
| SIGI / Selective Insurance Group, Inc. | 0.00 | 1.46 | 0.36 | -4.00 | 0.4033 | 0.0185 | |||
| XLK / The Select Sector SPDR Trust - The Technology Select Sector SPDR Fund | 0.00 | 4.50 | 0.35 | 28.15 | 0.3882 | 0.1106 | |||
| RSPT / Invesco Exchange-Traded Fund Trust - Invesco S&P 500 Equal Weight Technology ETF | 0.01 | -13.61 | 0.32 | 3.26 | 0.3549 | 0.0392 | |||
| SLYV / SPDR Series Trust - SPDR S&P 600 Small Cap Value ETF | 0.00 | -18.84 | 0.31 | -17.51 | 0.3483 | -0.0383 | |||
| SLYG / SPDR Series Trust - SPDR S&P 600 Small Cap Growth ETF | 0.00 | -21.78 | 0.30 | -16.53 | 0.3342 | -0.0320 | |||
| BMY / Bristol-Myers Squibb Company | 0.01 | -10.01 | 0.29 | -31.63 | 0.3294 | -0.1126 | |||
| XMMO / Invesco Exchange-Traded Fund Trust - Invesco S&P MidCap Momentum ETF | 0.00 | 6.59 | 0.27 | 20.70 | 0.3074 | 0.0736 | |||
| XAR / SPDR Series Trust - SPDR S&P Aerospace & Defense ETF | 0.00 | 0.25 | 0.2842 | 0.2842 | |||||
| O / Realty Income Corporation | 0.00 | 6.82 | 0.25 | 5.96 | 0.2797 | 0.0380 | |||
| FNDF / Schwab Strategic Trust - Schwab Fundamental International Equity ETF | 0.01 | -17.38 | 0.25 | -8.49 | 0.2778 | -0.0005 | |||
| ARM / Arm Holdings plc - Depositary Receipt (Common Stock) | 0.00 | 0.23 | 0.2620 | 0.2620 | |||||
| SCHX / Schwab Strategic Trust - Schwab U.S. Large-Cap ETF | 0.01 | 0.22 | 0.2480 | 0.2480 | |||||
| DIS / The Walt Disney Company | 0.00 | 0.22 | 0.2476 | 0.2476 | |||||
| UNP / Union Pacific Corporation | 0.00 | 0.21 | 0.2312 | 0.2312 | |||||
| QIPT / Quipt Home Medical Corp. | 0.01 | 0.00 | 0.02 | -26.09 | 0.0200 | -0.0039 | |||
| BDX / Becton, Dickinson and Company | 0.00 | -100.00 | 0.00 | 0.0000 | |||||
| MMM / 3M Company | 0.00 | -100.00 | 0.00 | 0.0000 | |||||
| REGN / Regeneron Pharmaceuticals, Inc. | 0.00 | -100.00 | 0.00 | 0.0000 | |||||
| QQQ / Invesco QQQ Trust, Series 1 | 0.00 | -100.00 | 0.00 | 0.0000 | |||||
| RSPH / Invesco Exchange-Traded Fund Trust - Invesco S&P 500 Equal Weight Health Care ETF | 0.00 | -100.00 | 0.00 | 0.0000 | |||||
| CTVA / Corteva, Inc. | 0.00 | -100.00 | 0.00 | 0.0000 | |||||
| SPY / SPDR S&P 500 ETF | 0.00 | -100.00 | 0.00 | 0.0000 | |||||
| MCD / McDonald's Corporation | 0.00 | -100.00 | 0.00 | 0.0000 |