Mga Batayang Estadistika
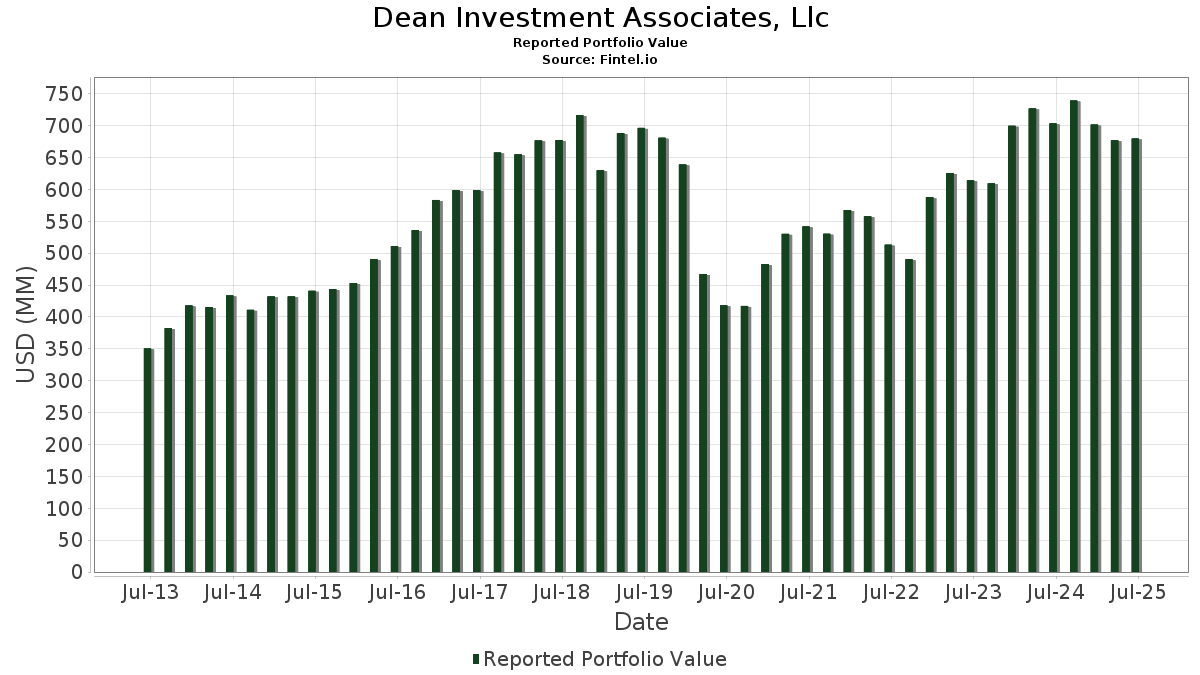
| Nilai Portofolio | $ 679,804,723 |
| Posisi Saat Ini | 204 |
Kepemilikan Terbaru, Kinerja, AUM (dari 13F, 13D)
Dean Investment Associates, Llc telah mengungkapkan total kepemilikan 204 dalam pengajuan SEC terbaru mereka. Nilai portofolio terbaru dihitung sebesar $ 679,804,723 USD. Aset yang Dikelola (AUM) sebenarnya adalah nilai ini ditambah kas (yang tidak diungkapkan). Aset-aset utama Dean Investment Associates, Llc adalah JPMorgan Chase & Co. (US:JPM) , Altria Group, Inc. (US:MO) , Johnson & Johnson (US:JNJ) , SPDR Series Trust - SPDR Bloomberg Investment Grade Floating Rate ETF (US:FLRN) , and Chevron Corporation (US:CVX) . Posisi baru Dean Investment Associates, Llc meliputi: YETI Holdings, Inc. (US:YETI) , Atkore Inc. (US:ATKR) , Quaker Chemical Corporation (US:KWR) , .
Peningkatan Tertinggi Kuartal Ini
Kami menggunakan perubahan dalam alokasi portofolio karena ini adalah metrik yang paling bermakna. Perubahan dapat disebabkan oleh perdagangan atau perubahan harga saham.
| Keamanan | Saham (MM) |
Nilai (Juta Dolar AS) |
Portfolio % | ΔPorsyento ng Portfolio |
|---|---|---|---|---|
| 0.03 | 7.66 | 1.1265 | 0.7031 | |
| 0.09 | 3.89 | 0.5716 | 0.5716 | |
| 0.15 | 3.62 | 0.5319 | 0.5319 | |
| 0.10 | 3.00 | 0.4417 | 0.4417 | |
| 0.04 | 2.95 | 0.4340 | 0.4340 | |
| 0.02 | 2.86 | 0.4201 | 0.4201 | |
| 0.04 | 2.99 | 0.4401 | 0.3879 | |
| 0.08 | 5.56 | 0.8185 | 0.3840 | |
| 0.06 | 5.82 | 0.8556 | 0.3321 | |
| 0.03 | 2.13 | 0.3126 | 0.3126 |
Penurunan Tertinggi Kuartal Ini
Kami menggunakan perubahan dalam alokasi portofolio karena ini adalah metrik yang paling bermakna. Perubahan dapat disebabkan oleh perdagangan atau perubahan harga saham.
| Keamanan | Saham (MM) |
Nilai (Juta Dolar AS) |
Portfolio % | ΔPorsyento ng Portfolio |
|---|---|---|---|---|
| 0.00 | 0.22 | 0.0316 | -0.5590 | |
| 0.09 | 5.18 | 0.7625 | -0.5097 | |
| 0.03 | 2.11 | 0.3108 | -0.4405 | |
| 0.07 | 7.51 | 1.1048 | -0.4164 | |
| 0.03 | 4.32 | 0.6361 | -0.4089 | |
| 0.03 | 1.61 | 0.2371 | -0.3951 | |
| 0.02 | 0.55 | 0.0803 | -0.3678 | |
| 0.03 | 1.27 | 0.1872 | -0.3161 | |
| 0.05 | 2.95 | 0.4346 | -0.2867 | |
| 0.02 | 0.46 | 0.0670 | -0.2436 |
Pengajuan 13F dan Dana
Formulir ini diajukan pada 2025-08-12 untuk periode pelaporan 2025-06-30. Klik ikon tautan untuk melihat riwayat transaksi selengkapnya.
Tingkatkan ke versi premium untuk membuka data premium dan ekspor ke Excel. ![]() .
.
| Keamanan | Ketik | Harga Saham Rata-rata | Saham (MM) |
ΔSaham (%) |
ΔSaham (%) |
Nilai ($MM) |
Portpolyo (%) |
ΔPortofolio (%) |
|
|---|---|---|---|---|---|---|---|---|---|
| JPM / JPMorgan Chase & Co. | 0.04 | 1.46 | 10.60 | 19.92 | 1.5588 | 0.2534 | |||
| MO / Altria Group, Inc. | 0.17 | 1.62 | 9.74 | -0.73 | 1.4321 | -0.0166 | |||
| JNJ / Johnson & Johnson | 0.06 | 1.60 | 8.98 | -6.43 | 1.3214 | -0.0965 | |||
| FLRN / SPDR Series Trust - SPDR Bloomberg Investment Grade Floating Rate ETF | 0.29 | 2.00 | 8.90 | 2.03 | 1.3092 | 0.0207 | |||
| CVX / Chevron Corporation | 0.06 | 1.51 | 8.84 | -13.12 | 1.3008 | -0.2026 | |||
| XEL / Xcel Energy Inc. | 0.13 | -1.68 | 8.82 | -5.43 | 1.2976 | -0.0801 | |||
| PEP / PepsiCo, Inc. | 0.06 | 35.70 | 8.41 | 19.51 | 1.2375 | 0.1976 | |||
| LFUS / Littelfuse, Inc. | 0.03 | 131.83 | 7.66 | 167.20 | 1.1265 | 0.7031 | |||
| WEC / WEC Energy Group, Inc. | 0.07 | -23.72 | 7.51 | -27.07 | 1.1048 | -0.4164 | |||
| VZ / Verizon Communications Inc. | 0.17 | 1.41 | 7.45 | -3.27 | 1.0954 | -0.0417 | |||
| BK / The Bank of New York Mellon Corporation | 0.08 | -4.08 | 6.94 | 4.21 | 1.0205 | 0.0371 | |||
| EOG / EOG Resources, Inc. | 0.06 | 2.21 | 6.88 | -4.67 | 1.0123 | -0.0540 | |||
| BLK / BlackRock, Inc. | 0.01 | 1.59 | 6.77 | 12.62 | 0.9953 | 0.1079 | |||
| PNC / The PNC Financial Services Group, Inc. | 0.04 | 1.24 | 6.71 | 7.38 | 0.9869 | 0.0639 | |||
| DUK / Duke Energy Corporation | 0.06 | 0.99 | 6.52 | -2.29 | 0.9597 | -0.0266 | |||
| FAST / Fastenal Company | 0.15 | 104.07 | 6.35 | 10.53 | 0.9344 | 0.0854 | |||
| CSCO / Cisco Systems, Inc. | 0.09 | -12.43 | 6.34 | -1.54 | 0.9322 | -0.0186 | |||
| SCHO / Schwab Strategic Trust - Schwab Short-Term U.S. Treasury ETF | 0.26 | -8.49 | 6.25 | -8.33 | 0.9189 | -0.0878 | |||
| DLR / Digital Realty Trust, Inc. | 0.04 | 1.51 | 6.24 | 23.50 | 0.9175 | 0.1715 | |||
| TXN / Texas Instruments Incorporated | 0.03 | 1.31 | 6.23 | 17.04 | 0.9164 | 0.1302 | |||
| LHX / L3Harris Technologies, Inc. | 0.02 | 6.39 | 6.20 | 27.51 | 0.9124 | 0.1938 | |||
| DOX / Amdocs Limited | 0.06 | 64.60 | 5.82 | 64.15 | 0.8556 | 0.3321 | |||
| DG / Dollar General Corporation | 0.05 | 3.96 | 5.73 | 35.24 | 0.8423 | 0.2169 | |||
| EHC / Encompass Health Corporation | 0.05 | -15.38 | 5.68 | 2.47 | 0.8355 | 0.0166 | |||
| UNP / Union Pacific Corporation | 0.02 | 54.56 | 5.65 | 50.53 | 0.8309 | 0.2766 | |||
| HSY / The Hershey Company | 0.03 | 1.40 | 5.62 | -1.59 | 0.8261 | -0.0170 | |||
| LAMR / Lamar Advertising Company | 0.05 | 2.16 | 5.59 | 8.96 | 0.8230 | 0.0645 | |||
| OMC / Omnicom Group Inc. | 0.08 | 118.03 | 5.56 | 89.19 | 0.8185 | 0.3840 | |||
| AZO / AutoZone, Inc. | 0.00 | -5.42 | 5.44 | -7.91 | 0.8000 | -0.0724 | |||
| VSH / Vishay Intertechnology, Inc. | 0.34 | 34.48 | 5.33 | 34.30 | 0.7845 | 0.1980 | |||
| LNT / Alliant Energy Corporation | 0.09 | -35.95 | 5.18 | -39.82 | 0.7625 | -0.5097 | |||
| PB / Prosperity Bancshares, Inc. | 0.07 | 3.76 | 5.10 | 2.12 | 0.7496 | 0.0125 | |||
| BELFB / Bel Fuse Inc. | 0.05 | 7.48 | 5.09 | 40.26 | 0.7489 | 0.2127 | |||
| ALG / Alamo Group Inc. | 0.02 | -16.18 | 5.04 | 2.73 | 0.7420 | 0.0166 | |||
| AEIS / Advanced Energy Industries, Inc. | 0.04 | -23.85 | 5.04 | 5.86 | 0.7420 | 0.0382 | |||
| KMI / Kinder Morgan, Inc. | 0.17 | 0.88 | 5.01 | 3.96 | 0.7375 | 0.0251 | |||
| AMGN / Amgen Inc. | 0.02 | 30.92 | 4.98 | 17.33 | 0.7319 | 0.1055 | |||
| HD / The Home Depot, Inc. | 0.01 | 2.21 | 4.90 | 2.26 | 0.7202 | 0.0129 | |||
| ESS / Essex Property Trust, Inc. | 0.02 | 3.50 | 4.80 | -4.33 | 0.7061 | -0.0350 | |||
| ESE / ESCO Technologies Inc. | 0.02 | 0.68 | 4.79 | 21.41 | 0.7041 | 0.1217 | |||
| TROW / T. Rowe Price Group, Inc. | 0.05 | 2.12 | 4.76 | 7.26 | 0.6996 | 0.0446 | |||
| AEP / American Electric Power Company, Inc. | 0.04 | 2.11 | 4.53 | -3.04 | 0.6664 | -0.0238 | |||
| ITW / Illinois Tool Works Inc. | 0.02 | 83.66 | 4.50 | 83.08 | 0.6624 | 0.2991 | |||
| PAYX / Paychex, Inc. | 0.03 | 31.89 | 4.50 | 24.36 | 0.6623 | 0.1275 | |||
| PRU / Prudential Financial, Inc. | 0.04 | 2.07 | 4.48 | -1.80 | 0.6596 | -0.0149 | |||
| MCHP / Microchip Technology Incorporated | 0.06 | 22.64 | 4.47 | 78.25 | 0.6572 | 0.2870 | |||
| RRX / Regal Rexnord Corporation | 0.03 | 25.52 | 4.44 | 59.83 | 0.6533 | 0.2428 | |||
| AEE / Ameren Corporation | 0.05 | 5.07 | 4.40 | 0.50 | 0.6480 | 0.0006 | |||
| APD / Air Products and Chemicals, Inc. | 0.02 | 2.16 | 4.38 | -2.30 | 0.6447 | -0.0179 | |||
| WRB / W. R. Berkley Corporation | 0.06 | 5.08 | 4.33 | 8.47 | 0.6371 | 0.0474 | |||
| IFF / International Flavors & Fragrances Inc. | 0.06 | 8.01 | 4.33 | 2.34 | 0.6368 | 0.0121 | |||
| KMB / Kimberly-Clark Corporation | 0.03 | -32.57 | 4.32 | -38.87 | 0.6361 | -0.4089 | |||
| MDLZ / Mondelez International, Inc. | 0.06 | 2.95 | 4.27 | 2.32 | 0.6287 | 0.0117 | |||
| PSA / Public Storage | 0.01 | 0.81 | 4.26 | -1.16 | 0.6268 | -0.0101 | |||
| SSNC / SS&C Technologies Holdings, Inc. | 0.05 | 4.75 | 4.24 | 3.84 | 0.6241 | 0.0205 | |||
| AMT / American Tower Corporation | 0.02 | 1.53 | 4.20 | 3.14 | 0.6178 | 0.0162 | |||
| PFG / Principal Financial Group, Inc. | 0.05 | 1.86 | 4.11 | -4.10 | 0.6051 | -0.0286 | |||
| PPG / PPG Industries, Inc. | 0.04 | 15.72 | 4.07 | 20.39 | 0.5985 | 0.0992 | |||
| KNX / Knight-Swift Transportation Holdings Inc. | 0.09 | 22.36 | 4.05 | 24.46 | 0.5958 | 0.1150 | |||
| ARW / Arrow Electronics, Inc. | 0.03 | 4.55 | 4.04 | 28.29 | 0.5938 | 0.1291 | |||
| HIG / The Hartford Insurance Group, Inc. | 0.03 | 5.07 | 4.02 | 7.74 | 0.5915 | 0.0402 | |||
| JAZZ / Jazz Pharmaceuticals plc | 0.04 | 23.61 | 3.99 | 5.67 | 0.5868 | 0.0291 | |||
| DGX / Quest Diagnostics Incorporated | 0.02 | 5.07 | 3.98 | 11.53 | 0.5861 | 0.0585 | |||
| AMP / Ameriprise Financial, Inc. | 0.01 | 4.59 | 3.95 | 15.31 | 0.5818 | 0.0751 | |||
| AIZ / Assurant, Inc. | 0.02 | 5.07 | 3.94 | -1.08 | 0.5803 | -0.0087 | |||
| RGA / Reinsurance Group of America, Incorporated | 0.02 | 17.23 | 3.93 | 18.10 | 0.5787 | 0.0866 | |||
| SMP / Standard Motor Products, Inc. | 0.13 | -1.20 | 3.93 | 21.75 | 0.5782 | 0.1013 | |||
| WHD / Cactus, Inc. | 0.09 | 3.89 | 0.5716 | 0.5716 | |||||
| MOH / Molina Healthcare, Inc. | 0.01 | -3.39 | 3.85 | -12.62 | 0.5663 | -0.0845 | |||
| LAD / Lithia Motors, Inc. | 0.01 | 16.77 | 3.84 | 34.38 | 0.5647 | 0.1427 | |||
| CMCSA / Comcast Corporation | 0.11 | 2.38 | 3.82 | -0.98 | 0.5621 | -0.0079 | |||
| DOV / Dover Corporation | 0.02 | 5.07 | 3.81 | 9.60 | 0.5608 | 0.0469 | |||
| ATO / Atmos Energy Corporation | 0.02 | 3.96 | 3.80 | 3.66 | 0.5589 | 0.0174 | |||
| GTES / Gates Industrial Corporation plc | 0.16 | 24.85 | 3.77 | 56.21 | 0.5552 | 0.1982 | |||
| SYY / Sysco Corporation | 0.05 | 101.19 | 3.76 | 103.08 | 0.5533 | 0.2797 | |||
| TTWO / Take-Two Interactive Software, Inc. | 0.02 | 5.07 | 3.71 | 23.13 | 0.5459 | 0.1007 | |||
| BWA / BorgWarner Inc. | 0.11 | 5.07 | 3.68 | 22.80 | 0.5413 | 0.0986 | |||
| AVY / Avery Dennison Corporation | 0.02 | 22.05 | 3.65 | 20.32 | 0.5367 | 0.0888 | |||
| SHOO / Steven Madden, Ltd. | 0.15 | 3.62 | 0.5319 | 0.5319 | |||||
| OGE / OGE Energy Corp. | 0.08 | 4.74 | 3.61 | 1.12 | 0.5313 | 0.0038 | |||
| WERN / Werner Enterprises, Inc. | 0.13 | 12.35 | 3.60 | 4.89 | 0.5303 | 0.0227 | |||
| USFD / US Foods Holding Corp. | 0.05 | 4.86 | 3.60 | 23.37 | 0.5289 | 0.0984 | |||
| INDB / Independent Bank Corp. | 0.06 | -5.91 | 3.56 | -5.56 | 0.5243 | -0.0332 | |||
| REG / Regency Centers Corporation | 0.05 | 14.59 | 3.56 | 10.66 | 0.5238 | 0.0485 | |||
| HP / Helmerich & Payne, Inc. | 0.23 | 43.13 | 3.51 | -16.93 | 0.5168 | -0.1079 | |||
| INVX / Innovex International, Inc. | 0.22 | 4.20 | 3.50 | -9.39 | 0.5142 | -0.0556 | |||
| CNP / CenterPoint Energy, Inc. | 0.10 | -20.86 | 3.49 | -19.75 | 0.5135 | -0.1290 | |||
| LMT / Lockheed Martin Corporation | 0.01 | 47.45 | 3.44 | 52.84 | 0.5060 | 0.1736 | |||
| RF / Regions Financial Corporation | 0.14 | 4.88 | 3.41 | 13.52 | 0.5015 | 0.0579 | |||
| AVB / AvalonBay Communities, Inc. | 0.02 | 15.84 | 3.39 | 9.85 | 0.4988 | 0.0428 | |||
| ITT / ITT Inc. | 0.02 | 5.08 | 3.39 | 27.59 | 0.4987 | 0.1062 | |||
| PZZA / Papa John's International, Inc. | 0.07 | -21.53 | 3.39 | -6.51 | 0.4984 | -0.0369 | |||
| PR / Permian Resources Corporation | 0.25 | 17.20 | 3.39 | 15.24 | 0.4984 | 0.0642 | |||
| ASTE / Astec Industries, Inc. | 0.08 | 33.47 | 3.38 | 61.47 | 0.4971 | 0.1880 | |||
| RJF / Raymond James Financial, Inc. | 0.02 | 5.07 | 3.36 | 16.00 | 0.4939 | 0.0664 | |||
| CTRA / Coterra Energy Inc. | 0.13 | 38.47 | 3.34 | 21.60 | 0.4919 | 0.0857 | |||
| BR / Broadridge Financial Solutions, Inc. | 0.01 | 5.07 | 3.28 | 5.30 | 0.4826 | 0.0225 | |||
| SRCE / 1st Source Corporation | 0.05 | -14.51 | 3.26 | -11.28 | 0.4792 | -0.0632 | |||
| AGCO / AGCO Corporation | 0.03 | 5.07 | 3.25 | 17.09 | 0.4788 | 0.0682 | |||
| CBRE / CBRE Group, Inc. | 0.02 | 5.08 | 3.24 | 12.61 | 0.4768 | 0.0515 | |||
| THFF / First Financial Corporation | 0.06 | -2.91 | 3.21 | 7.42 | 0.4728 | 0.0308 | |||
| LKQ / LKQ Corporation | 0.09 | 2.07 | 3.20 | -11.19 | 0.4707 | -0.0616 | |||
| CAG / Conagra Brands, Inc. | 0.15 | 5.07 | 3.16 | -19.35 | 0.4649 | -0.1140 | |||
| STAG / STAG Industrial, Inc. | 0.09 | 4.81 | 3.12 | 5.26 | 0.4589 | 0.0212 | |||
| RUSHA / Rush Enterprises, Inc. | 0.06 | 3.08 | 3.12 | -0.57 | 0.4588 | -0.0046 | |||
| CM / Canadian Imperial Bank of Commerce | 0.04 | 2.45 | 3.11 | 28.89 | 0.4575 | 0.1011 | |||
| RSG / Republic Services, Inc. | 0.01 | -13.12 | 3.09 | -11.52 | 0.4544 | -0.0613 | |||
| BJ / BJ's Wholesale Club Holdings, Inc. | 0.03 | -19.41 | 3.09 | -23.85 | 0.4542 | -0.1447 | |||
| WY / Weyerhaeuser Company | 0.12 | 23.97 | 3.08 | 8.74 | 0.4538 | 0.0348 | |||
| WKC / World Kinect Corporation | 0.11 | -17.21 | 3.05 | -17.24 | 0.4493 | -0.0958 | |||
| YETI / YETI Holdings, Inc. | 0.10 | 3.00 | 0.4417 | 0.4417 | |||||
| NEE / NextEra Energy, Inc. | 0.04 | 764.69 | 2.99 | 747.31 | 0.4401 | 0.3879 | |||
| HAS / Hasbro, Inc. | 0.04 | 5.07 | 2.98 | 26.13 | 0.4381 | 0.0893 | |||
| CSGS / CSG Systems International, Inc. | 0.05 | -43.98 | 2.95 | -39.49 | 0.4346 | -0.2867 | |||
| EMN / Eastman Chemical Company | 0.04 | 2.95 | 0.4340 | 0.4340 | |||||
| CRI / Carter's, Inc. | 0.10 | 25.95 | 2.94 | -7.22 | 0.4329 | -0.0356 | |||
| ZBH / Zimmer Biomet Holdings, Inc. | 0.03 | 4.57 | 2.94 | -15.74 | 0.4323 | -0.0828 | |||
| CATY / Cathay General Bancorp | 0.06 | 9.07 | 2.93 | 15.37 | 0.4307 | 0.0559 | |||
| PFE / Pfizer Inc. | 0.12 | 2.62 | 2.91 | -1.82 | 0.4277 | -0.0098 | |||
| JOUT / Johnson Outdoors Inc. | 0.10 | 6.18 | 2.90 | 29.39 | 0.4262 | 0.0954 | |||
| PLOW / Douglas Dynamics, Inc. | 0.10 | 0.16 | 2.88 | 27.10 | 0.4230 | 0.0887 | |||
| MRK / Merck & Co., Inc. | 0.04 | 1.63 | 2.86 | -10.38 | 0.4207 | -0.0506 | |||
| WCC / WESCO International, Inc. | 0.02 | 2.86 | 0.4201 | 0.4201 | |||||
| PHM / PulteGroup, Inc. | 0.03 | 20.55 | 2.85 | 23.64 | 0.4186 | 0.0787 | |||
| BKR / Baker Hughes Company | 0.07 | 5.08 | 2.81 | -8.34 | 0.4139 | -0.0395 | |||
| PRG / PROG Holdings, Inc. | 0.09 | 60.52 | 2.79 | 77.06 | 0.4101 | 0.1776 | |||
| HCKT / The Hackett Group, Inc. | 0.11 | -22.99 | 2.72 | -33.00 | 0.3996 | -0.1994 | |||
| PRGO / Perrigo Company plc | 0.10 | 33.46 | 2.67 | 27.19 | 0.3922 | 0.0825 | |||
| BNL / Broadstone Net Lease, Inc. | 0.16 | -30.72 | 2.64 | -34.75 | 0.3879 | -0.2090 | |||
| GPN / Global Payments Inc. | 0.03 | 5.06 | 2.62 | -14.11 | 0.3859 | -0.0653 | |||
| QCRH / QCR Holdings, Inc. | 0.04 | -15.12 | 2.62 | -19.20 | 0.3858 | -0.0936 | |||
| CPB / The Campbell's Company | 0.09 | 26.56 | 2.61 | -2.83 | 0.3844 | -0.0129 | |||
| VRRM / Verra Mobility Corporation | 0.10 | 153.79 | 2.60 | 186.45 | 0.3827 | 0.2485 | |||
| KMT / Kennametal Inc. | 0.11 | 107.14 | 2.60 | 123.37 | 0.3826 | 0.2105 | |||
| SON / Sonoco Products Company | 0.06 | 1.95 | 2.53 | -6.01 | 0.3727 | -0.0254 | |||
| SCL / Stepan Company | 0.05 | 116.26 | 2.47 | 114.50 | 0.3635 | 0.1933 | |||
| HTLD / Heartland Express, Inc. | 0.28 | 7.46 | 2.45 | 0.70 | 0.3600 | 0.0010 | |||
| COLM / Columbia Sportswear Company | 0.04 | 11.94 | 2.42 | -9.69 | 0.3566 | -0.0398 | |||
| BMY / Bristol-Myers Squibb Company | 0.05 | 2.06 | 2.39 | -22.52 | 0.3522 | -0.1044 | |||
| SKX / Skechers U.S.A., Inc. | 0.04 | 5.07 | 2.36 | 16.80 | 0.3478 | 0.0487 | |||
| BRK.B / Berkshire Hathaway Inc. | 0.00 | -1.29 | 2.35 | -9.97 | 0.3454 | -0.0398 | |||
| GSBC / Great Southern Bancorp, Inc. | 0.04 | -4.12 | 2.31 | 1.76 | 0.3400 | 0.0046 | |||
| COHU / Cohu, Inc. | 0.11 | 124.64 | 2.15 | 193.98 | 0.3161 | 0.2081 | |||
| ATKR / Atkore Inc. | 0.03 | 2.13 | 0.3126 | 0.3126 | |||||
| MMS / Maximus, Inc. | 0.03 | -59.65 | 2.11 | -58.47 | 0.3108 | -0.4405 | |||
| STBA / S&T Bancorp, Inc. | 0.05 | -13.28 | 2.06 | -11.48 | 0.3030 | -0.0407 | |||
| WGO / Winnebago Industries, Inc. | 0.07 | 226.41 | 2.04 | 174.76 | 0.2996 | 0.1900 | |||
| VIAV / Viavi Solutions Inc. | 0.20 | -6.37 | 2.03 | -15.75 | 0.2984 | -0.0572 | |||
| HLIT / Harmonic Inc. | 0.21 | 3.10 | 2.01 | 1.82 | 0.2958 | 0.0040 | |||
| CAC / Camden National Corporation | 0.05 | -27.69 | 1.93 | -27.50 | 0.2835 | -0.1091 | |||
| HUN / Huntsman Corporation | 0.18 | 247.06 | 1.92 | 129.20 | 0.2830 | 0.1589 | |||
| MBUU / Malibu Boats, Inc. | 0.06 | 61.27 | 1.88 | 64.80 | 0.2769 | 0.1081 | |||
| TGNA / TEGNA Inc. | 0.10 | -18.24 | 1.68 | -24.80 | 0.2472 | -0.0829 | |||
| HCSG / Healthcare Services Group, Inc. | 0.11 | 20.88 | 1.68 | 80.41 | 0.2465 | 0.1092 | |||
| KWR / Quaker Chemical Corporation | 0.01 | 1.65 | 0.2434 | 0.2434 | |||||
| SLGN / Silgan Holdings Inc. | 0.03 | -64.46 | 1.61 | -62.35 | 0.2371 | -0.3951 | |||
| LIN / Linde plc | 0.00 | -1.07 | 1.61 | -0.31 | 0.2371 | -0.0017 | |||
| MUB / iShares Trust - iShares National Muni Bond ETF | 0.02 | 0.00 | 1.59 | -0.94 | 0.2334 | -0.0031 | |||
| PJT / PJT Partners Inc. | 0.01 | -1.03 | 1.53 | 18.48 | 0.2254 | 0.0343 | |||
| MTX / Minerals Technologies Inc. | 0.03 | -20.33 | 1.49 | -30.99 | 0.2199 | -0.1000 | |||
| OEC / Orion S.A. | 0.14 | 118.54 | 1.49 | 77.35 | 0.2190 | 0.0950 | |||
| FHI / Federated Hermes, Inc. | 0.03 | -7.59 | 1.46 | 0.41 | 0.2144 | 0.0001 | |||
| BRC / Brady Corporation | 0.02 | 15.23 | 1.46 | 10.90 | 0.2141 | 0.0202 | |||
| CNMD / CONMED Corporation | 0.03 | -33.08 | 1.45 | -42.31 | 0.2136 | -0.1580 | |||
| MSFT / Microsoft Corporation | 0.00 | -0.63 | 1.40 | 31.77 | 0.2063 | 0.0490 | |||
| CMCO / Columbus McKinnon Corporation | 0.09 | -24.24 | 1.40 | -31.67 | 0.2057 | -0.0966 | |||
| IUSV / iShares Trust - iShares Core S&P U.S. Value ETF | 0.01 | 0.00 | 1.40 | 2.57 | 0.2054 | 0.0042 | |||
| DHIL / Diamond Hill Investment Group, Inc. | 0.01 | -34.18 | 1.40 | -33.05 | 0.2054 | -0.1027 | |||
| DCI / Donaldson Company, Inc. | 0.02 | 11.28 | 1.37 | 15.14 | 0.2014 | 0.0257 | |||
| SAFT / Safety Insurance Group, Inc. | 0.02 | -44.26 | 1.30 | -43.91 | 0.1919 | -0.1516 | |||
| MCK / McKesson Corporation | 0.00 | -15.72 | 1.28 | -8.24 | 0.1884 | -0.0178 | |||
| EIG / Employers Holdings, Inc. | 0.03 | -59.91 | 1.27 | -62.67 | 0.1872 | -0.3161 | |||
| MKSI / MKS Inc. | 0.01 | 1.26 | 0.1859 | 0.1859 | |||||
| FI / Fiserv, Inc. | 0.01 | 8.49 | 1.20 | -15.29 | 0.1769 | -0.0328 | |||
| LEG / Leggett & Platt, Incorporated | 0.13 | -19.51 | 1.16 | -9.23 | 0.1708 | -0.0182 | |||
| JBSS / John B. Sanfilippo & Son, Inc. | 0.02 | -55.12 | 1.06 | -59.96 | 0.1564 | -0.2358 | |||
| HSIC / Henry Schein, Inc. | 0.01 | 20.32 | 1.06 | 28.42 | 0.1562 | 0.0340 | |||
| AVGO / Broadcom Inc. | 0.00 | 0.00 | 0.94 | 64.74 | 0.1383 | 0.0539 | |||
| KEYS / Keysight Technologies, Inc. | 0.01 | 0.94 | 0.1376 | 0.1376 | |||||
| UNH / UnitedHealth Group Incorporated | 0.00 | 0.93 | 0.1370 | 0.1370 | |||||
| SHYD / VanEck ETF Trust - VanEck Short High Yield Muni ETF | 0.04 | 0.00 | 0.93 | 0.43 | 0.1362 | 0.0000 | |||
| AFL / Aflac Incorporated | 0.01 | -0.80 | 0.85 | -6.00 | 0.1246 | -0.0084 | |||
| CUZ / Cousins Properties Incorporated | 0.03 | -49.94 | 0.83 | -49.05 | 0.1224 | -0.1188 | |||
| LOW / Lowe's Companies, Inc. | 0.00 | -0.96 | 0.83 | -5.82 | 0.1216 | -0.0080 | |||
| FULT / Fulton Financial Corporation | 0.05 | -54.33 | 0.82 | -54.45 | 0.1211 | -0.1459 | |||
| UHS / Universal Health Services, Inc. | 0.00 | -0.68 | 0.81 | -4.24 | 0.1198 | -0.0058 | |||
| SUB / iShares Trust - iShares Short-Term National Muni Bond ETF | 0.01 | 0.00 | 0.71 | 0.71 | 0.1040 | 0.0003 | |||
| SWK / Stanley Black & Decker, Inc. | 0.01 | -0.96 | 0.69 | -12.75 | 0.1018 | -0.0153 | |||
| LLY / Eli Lilly and Company | 0.00 | 0.00 | 0.68 | -5.57 | 0.0998 | -0.0064 | |||
| ROST / Ross Stores, Inc. | 0.01 | 24.34 | 0.66 | 24.20 | 0.0967 | 0.0185 | |||
| GTY / Getty Realty Corp. | 0.02 | -79.69 | 0.55 | -82.00 | 0.0803 | -0.3678 | |||
| MHK / Mohawk Industries, Inc. | 0.00 | -2.53 | 0.51 | -10.49 | 0.0754 | -0.0092 | |||
| SPB / Spectrum Brands Holdings, Inc. | 0.01 | -53.67 | 0.50 | -65.70 | 0.0735 | -0.1415 | |||
| PM / Philip Morris International Inc. | 0.00 | 0.00 | 0.47 | 14.74 | 0.0688 | 0.0086 | |||
| SFNC / Simmons First National Corporation | 0.02 | -76.54 | 0.46 | -78.35 | 0.0670 | -0.2436 | |||
| CMI / Cummins Inc. | 0.00 | -0.55 | 0.41 | 4.05 | 0.0605 | 0.0020 | |||
| FC / Franklin Covey Co. | 0.02 | -59.44 | 0.38 | -66.49 | 0.0552 | -0.1102 | |||
| EMR / Emerson Electric Co. | 0.00 | -0.85 | 0.34 | 20.57 | 0.0501 | 0.0084 | |||
| MET / MetLife, Inc. | 0.00 | -0.68 | 0.34 | -0.59 | 0.0500 | -0.0005 | |||
| GOOGL / Alphabet Inc. | 0.00 | 30.51 | 0.30 | 49.02 | 0.0448 | 0.0146 | |||
| ELV / Elevance Health, Inc. | 0.00 | 19.81 | 0.29 | 7.30 | 0.0433 | 0.0027 | |||
| V / Visa Inc. | 0.00 | -1.66 | 0.23 | -0.43 | 0.0341 | -0.0003 | |||
| RPM / RPM International Inc. | 0.00 | 0.23 | 0.0339 | 0.0339 | |||||
| UPS / United Parcel Service, Inc. | 0.00 | -94.14 | 0.22 | -94.62 | 0.0316 | -0.5590 | |||
| CHD / Church & Dwight Co., Inc. | 0.00 | -100.00 | 0.00 | 0.0000 | |||||
| NWN / Northwest Natural Holding Company | 0.00 | -100.00 | 0.00 | 0.0000 | |||||
| ATSG / Air Transport Services Group, Inc. | 0.00 | -100.00 | 0.00 | 0.0000 | |||||
| AWR / American States Water Company | 0.00 | -100.00 | 0.00 | 0.0000 | |||||
| YUMC / Yum China Holdings, Inc. | 0.00 | -100.00 | 0.00 | 0.0000 | |||||
| AVA / Avista Corporation | 0.00 | -100.00 | 0.00 | 0.0000 | |||||
| FDP / Fresh Del Monte Produce Inc. | 0.00 | -100.00 | 0.00 | 0.0000 | |||||
| OGS / ONE Gas, Inc. | 0.00 | -100.00 | 0.00 | 0.0000 | |||||
| SAM / The Boston Beer Company, Inc. | 0.00 | -100.00 | 0.00 | 0.0000 | |||||
| SR / Spire Inc. | 0.00 | -100.00 | 0.00 | 0.0000 | |||||
| BCE / BCE Inc. | 0.00 | -100.00 | 0.00 | 0.0000 | |||||
| FLO / Flowers Foods, Inc. | 0.00 | -100.00 | 0.00 | 0.0000 | |||||
| FDS / FactSet Research Systems Inc. | 0.00 | -100.00 | 0.00 | 0.0000 | |||||
| NWE / NorthWestern Energy Group, Inc. | 0.00 | -100.00 | 0.00 | 0.0000 | |||||
| POR / Portland General Electric Company | 0.00 | -100.00 | 0.00 | 0.0000 | |||||
| ETR / Entergy Corporation | 0.00 | -100.00 | 0.00 | 0.0000 | |||||
| PDCO / Patterson Companies, Inc. | 0.00 | -100.00 | 0.00 | 0.0000 | |||||
| CASY / Casey's General Stores, Inc. | 0.00 | -100.00 | 0.00 | 0.0000 | |||||
| SPTN / SpartanNash Company | 0.00 | -100.00 | 0.00 | 0.0000 |