Mga Batayang Estadistika
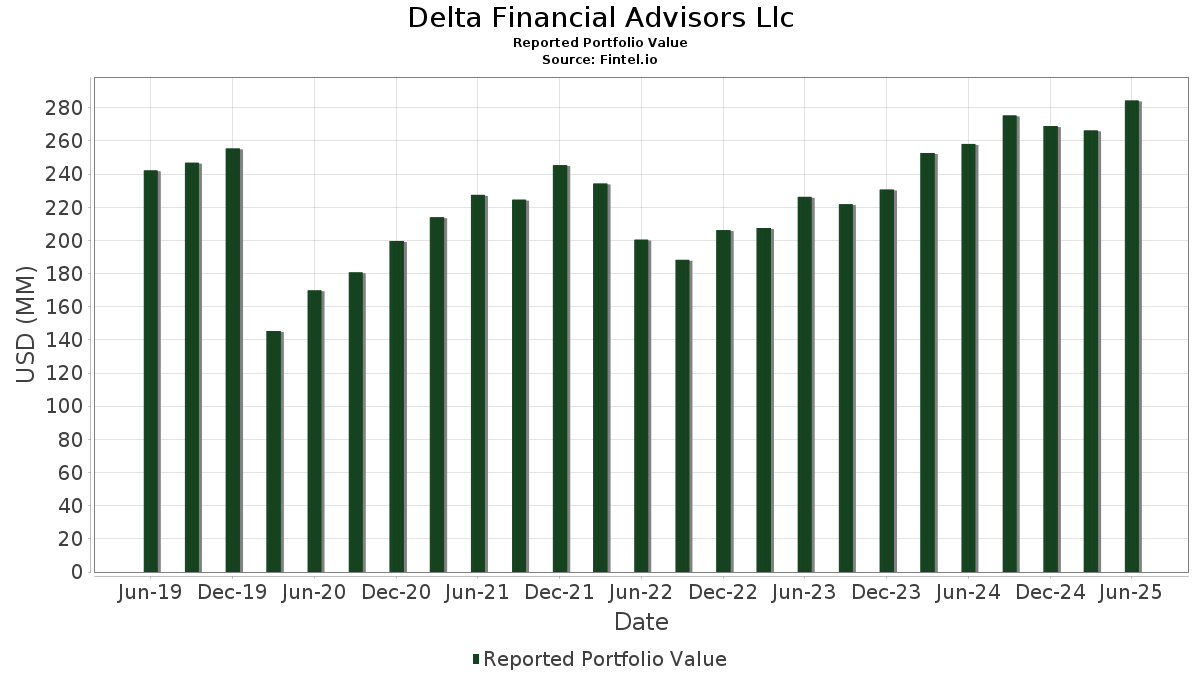
| Nilai Portofolio | $ 284,351,915 |
| Posisi Saat Ini | 112 |
Kepemilikan Terbaru, Kinerja, AUM (dari 13F, 13D)
Delta Financial Advisors Llc telah mengungkapkan total kepemilikan 112 dalam pengajuan SEC terbaru mereka. Nilai portofolio terbaru dihitung sebesar $ 284,351,915 USD. Aset yang Dikelola (AUM) sebenarnya adalah nilai ini ditambah kas (yang tidak diungkapkan). Aset-aset utama Delta Financial Advisors Llc adalah SPDR S&P 500 ETF (US:SPY) , Microsoft Corporation (US:MSFT) , NVIDIA Corporation (US:NVDA) , Apple Inc. (US:AAPL) , and Visa Inc. (US:V) .
Peningkatan Tertinggi Kuartal Ini
Kami menggunakan perubahan dalam alokasi portofolio karena ini adalah metrik yang paling bermakna. Perubahan dapat disebabkan oleh perdagangan atau perubahan harga saham.
| Keamanan | Saham (MM) |
Nilai (Juta Dolar AS) |
Portfolio % | ΔPorsyento ng Portfolio |
|---|---|---|---|---|
| 0.09 | 13.78 | 4.8469 | 1.3428 | |
| 0.03 | 14.72 | 5.1754 | 0.9273 | |
| 0.03 | 6.01 | 2.1145 | 0.6381 | |
| 0.02 | 4.41 | 1.5503 | 0.4546 | |
| 0.03 | 6.14 | 2.1608 | 0.2864 | |
| 0.01 | 4.78 | 1.6794 | 0.2619 | |
| 0.04 | 2.07 | 0.7272 | 0.2215 | |
| 0.00 | 3.52 | 1.2362 | 0.2131 | |
| 0.03 | 20.14 | 7.0828 | 0.2049 | |
| 0.01 | 1.86 | 0.6541 | 0.1788 |
Penurunan Tertinggi Kuartal Ini
Kami menggunakan perubahan dalam alokasi portofolio karena ini adalah metrik yang paling bermakna. Perubahan dapat disebabkan oleh perdagangan atau perubahan harga saham.
| Keamanan | Saham (MM) |
Nilai (Juta Dolar AS) |
Portfolio % | ΔPorsyento ng Portfolio |
|---|---|---|---|---|
| 0.06 | 13.27 | 4.6676 | -1.0743 | |
| 0.01 | 5.30 | 1.8647 | -0.2624 | |
| 0.00 | 1.35 | 0.4735 | -0.2618 | |
| 0.03 | 9.16 | 3.2229 | -0.2502 | |
| 0.03 | 5.01 | 1.7618 | -0.2195 | |
| 0.02 | 2.54 | 0.8939 | -0.2167 | |
| 0.03 | 3.95 | 1.3888 | -0.2125 | |
| 0.02 | 3.02 | 1.0605 | -0.1970 | |
| 0.01 | 1.19 | 0.4186 | -0.1947 | |
| 0.04 | 3.77 | 1.3262 | -0.1909 |
Pengajuan 13F dan Dana
Formulir ini diajukan pada 2025-08-07 untuk periode pelaporan 2025-06-30. Klik ikon tautan untuk melihat riwayat transaksi selengkapnya.
Tingkatkan ke versi premium untuk membuka data premium dan ekspor ke Excel. ![]() .
.
| Keamanan | Ketik | Harga Saham Rata-rata | Saham (MM) |
ΔSaham (%) |
ΔSaham (%) |
Nilai ($MM) |
Portpolyo (%) |
ΔPortofolio (%) |
|
|---|---|---|---|---|---|---|---|---|---|
| SPY / SPDR S&P 500 ETF | 0.03 | -0.44 | 20.14 | 9.96 | 7.0828 | 0.2049 | |||
| MSFT / Microsoft Corporation | 0.03 | -1.82 | 14.72 | 30.09 | 5.1754 | 0.9273 | |||
| NVDA / NVIDIA Corporation | 0.09 | 1.33 | 13.78 | 47.72 | 4.8469 | 1.3428 | |||
| AAPL / Apple Inc. | 0.06 | -6.02 | 13.27 | -13.19 | 4.6676 | -1.0743 | |||
| V / Visa Inc. | 0.03 | -2.19 | 9.16 | -0.91 | 3.2229 | -0.2502 | |||
| GOOG / Alphabet Inc. | 0.05 | -1.32 | 8.27 | 12.03 | 2.9087 | 0.1364 | |||
| TJX / The TJX Companies, Inc. | 0.06 | 0.19 | 7.62 | 1.59 | 2.6784 | -0.1371 | |||
| EFA / iShares Trust - iShares MSCI EAFE ETF | 0.07 | 0.00 | 6.43 | 9.37 | 2.2613 | 0.0536 | |||
| AMAT / Applied Materials, Inc. | 0.03 | -2.42 | 6.14 | 23.10 | 2.1608 | 0.2864 | |||
| AMZN / Amazon.com, Inc. | 0.03 | -2.32 | 6.09 | 12.64 | 2.1408 | 0.1111 | |||
| ORCL / Oracle Corporation | 0.03 | -2.20 | 6.01 | 52.94 | 2.1145 | 0.6381 | |||
| BRK.B / Berkshire Hathaway Inc. | 0.01 | 2.63 | 5.30 | -6.37 | 1.8647 | -0.2624 | |||
| WMT / Walmart Inc. | 0.05 | -1.47 | 5.21 | 9.75 | 1.8323 | 0.0493 | |||
| PG / The Procter & Gamble Company | 0.03 | 1.57 | 5.01 | -5.04 | 1.7618 | -0.2195 | |||
| IAU / iShares Gold Trust | 0.08 | 0.09 | 5.01 | 5.85 | 1.7615 | -0.0153 | |||
| GSCE / GS Connect S&P GSCI Enhanced Commodity Total Return ETN | 0.01 | -2.36 | 4.78 | 26.52 | 1.6794 | 0.2619 | |||
| JPM / JPMorgan Chase & Co. | 0.02 | -1.80 | 4.50 | 16.08 | 1.5820 | 0.1265 | |||
| AVGO / Broadcom Inc. | 0.02 | -8.23 | 4.41 | 51.11 | 1.5503 | 0.4546 | |||
| ADP / Automatic Data Processing, Inc. | 0.01 | -2.57 | 4.38 | -1.66 | 1.5402 | -0.1321 | |||
| COST / Costco Wholesale Corporation | 0.00 | -1.10 | 4.35 | 3.52 | 1.5302 | -0.0482 | |||
| BK / The Bank of New York Mellon Corporation | 0.05 | -1.08 | 4.26 | 7.47 | 1.4986 | 0.0095 | |||
| BLK / BlackRock, Inc. | 0.00 | -1.07 | 3.98 | 9.66 | 1.3981 | 0.0367 | |||
| JNJ / Johnson & Johnson | 0.03 | 0.55 | 3.95 | -7.39 | 1.3888 | -0.2125 | |||
| NUE / Nucor Corporation | 0.03 | 9.92 | 3.92 | 18.30 | 1.3803 | 0.1346 | |||
| AFL / Aflac Incorporated | 0.04 | -1.58 | 3.77 | -6.64 | 1.3262 | -0.1909 | |||
| ETR / Entergy Corporation | 0.04 | -1.09 | 3.61 | -3.83 | 1.2702 | -0.1403 | |||
| VYM / Vanguard Whitehall Funds - Vanguard High Dividend Yield ETF | 0.03 | 0.00 | 3.59 | 3.37 | 1.2631 | -0.0417 | |||
| RTX / RTX Corporation | 0.02 | -0.51 | 3.57 | 9.69 | 1.2545 | 0.0331 | |||
| META / Meta Platforms, Inc. | 0.00 | 0.74 | 3.52 | 29.04 | 1.2362 | 0.2131 | |||
| TRV / The Travelers Companies, Inc. | 0.01 | -1.69 | 3.21 | -0.56 | 1.1298 | -0.0832 | |||
| CVX / Chevron Corporation | 0.02 | 5.21 | 3.02 | -9.95 | 1.0605 | -0.1970 | |||
| LOW / Lowe's Companies, Inc. | 0.01 | 0.94 | 2.95 | -3.97 | 1.0368 | -0.1161 | |||
| IJH / iShares Trust - iShares Core S&P Mid-Cap ETF | 0.05 | 0.00 | 2.81 | 6.32 | 0.9882 | -0.0046 | |||
| AMGN / Amgen Inc. | 0.01 | 2.18 | 2.72 | -8.45 | 0.9572 | -0.1590 | |||
| EXPD / Expeditors International of Washington, Inc. | 0.02 | -1.71 | 2.69 | -6.62 | 0.9472 | -0.1359 | |||
| CARR / Carrier Global Corporation | 0.04 | 3.06 | 2.57 | 19.00 | 0.9052 | 0.0927 | |||
| XOM / Exxon Mobil Corporation | 0.02 | -5.18 | 2.54 | -14.07 | 0.8939 | -0.2167 | |||
| APD / Air Products and Chemicals, Inc. | 0.01 | 0.73 | 2.37 | -3.65 | 0.8349 | -0.0905 | |||
| VWO / Vanguard International Equity Index Funds - Vanguard FTSE Emerging Markets ETF | 0.05 | -0.40 | 2.36 | 8.88 | 0.8284 | 0.0157 | |||
| PEP / PepsiCo, Inc. | 0.02 | 3.87 | 2.28 | -8.53 | 0.8031 | -0.1344 | |||
| CB / Chubb Limited | 0.01 | -0.37 | 2.28 | -4.40 | 0.8029 | -0.0942 | |||
| NKE / NIKE, Inc. | 0.03 | 0.57 | 2.24 | 12.53 | 0.7867 | 0.0403 | |||
| ABT / Abbott Laboratories | 0.02 | -0.14 | 2.14 | 2.39 | 0.7528 | -0.0323 | |||
| CMI / Cummins Inc. | 0.01 | -1.71 | 2.07 | 2.72 | 0.7296 | -0.0289 | |||
| VEA / Vanguard Tax-Managed Funds - Vanguard FTSE Developed Markets ETF | 0.04 | 36.91 | 2.07 | 53.57 | 0.7272 | 0.2215 | |||
| SBUX / Starbucks Corporation | 0.02 | 1.15 | 2.04 | -5.51 | 0.7180 | -0.0934 | |||
| IJR / iShares Trust - iShares Core S&P Small-Cap ETF | 0.02 | -2.74 | 1.95 | 1.61 | 0.6875 | -0.0347 | |||
| DIS / The Walt Disney Company | 0.01 | 16.95 | 1.86 | 46.96 | 0.6541 | 0.1788 | |||
| EMR / Emerson Electric Co. | 0.01 | 0.14 | 1.85 | 21.78 | 0.6490 | 0.0800 | |||
| CRM / Salesforce, Inc. | 0.01 | 1.72 | 1.66 | 3.36 | 0.5842 | -0.0194 | |||
| CTSH / Cognizant Technology Solutions Corporation | 0.02 | -2.11 | 1.65 | -0.12 | 0.5790 | -0.0402 | |||
| FDX / FedEx Corporation | 0.01 | -1.84 | 1.62 | -8.46 | 0.5709 | -0.0951 | |||
| MCD / McDonald's Corporation | 0.01 | -0.89 | 1.46 | -7.28 | 0.5151 | -0.0783 | |||
| PNC / The PNC Financial Services Group, Inc. | 0.01 | 0.08 | 1.45 | 6.14 | 0.5112 | -0.0031 | |||
| ATO / Atmos Energy Corporation | 0.01 | -1.78 | 1.42 | -2.08 | 0.4979 | -0.0450 | |||
| GPC / Genuine Parts Company | 0.01 | -1.13 | 1.41 | 0.64 | 0.4957 | -0.0301 | |||
| MNST / Monster Beverage Corporation | 0.02 | 0.28 | 1.35 | 7.30 | 0.4761 | 0.0025 | |||
| UNH / UnitedHealth Group Incorporated | 0.00 | 15.43 | 1.35 | -31.26 | 0.4735 | -0.2618 | |||
| KMI / Kinder Morgan, Inc. | 0.04 | -3.05 | 1.31 | -0.15 | 0.4617 | -0.0318 | |||
| COP / ConocoPhillips | 0.01 | -3.79 | 1.30 | -17.78 | 0.4586 | -0.1371 | |||
| OMC / Omnicom Group Inc. | 0.02 | -4.00 | 1.28 | -16.70 | 0.4511 | -0.1272 | |||
| CVS / CVS Health Corporation | 0.02 | 3.75 | 1.26 | 5.64 | 0.4415 | -0.0048 | |||
| CBRE / CBRE Group, Inc. | 0.01 | -3.49 | 1.22 | 3.39 | 0.4295 | -0.0140 | |||
| BDX / Becton, Dickinson and Company | 0.01 | -3.09 | 1.19 | -27.13 | 0.4186 | -0.1947 | |||
| VB / Vanguard Index Funds - Vanguard Small-Cap ETF | 0.00 | -0.82 | 1.14 | 6.02 | 0.4024 | -0.0030 | |||
| VO / Vanguard Index Funds - Vanguard Mid-Cap ETF | 0.00 | -0.98 | 1.14 | 7.18 | 0.3993 | 0.0013 | |||
| DUK / Duke Energy Corporation | 0.01 | -3.94 | 1.13 | -7.05 | 0.3989 | -0.0594 | |||
| CI / The Cigna Group | 0.00 | -2.07 | 1.08 | -1.55 | 0.3788 | -0.0322 | |||
| PSX / Phillips 66 | 0.01 | -4.71 | 1.02 | -7.94 | 0.3588 | -0.0574 | |||
| TROW / T. Rowe Price Group, Inc. | 0.01 | -1.46 | 0.96 | 3.46 | 0.3364 | -0.0106 | |||
| MRK / Merck & Co., Inc. | 0.01 | 43.63 | 0.94 | 26.82 | 0.3309 | 0.0519 | |||
| T / AT&T Inc. | 0.03 | 9.94 | 0.93 | 12.53 | 0.3285 | 0.0167 | |||
| KO / The Coca-Cola Company | 0.01 | -2.61 | 0.88 | -3.72 | 0.3099 | -0.0341 | |||
| HD / The Home Depot, Inc. | 0.00 | 30.72 | 0.88 | 30.80 | 0.3094 | 0.0567 | |||
| LMT / Lockheed Martin Corporation | 0.00 | 5.33 | 0.87 | 9.30 | 0.3061 | 0.0068 | |||
| GNRC / Generac Holdings Inc. | 0.01 | 0.70 | 0.87 | 13.95 | 0.3046 | 0.0189 | |||
| BMY / Bristol-Myers Squibb Company | 0.02 | -3.73 | 0.84 | -26.88 | 0.2947 | -0.1360 | |||
| DVA / DaVita Inc. | 0.01 | -1.06 | 0.80 | -7.88 | 0.2798 | -0.0445 | |||
| WDAY / Workday, Inc. | 0.00 | -6.76 | 0.79 | -4.12 | 0.2783 | -0.0318 | |||
| REGN / Regeneron Pharmaceuticals, Inc. | 0.00 | 0.98 | 0.75 | -16.41 | 0.2654 | -0.0736 | |||
| STZ / Constellation Brands, Inc. | 0.00 | -2.32 | 0.62 | -13.47 | 0.2193 | -0.0512 | |||
| NFLX / Netflix, Inc. | 0.00 | 0.00 | 0.60 | 43.68 | 0.2119 | 0.0543 | |||
| QCOM / QUALCOMM Incorporated | 0.00 | 1.09 | 0.59 | 4.81 | 0.2070 | -0.0039 | |||
| PFE / Pfizer Inc. | 0.02 | 0.82 | 0.53 | -3.64 | 0.1862 | -0.0200 | |||
| VV / Vanguard Index Funds - Vanguard Large-Cap ETF | 0.00 | 0.00 | 0.51 | 11.11 | 0.1794 | 0.0068 | |||
| NEE / NextEra Energy, Inc. | 0.01 | 0.62 | 0.49 | -1.40 | 0.1736 | -0.0145 | |||
| ALB / Albemarle Corporation | 0.01 | -3.27 | 0.46 | -15.72 | 0.1621 | -0.0436 | |||
| VTSM.X / Vanguard Index Funds - Vanguard Total Stock Market ETF | 0.00 | 3.49 | 0.43 | 14.29 | 0.1522 | 0.0102 | |||
| TSLA / Tesla, Inc. | 0.00 | 0.00 | 0.43 | 22.73 | 0.1519 | 0.0196 | |||
| IVV / iShares Trust - iShares Core S&P 500 ETF | 0.00 | 1.93 | 0.43 | 12.70 | 0.1498 | 0.0078 | |||
| CL / Colgate-Palmolive Company | 0.00 | 0.02 | 0.41 | -3.06 | 0.1452 | -0.0146 | |||
| ABBV / AbbVie Inc. | 0.00 | -3.86 | 0.40 | -14.81 | 0.1398 | -0.0355 | |||
| ADBE / Adobe Inc. | 0.00 | 1.05 | 0.37 | 2.20 | 0.1305 | -0.0062 | |||
| BSV / Vanguard Bond Index Funds - Vanguard Short-Term Bond ETF | 0.00 | -4.28 | 0.37 | -3.95 | 0.1286 | -0.0141 | |||
| VRTX / Vertex Pharmaceuticals Incorporated | 0.00 | 15.54 | 0.35 | 6.06 | 0.1234 | -0.0008 | |||
| TMUS / T-Mobile US, Inc. | 0.00 | 0.00 | 0.33 | -10.87 | 0.1156 | -0.0226 | |||
| AXP / American Express Company | 0.00 | -4.78 | 0.32 | 12.81 | 0.1118 | 0.0060 | |||
| IWF / iShares Trust - iShares Russell 1000 Growth ETF | 0.00 | 0.00 | 0.31 | 17.74 | 0.1099 | 0.0101 | |||
| AMD / Advanced Micro Devices, Inc. | 0.00 | 0.00 | 0.31 | 38.22 | 0.1096 | 0.0249 | |||
| SCHW / The Charles Schwab Corporation | 0.00 | -15.91 | 0.30 | -2.28 | 0.1058 | -0.0095 | |||
| UL / Unilever PLC - Depositary Receipt (Common Stock) | 0.00 | 0.09 | 0.28 | 2.90 | 0.1001 | -0.0039 | |||
| GOOGL / Alphabet Inc. | 0.00 | 0.64 | 0.28 | 14.52 | 0.0973 | 0.0067 | |||
| AMT / American Tower Corporation | 0.00 | -12.56 | 0.28 | -11.29 | 0.0969 | -0.0196 | |||
| CNP / CenterPoint Energy, Inc. | 0.01 | -13.18 | 0.27 | -11.97 | 0.0957 | -0.0204 | |||
| LECO / Lincoln Electric Holdings, Inc. | 0.00 | -7.14 | 0.27 | 1.89 | 0.0948 | -0.0047 | |||
| HII / Huntington Ingalls Industries, Inc. | 0.00 | 0.26 | 0.0930 | 0.0930 | |||||
| BX / Blackstone Inc. | 0.00 | 0.00 | 0.26 | 6.97 | 0.0920 | 0.0002 | |||
| CAT / Caterpillar Inc. | 0.00 | -6.13 | 0.24 | 10.23 | 0.0837 | 0.0028 | |||
| VZ / Verizon Communications Inc. | 0.01 | -8.84 | 0.24 | -12.87 | 0.0835 | -0.0190 | |||
| UPS / United Parcel Service, Inc. | 0.00 | -2.02 | 0.24 | -9.96 | 0.0827 | -0.0155 | |||
| TXN / Texas Instruments Incorporated | 0.00 | 0.22 | 0.0767 | 0.0767 | |||||
| TTE / TotalEnergies SE - Depositary Receipt (Common Stock) | 0.00 | -1.48 | 0.20 | -6.42 | 0.0719 | -0.0102 | |||
| LNG / Cheniere Energy, Inc. | 0.00 | -100.00 | 0.00 | 0.0000 |