Mga Batayang Estadistika
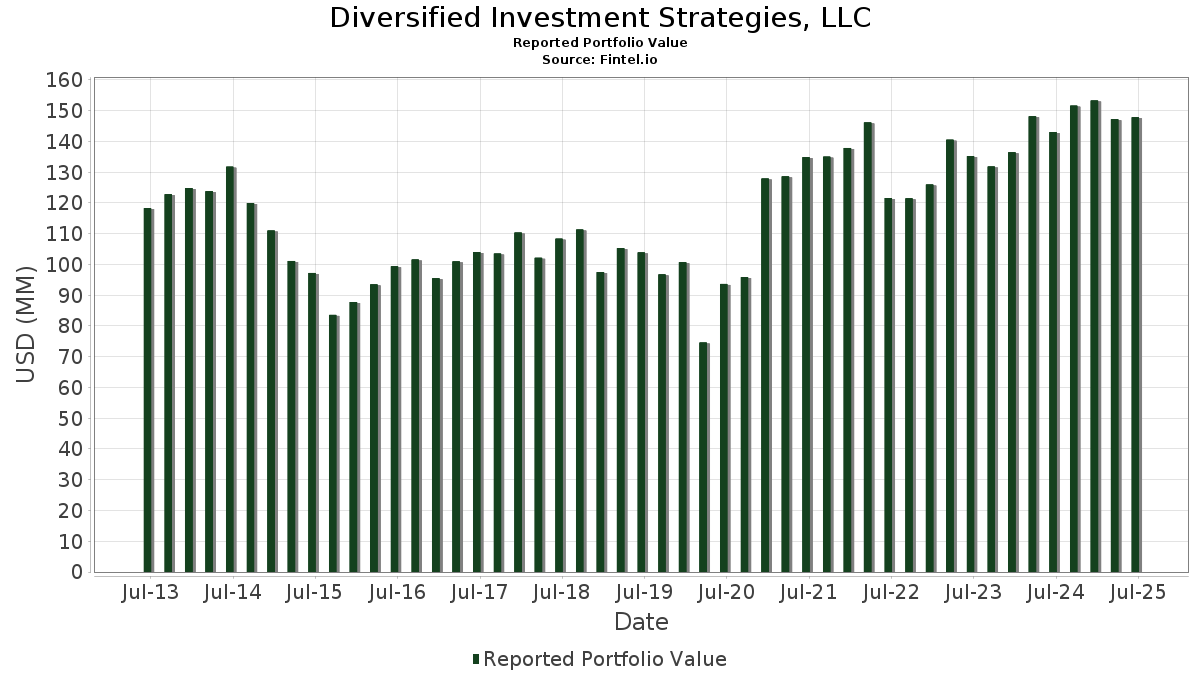
| Nilai Portofolio | $ 147,865,590 |
| Posisi Saat Ini | 50 |
Kepemilikan Terbaru, Kinerja, AUM (dari 13F, 13D)
Diversified Investment Strategies, LLC telah mengungkapkan total kepemilikan 50 dalam pengajuan SEC terbaru mereka. Nilai portofolio terbaru dihitung sebesar $ 147,865,590 USD. Aset yang Dikelola (AUM) sebenarnya adalah nilai ini ditambah kas (yang tidak diungkapkan). Aset-aset utama Diversified Investment Strategies, LLC adalah Exxon Mobil Corporation (US:XOM) , GoDaddy Inc. (US:GDDY) , The St. Joe Company (US:JOE) , DICK'S Sporting Goods, Inc. (US:DKS) , and Cal-Maine Foods, Inc. (US:CALM) . Posisi baru Diversified Investment Strategies, LLC meliputi: PubMatic, Inc. (US:PUBM) , Generac Holdings Inc. (US:GNRC) , .
Peningkatan Tertinggi Kuartal Ini
Kami menggunakan perubahan dalam alokasi portofolio karena ini adalah metrik yang paling bermakna. Perubahan dapat disebabkan oleh perdagangan atau perubahan harga saham.
| Keamanan | Saham (MM) |
Nilai (Juta Dolar AS) |
Portfolio % | ΔPorsyento ng Portfolio |
|---|---|---|---|---|
| 0.04 | 5.30 | 3.5866 | 0.7027 | |
| 0.01 | 4.61 | 3.1207 | 0.7004 | |
| 0.08 | 1.00 | 0.6730 | 0.6730 | |
| 0.28 | 3.27 | 2.2113 | 0.6683 | |
| 0.09 | 5.48 | 3.7084 | 0.5158 | |
| 0.06 | 6.33 | 4.2804 | 0.3662 | |
| 0.00 | 0.54 | 0.3643 | 0.3643 | |
| 0.06 | 4.16 | 2.8144 | 0.3293 | |
| 0.03 | 2.02 | 1.3690 | 0.2986 | |
| 0.16 | 6.61 | 4.4677 | 0.2867 |
Penurunan Tertinggi Kuartal Ini
Kami menggunakan perubahan dalam alokasi portofolio karena ini adalah metrik yang paling bermakna. Perubahan dapat disebabkan oleh perdagangan atau perubahan harga saham.
| Keamanan | Saham (MM) |
Nilai (Juta Dolar AS) |
Portfolio % | ΔPorsyento ng Portfolio |
|---|---|---|---|---|
| 0.08 | 7.50 | 5.0689 | -2.6186 | |
| 0.21 | 22.45 | 15.1846 | -1.5541 | |
| 0.08 | 4.39 | 2.9661 | -0.2706 | |
| 0.06 | 4.37 | 2.9553 | -0.2630 | |
| 0.04 | 8.30 | 5.6126 | -0.2376 | |
| 0.04 | 0.54 | 0.3682 | -0.1699 | |
| 0.08 | 14.78 | 9.9945 | -0.1677 | |
| 0.12 | 1.22 | 0.8269 | -0.1395 | |
| 0.01 | 2.55 | 1.7232 | -0.1178 | |
| 0.02 | 1.92 | 1.2977 | -0.0742 |
Pengajuan 13F dan Dana
Formulir ini diajukan pada 2025-07-28 untuk periode pelaporan 2025-06-30. Klik ikon tautan untuk melihat riwayat transaksi selengkapnya.
Tingkatkan ke versi premium untuk membuka data premium dan ekspor ke Excel. ![]() .
.
| Keamanan | Ketik | Harga Saham Rata-rata | Saham (MM) |
ΔSaham (%) |
ΔSaham (%) |
Nilai ($MM) |
Portpolyo (%) |
ΔPortofolio (%) |
|
|---|---|---|---|---|---|---|---|---|---|
| XOM / Exxon Mobil Corporation | 0.21 | 0.52 | 22.45 | -8.89 | 15.1846 | -1.5541 | |||
| GDDY / GoDaddy Inc. | 0.08 | -1.17 | 14.78 | -1.22 | 9.9945 | -0.1677 | |||
| JOE / The St. Joe Company | 0.28 | -1.40 | 13.18 | 0.17 | 8.9115 | -0.0234 | |||
| DKS / DICK'S Sporting Goods, Inc. | 0.04 | -1.81 | 8.30 | -3.63 | 5.6126 | -0.2376 | |||
| CALM / Cal-Maine Foods, Inc. | 0.08 | -39.58 | 7.50 | -33.77 | 5.0689 | -2.6186 | |||
| FAST / Fastenal Company | 0.16 | 98.17 | 6.61 | 7.33 | 4.4677 | 0.2867 | |||
| WMT / Walmart Inc. | 0.06 | -1.39 | 6.33 | 9.84 | 4.2804 | 0.3662 | |||
| NTR / Nutrien Ltd. | 0.09 | -0.50 | 5.48 | 16.66 | 3.7084 | 0.5158 | |||
| DIS / The Walt Disney Company | 0.04 | -0.58 | 5.30 | 24.92 | 3.5866 | 0.7027 | |||
| MLR / Miller Industries, Inc. | 0.11 | -0.42 | 4.77 | 4.52 | 3.2239 | 0.1251 | |||
| WBD / Warner Bros. Discovery, Inc. | 0.42 | -0.60 | 4.76 | 6.15 | 3.2202 | 0.1737 | |||
| MSFT / Microsoft Corporation | 0.01 | -2.27 | 4.61 | 29.50 | 3.1207 | 0.7004 | |||
| UHALB / U-Haul Holding Company - Series N | 0.08 | 0.19 | 4.39 | -7.96 | 2.9661 | -0.2706 | |||
| DLB / Dolby Laboratories, Inc. | 0.06 | -0.25 | 4.37 | -7.77 | 2.9553 | -0.2630 | |||
| PYPL / PayPal Holdings, Inc. | 0.06 | -0.13 | 4.16 | 13.75 | 2.8144 | 0.3293 | |||
| GAMB / Gambling.com Group Limited | 0.28 | 52.78 | 3.27 | 43.95 | 2.2113 | 0.6683 | |||
| GRMN / Garmin Ltd. | 0.01 | -2.20 | 2.55 | -5.98 | 1.7232 | -0.1178 | |||
| SCHW / The Charles Schwab Corporation | 0.02 | 0.00 | 2.11 | 16.53 | 1.4261 | 0.1972 | |||
| ODC / Oil-Dri Corporation of America | 0.03 | 0.00 | 2.02 | 28.51 | 1.3690 | 0.2986 | |||
| EXPD / Expeditors International of Washington, Inc. | 0.02 | 0.00 | 1.92 | -5.00 | 1.2977 | -0.0742 | |||
| SCHF / Schwab Strategic Trust - Schwab International Equity ETF | 0.07 | -2.88 | 1.59 | 8.54 | 1.0748 | 0.0799 | |||
| JOUT / Johnson Outdoors Inc. | 0.04 | -0.09 | 1.34 | 21.76 | 0.9084 | 0.1590 | |||
| SPY / SPDR S&P 500 ETF | 0.00 | 21.21 | 1.31 | 33.84 | 0.8858 | 0.2213 | |||
| AOUT / American Outdoor Brands, Inc. | 0.12 | 0.00 | 1.22 | -14.06 | 0.8269 | -0.1395 | |||
| QQQ / Invesco QQQ Trust, Series 1 | 0.00 | 0.00 | 1.18 | 17.69 | 0.8010 | 0.1171 | |||
| PUBM / PubMatic, Inc. | 0.08 | 1.00 | 0.6730 | 0.6730 | |||||
| MAMA / Mama's Creations, Inc. | 0.09 | 0.00 | 0.78 | 27.66 | 0.5276 | 0.1120 | |||
| DOUG / Douglas Elliman Inc. | 0.34 | -11.82 | 0.78 | 20.43 | 0.5266 | 0.0873 | |||
| IWN / iShares Trust - iShares Russell 2000 Value ETF | 0.00 | 0.00 | 0.76 | 4.42 | 0.5117 | 0.0198 | |||
| SLYV / SPDR Series Trust - SPDR S&P 600 Small Cap Value ETF | 0.01 | -2.59 | 0.67 | -0.88 | 0.4559 | -0.0062 | |||
| ULTA / Ulta Beauty, Inc. | 0.00 | 117.69 | 0.66 | 177.73 | 0.4477 | 0.2858 | |||
| COF / Capital One Financial Corporation | 0.00 | 0.00 | 0.59 | 18.71 | 0.3996 | 0.0614 | |||
| LAKE / Lakeland Industries, Inc. | 0.04 | 2.56 | 0.54 | -31.31 | 0.3682 | -0.1699 | |||
| GNRC / Generac Holdings Inc. | 0.00 | 0.54 | 0.3643 | 0.3643 | |||||
| SLYG / SPDR Series Trust - SPDR S&P 600 Small Cap Growth ETF | 0.01 | -1.55 | 0.54 | 5.11 | 0.3625 | 0.0166 | |||
| NVDD / Direxion Shares ETF Trust - Direxion Daily NVDA Bear 1X Shares | 0.00 | 0.00 | 0.53 | 45.83 | 0.3553 | 0.1105 | |||
| UHAL / U-Haul Holding Company | 0.01 | -0.92 | 0.49 | -8.29 | 0.3299 | -0.0310 | |||
| AAPL / Apple Inc. | 0.00 | -6.90 | 0.48 | -14.03 | 0.3275 | -0.0550 | |||
| INTU / Intuit Inc. | 0.00 | 0.00 | 0.48 | 28.46 | 0.3271 | 0.0710 | |||
| SCHV / Schwab Strategic Trust - Schwab U.S. Large-Cap Value ETF | 0.01 | -1.89 | 0.41 | 2.25 | 0.2768 | 0.0046 | |||
| NVR / NVR, Inc. | 0.00 | 0.00 | 0.40 | 1.79 | 0.2697 | 0.0040 | |||
| VTI / Vanguard Index Funds - Vanguard Total Stock Market ETF | 0.00 | 0.00 | 0.37 | 10.45 | 0.2508 | 0.0230 | |||
| SAM / The Boston Beer Company, Inc. | 0.00 | 0.00 | 0.36 | -20.18 | 0.2413 | -0.0621 | |||
| SCHG / Schwab Strategic Trust - Schwab U.S. Large-Cap Growth ETF | 0.01 | -11.06 | 0.34 | 4.00 | 0.2287 | 0.0073 | |||
| CHWY / Chewy, Inc. | 0.01 | 0.00 | 0.33 | 31.10 | 0.2255 | 0.0527 | |||
| SCHX / Schwab Strategic Trust - Schwab U.S. Large-Cap ETF | 0.01 | -6.24 | 0.32 | 3.91 | 0.2160 | 0.0069 | |||
| SCHZ / Schwab Strategic Trust - Schwab U.S. Aggregate Bond ETF | 0.01 | -4.30 | 0.28 | -3.79 | 0.1889 | -0.0087 | |||
| GLXZ / Galaxy Gaming, Inc. | 0.10 | 357.04 | 0.28 | 348.39 | 0.1880 | 0.1458 | |||
| THO / THOR Industries, Inc. | 0.00 | 0.23 | 0.1532 | 0.1532 | |||||
| CVX / Chevron Corporation | 0.00 | 1.01 | 0.21 | -13.77 | 0.1445 | -0.0234 | |||
| TVPC / Twin Vee Powercats Inc | 0.00 | -100.00 | 0.00 | 0.0000 | |||||
| TDW / Tidewater Inc. | 0.00 | -100.00 | 0.00 | 0.0000 | |||||
| EPD / Enterprise Products Partners L.P. - Limited Partnership | 0.00 | -100.00 | 0.00 | 0.0000 | |||||
| GAN / GAN Limited | 0.00 | -100.00 | 0.00 | 0.0000 | |||||
| PLTR / Palantir Technologies Inc. | 0.00 | -100.00 | 0.00 | 0.0000 |