Mga Batayang Estadistika
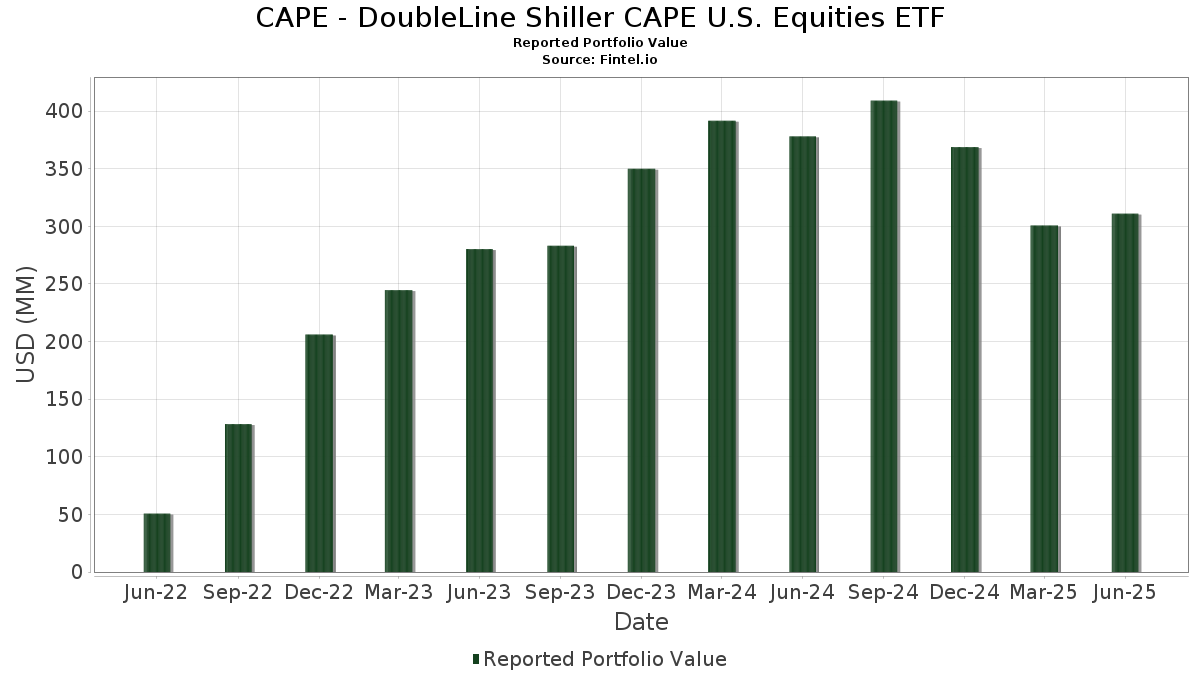
| Nilai Portofolio | $ 311,038,940 |
| Posisi Saat Ini | 167 |
Kepemilikan Terbaru, Kinerja, AUM (dari 13F, 13D)
CAPE - DoubleLine Shiller CAPE U.S. Equities ETF telah mengungkapkan total kepemilikan 167 dalam pengajuan SEC terbaru mereka. Nilai portofolio terbaru dihitung sebesar $ 311,038,940 USD. Aset yang Dikelola (AUM) sebenarnya adalah nilai ini ditambah kas (yang tidak diungkapkan). Aset-aset utama CAPE - DoubleLine Shiller CAPE U.S. Equities ETF adalah Amazon.com, Inc. (US:AMZN) , Meta Platforms, Inc. (US:META) , Linde plc (DE:LIN) , Tesla, Inc. (US:TSLA) , and Alphabet Inc. (US:GOOGL) . Posisi baru CAPE - DoubleLine Shiller CAPE U.S. Equities ETF meliputi: DoorDash, Inc. (US:DASH) , TKO Group Holdings, Inc. (US:TKO) , Williams-Sonoma, Inc. (US:WSM) , .
Peningkatan Tertinggi Kuartal Ini
Kami menggunakan perubahan dalam alokasi portofolio karena ini adalah metrik yang paling bermakna. Perubahan dapat disebabkan oleh perdagangan atau perubahan harga saham.
| Keamanan | Saham (MM) |
Nilai (Juta Dolar AS) |
Portfolio % | ΔPorsyento ng Portfolio |
|---|---|---|---|---|
| 0.06 | 3.76 | 1.2084 | 1.2084 | |
| 0.05 | 3.55 | 1.1410 | 1.1410 | |
| 0.03 | 3.26 | 1.0466 | 1.0466 | |
| 0.08 | 18.15 | 5.8256 | 0.8594 | |
| 0.04 | 12.57 | 4.0367 | 0.8349 | |
| 0.01 | 1.71 | 0.5488 | 0.5488 | |
| 0.04 | 5.48 | 1.7583 | 0.5416 | |
| 0.03 | 1.62 | 0.5197 | 0.5197 | |
| 0.01 | 7.12 | 2.2863 | 0.5087 | |
| 0.01 | 1.41 | 0.4540 | 0.4540 |
Penurunan Tertinggi Kuartal Ini
Kami menggunakan perubahan dalam alokasi portofolio karena ini adalah metrik yang paling bermakna. Perubahan dapat disebabkan oleh perdagangan atau perubahan harga saham.
| Keamanan | Saham (MM) |
Nilai (Juta Dolar AS) |
Portfolio % | ΔPorsyento ng Portfolio |
|---|---|---|---|---|
| 0.00 | 3.09 | 0.9916 | -0.4961 | |
| 0.01 | 3.34 | 1.0718 | -0.3056 | |
| 0.12 | 3.59 | 1.1533 | -0.2523 | |
| 0.01 | 4.51 | 1.4473 | -0.2145 | |
| 0.01 | 2.49 | 0.8010 | -0.2073 | |
| 0.01 | 3.58 | 1.1499 | -0.2030 | |
| 0.08 | 2.04 | 0.6540 | -0.1916 | |
| 0.03 | 12.61 | 4.0486 | -0.1884 | |
| 0.02 | 2.09 | 0.6721 | -0.1743 | |
| 0.02 | 3.63 | 1.1641 | -0.1658 |
Pengajuan 13F dan Dana
Formulir ini diajukan pada 2025-08-22 untuk periode pelaporan 2025-06-30. Klik ikon tautan untuk melihat riwayat transaksi selengkapnya.
Tingkatkan ke versi premium untuk membuka data premium dan ekspor ke Excel. ![]() .
.
| Keamanan | Ketik | Harga Saham Rata-rata | Saham (MM) |
ΔSaham (%) |
ΔSaham (%) |
Nilai ($MM) |
Portpolyo (%) |
ΔPortofolio (%) |
|
|---|---|---|---|---|---|---|---|---|---|
| AMZN / Amazon.com, Inc. | 0.08 | 5.16 | 18.15 | 21.26 | 5.8256 | 0.8594 | |||
| META / Meta Platforms, Inc. | 0.02 | -13.75 | 15.19 | 10.46 | 4.8764 | 0.3125 | |||
| LIN / Linde plc | 0.03 | -28.13 | 12.61 | -19.46 | 4.0486 | -0.1884 | |||
| TSLA / Tesla, Inc. | 0.04 | 6.33 | 12.57 | 30.33 | 4.0367 | 0.8349 | |||
| GOOGL / Alphabet Inc. | 0.04 | 5.27 | 7.84 | 19.97 | 2.5167 | 0.3481 | |||
| NFLX / Netflix, Inc. | 0.01 | -7.42 | 7.12 | 32.95 | 2.2863 | 0.5087 | |||
| GOOG / Alphabet Inc. | 0.04 | 4.33 | 6.37 | 18.47 | 2.0448 | 0.2604 | |||
| AMT / American Tower Corporation | 0.03 | 1.08 | 5.93 | 2.67 | 1.9044 | -0.0130 | |||
| PLD / Prologis, Inc. | 0.05 | 0.91 | 5.56 | -5.11 | 1.7839 | -0.1594 | |||
| WELL / Welltower Inc. | 0.04 | 48.89 | 5.48 | 49.37 | 1.7583 | 0.5416 | |||
| HD / The Home Depot, Inc. | 0.01 | 6.93 | 5.21 | 6.99 | 1.6714 | 0.0562 | |||
| SHW / The Sherwin-Williams Company | 0.01 | -27.32 | 4.51 | -26.60 | 1.4473 | -0.2145 | |||
| ECL / Ecolab Inc. | 0.01 | -26.79 | 3.88 | -15.81 | 1.2468 | -0.0016 | |||
| EA / Electronic Arts Inc. | 0.02 | 10.78 | 3.80 | 22.40 | 1.2212 | 0.1899 | |||
| NEM / Newmont Corporation | 0.06 | 3.76 | 1.2084 | 1.2084 | |||||
| TTWO / Take-Two Interactive Software, Inc. | 0.01 | -19.60 | 3.64 | -5.79 | 1.1695 | -0.1138 | |||
| DIS / The Walt Disney Company | 0.03 | -5.27 | 3.64 | 19.01 | 1.1682 | 0.1536 | |||
| TMUS / T-Mobile US, Inc. | 0.02 | 1.29 | 3.63 | -9.51 | 1.1641 | -0.1658 | |||
| FCX / Freeport-McMoRan Inc. | 0.08 | -25.01 | 3.62 | -14.64 | 1.1629 | 0.0146 | |||
| T / AT&T Inc. | 0.12 | -17.12 | 3.59 | -15.18 | 1.1533 | -0.2523 | |||
| APD / Air Products and Chemicals, Inc. | 0.01 | -26.33 | 3.58 | -28.37 | 1.1499 | -0.2030 | |||
| CHTR / Charter Communications, Inc. | 0.01 | -5.94 | 3.58 | 4.35 | 1.1481 | 0.0107 | |||
| BKNG / Booking Holdings Inc. | 0.00 | -17.29 | 3.57 | 3.93 | 1.1468 | 0.0062 | |||
| CMCSA / Comcast Corporation | 0.10 | 12.30 | 3.56 | 8.62 | 1.1414 | 0.0551 | |||
| CTVA / Corteva, Inc. | 0.05 | 3.55 | 1.1410 | 1.1410 | |||||
| VZ / Verizon Communications Inc. | 0.08 | -3.91 | 3.48 | -8.34 | 1.1159 | -0.1426 | |||
| MLM / Martin Marietta Materials, Inc. | 0.01 | -8.08 | 3.44 | -2.30 | 1.1041 | 0.1514 | |||
| VMC / Vulcan Materials Company | 0.01 | -10.87 | 3.42 | -9.62 | 1.0975 | 0.0738 | |||
| MCD / McDonald's Corporation | 0.01 | -14.00 | 3.34 | -19.57 | 1.0718 | -0.3056 | |||
| NUE / Nucor Corporation | 0.03 | 3.26 | 1.0466 | 1.0466 | |||||
| DLR / Digital Realty Trust, Inc. | 0.02 | 2.20 | 3.26 | 24.33 | 1.0451 | 0.1762 | |||
| DD / DuPont de Nemours, Inc. | 0.05 | -1.43 | 3.13 | -11.35 | 1.0060 | 0.0496 | |||
| EQIX / Equinix, Inc. | 0.00 | -29.37 | 3.09 | -31.10 | 0.9916 | -0.4961 | |||
| O / Realty Income Corporation | 0.05 | 4.60 | 3.06 | 3.87 | 0.9822 | 0.0047 | |||
| WBD / Warner Bros. Discovery, Inc. | 0.26 | -6.95 | 2.98 | -0.63 | 0.9573 | -0.0384 | |||
| SPG / Simon Property Group, Inc. | 0.02 | 1.35 | 2.89 | -1.93 | 0.9294 | -0.0500 | |||
| PPG / PPG Industries, Inc. | 0.02 | -4.86 | 2.82 | -9.42 | 0.9043 | 0.0629 | |||
| TJX / The TJX Companies, Inc. | 0.02 | -13.32 | 2.78 | -12.13 | 0.8931 | -0.1574 | |||
| LYV / Live Nation Entertainment, Inc. | 0.02 | -7.57 | 2.75 | 7.08 | 0.8845 | 0.0306 | |||
| PSA / Public Storage | 0.01 | 1.31 | 2.72 | -0.66 | 0.8747 | -0.0357 | |||
| IP / International Paper Company | 0.06 | 49.47 | 2.70 | 30.06 | 0.8670 | 0.3051 | |||
| CCI / Crown Castle Inc. | 0.03 | 1.95 | 2.64 | 0.46 | 0.8462 | -0.0243 | |||
| LOW / Lowe's Companies, Inc. | 0.01 | -13.68 | 2.49 | -17.91 | 0.8010 | -0.2073 | |||
| CBRE / CBRE Group, Inc. | 0.02 | -2.02 | 2.42 | 4.99 | 0.7766 | 0.0119 | |||
| Smurfit WestRock plc / EC (IE00028FXN24) | 0.05 | -0.83 | 2.34 | -20.56 | 0.7521 | -0.0458 | |||
| AMCR / Amcor plc | 0.25 | 56.24 | 2.30 | 52.62 | 0.7377 | 0.3302 | |||
| SBUX / Starbucks Corporation | 0.02 | -12.13 | 2.09 | -17.92 | 0.6721 | -0.1743 | |||
| IFF / International Flavors & Fragrances Inc. | 0.03 | -1.85 | 2.05 | -14.61 | 0.6589 | 0.0084 | |||
| DOW / Dow Inc. | 0.08 | -1.20 | 2.04 | -34.80 | 0.6540 | -0.1916 | |||
| VICI / VICI Properties Inc. | 0.06 | 1.91 | 2.03 | 1.86 | 0.6518 | -0.0097 | |||
| CSGP / CoStar Group, Inc. | 0.02 | 1.33 | 2.00 | 2.83 | 0.6416 | -0.0034 | |||
| STLD / Steel Dynamics, Inc. | 0.02 | -5.70 | 1.93 | 5.82 | 0.6190 | 0.1259 | |||
| PKG / Packaging Corporation of America | 0.01 | -1.39 | 1.84 | -17.45 | 0.5908 | -0.0125 | |||
| EXR / Extra Space Storage Inc. | 0.01 | 1.39 | 1.84 | 0.66 | 0.5903 | -0.0158 | |||
| IRM / Iron Mountain Incorporated | 0.02 | 1.28 | 1.79 | 20.77 | 0.5733 | 0.0824 | |||
| DASH / DoorDash, Inc. | 0.01 | 1.71 | 0.5488 | 0.5488 | |||||
| AVB / AvalonBay Communities, Inc. | 0.01 | 1.66 | 1.71 | -3.56 | 0.5477 | -0.0397 | |||
| BALL / Ball Corporation | 0.03 | -8.97 | 1.70 | -7.35 | 0.5461 | 0.0491 | |||
| NKE / NIKE, Inc. | 0.02 | -13.32 | 1.68 | -3.00 | 0.5392 | -0.0354 | |||
| VTR / Ventas, Inc. | 0.03 | 8.38 | 1.67 | -0.48 | 0.5373 | -0.0207 | |||
| CF / CF Industries Holdings, Inc. | 0.02 | -10.82 | 1.64 | -3.82 | 0.5254 | 0.0648 | |||
| OMC / Omnicom Group Inc. | 0.02 | -7.40 | 1.62 | -19.66 | 0.5198 | -0.1490 | |||
| LYB / LyondellBasell Industries N.V. | 0.03 | 1.62 | 0.5197 | 0.5197 | |||||
| RCL / Royal Caribbean Cruises Ltd. | 0.01 | -12.03 | 1.57 | 34.07 | 0.5056 | 0.1158 | |||
| ORLY / O'Reilly Automotive, Inc. | 0.02 | 1,207.27 | 1.56 | -17.76 | 0.4997 | -0.1284 | |||
| CMG / Chipotle Mexican Grill, Inc. | 0.03 | -13.87 | 1.52 | -3.67 | 0.4883 | -0.0358 | |||
| AVY / Avery Dennison Corporation | 0.01 | -4.43 | 1.50 | -10.40 | 0.4814 | 0.0286 | |||
| SBAC / SBA Communications Corporation | 0.01 | 1.49 | 1.49 | 8.39 | 0.4772 | 0.0218 | |||
| TKO / TKO Group Holdings, Inc. | 0.01 | 1.41 | 0.4540 | 0.4540 | |||||
| FOXA / Fox Corporation | 0.02 | -10.06 | 1.39 | -10.94 | 0.4470 | -0.0719 | |||
| EQR / Equity Residential | 0.02 | 1.52 | 1.36 | -4.30 | 0.4359 | -0.0349 | |||
| NWSA / News Corporation | 0.04 | -7.24 | 1.30 | 1.33 | 0.4171 | -0.0086 | |||
| AZO / AutoZone, Inc. | 0.00 | -9.84 | 1.29 | -12.24 | 0.4147 | -0.0737 | |||
| HLT / Hilton Worldwide Holdings Inc. | 0.00 | -14.77 | 1.27 | -0.24 | 0.4080 | -0.0148 | |||
| MOS / The Mosaic Company | 0.03 | -1.77 | 1.27 | 45.81 | 0.4077 | 0.1720 | |||
| MAR / Marriott International, Inc. | 0.00 | -13.95 | 1.25 | -1.34 | 0.4008 | -0.0190 | |||
| ABNB / Airbnb, Inc. | 0.01 | -12.79 | 1.15 | -3.36 | 0.3690 | -0.0258 | |||
| INVH / Invitation Homes Inc. | 0.03 | 1.24 | 1.10 | -4.76 | 0.3534 | -0.0300 | |||
| WY / Weyerhaeuser Company | 0.04 | 0.85 | 1.10 | -11.47 | 0.3519 | -0.0592 | |||
| ESS / Essex Property Trust, Inc. | 0.00 | 1.42 | 1.07 | -6.22 | 0.3436 | -0.0352 | |||
| IPG / The Interpublic Group of Companies, Inc. | 0.04 | -8.22 | 1.04 | -17.29 | 0.3351 | -0.0836 | |||
| MAA / Mid-America Apartment Communities, Inc. | 0.01 | 1.58 | 1.02 | -10.28 | 0.3278 | -0.0499 | |||
| GM / General Motors Company | 0.02 | -23.44 | 0.95 | -19.90 | 0.3051 | -0.0886 | |||
| EMN / Eastman Chemical Company | 0.01 | 0.94 | 0.3012 | 0.3012 | |||||
| PARA / Paramount Global | 0.07 | -6.25 | 0.90 | 1.12 | 0.2895 | -0.0065 | |||
| SUI / Sun Communities, Inc. | 0.01 | 1.13 | 0.89 | -0.56 | 0.2860 | -0.0113 | |||
| MTCH / Match Group, Inc. | 0.03 | -9.23 | 0.88 | -10.12 | 0.2823 | -0.0424 | |||
| F / Ford Motor Company | 0.08 | -12.17 | 0.85 | -5.02 | 0.2737 | -0.0241 | |||
| ROST / Ross Stores, Inc. | 0.01 | -12.81 | 0.85 | -12.96 | 0.2718 | -0.0510 | |||
| KIM / Kimco Realty Corporation | 0.04 | 1.29 | 0.84 | 0.24 | 0.2681 | -0.0084 | |||
| YUM / Yum! Brands, Inc. | 0.01 | -12.44 | 0.83 | -17.63 | 0.2658 | -0.0675 | |||
| WPC / W. P. Carey Inc. | 0.01 | 1.18 | 0.80 | 0.00 | 0.2577 | -0.0087 | |||
| ALB / Albemarle Corporation | 0.01 | -2.31 | 0.80 | -28.89 | 0.2571 | -0.0476 | |||
| FOX / Fox Corporation | 0.02 | -7.00 | 0.79 | -8.87 | 0.2540 | -0.0342 | |||
| GLPI / Gaming and Leisure Properties, Inc. | 0.02 | 1.47 | 0.75 | -6.91 | 0.2423 | -0.0269 | |||
| UDR / UDR, Inc. | 0.02 | 1.63 | 0.72 | -8.25 | 0.2324 | -0.0291 | |||
| JLL / Jones Lang LaSalle Incorporated | 0.00 | 1.59 | 0.72 | 4.80 | 0.2313 | 0.0032 | |||
| DHI / D.R. Horton, Inc. | 0.01 | -16.28 | 0.72 | -15.08 | 0.2297 | -0.0500 | |||
| DOC / Healthpeak Properties, Inc. | 0.04 | 0.61 | 0.72 | -12.80 | 0.2296 | -0.0428 | |||
| CPT / Camden Property Trust | 0.01 | 1.26 | 0.71 | -6.74 | 0.2269 | -0.0245 | |||
| EBAY / eBay Inc. | 0.01 | -15.24 | 0.69 | -6.86 | 0.2224 | -0.0243 | |||
| ELS / Equity LifeStyle Properties, Inc. | 0.01 | 1.32 | 0.69 | -6.23 | 0.2222 | -0.0230 | |||
| REG / Regency Centers Corporation | 0.01 | 1.45 | 0.68 | -2.15 | 0.2199 | -0.0121 | |||
| AMH / American Homes 4 Rent | 0.02 | 1.87 | 0.68 | -2.74 | 0.2168 | -0.0138 | |||
| NLY / Annaly Capital Management, Inc. | 0.04 | 9.15 | 0.67 | 1.21 | 0.2151 | -0.0047 | |||
| Z / Zillow Group, Inc. | 0.01 | 6.96 | 0.66 | 9.39 | 0.2132 | 0.0115 | |||
| ARE / Alexandria Real Estate Equities, Inc. | 0.01 | -0.44 | 0.65 | -21.82 | 0.2094 | -0.0675 | |||
| GRMN / Garmin Ltd. | 0.00 | -12.35 | 0.65 | -15.80 | 0.2073 | -0.0470 | |||
| LAMR / Lamar Advertising Company | 0.01 | 1.57 | 0.63 | 8.29 | 0.2015 | 0.0092 | |||
| OHI / Omega Healthcare Investors, Inc. | 0.02 | 8.86 | 0.63 | 4.86 | 0.2011 | 0.0027 | |||
| HST / Host Hotels & Resorts, Inc. | 0.04 | -0.12 | 0.63 | 7.93 | 0.2010 | 0.0085 | |||
| CCL / Carnival Corporation & plc | 0.02 | -11.85 | 0.59 | 26.92 | 0.1908 | 0.0354 | |||
| BXP / Boston Properties, Inc. | 0.01 | 1.77 | 0.58 | 2.12 | 0.1859 | -0.0021 | |||
| CUBE / CubeSmart | 0.01 | 2.05 | 0.57 | 1.43 | 0.1826 | -0.0033 | |||
| TSCO / Tractor Supply Company | 0.01 | -12.53 | 0.56 | -16.24 | 0.1805 | -0.0422 | |||
| AGNC / AGNC Investment Corp. | 0.06 | 16.87 | 0.55 | 12.20 | 0.1774 | 0.0138 | |||
| LULU / lululemon athletica inc. | 0.00 | -14.42 | 0.53 | -28.26 | 0.1698 | -0.0746 | |||
| LEN / Lennar Corporation | 0.00 | -13.95 | 0.52 | -17.04 | 0.1658 | -0.0409 | |||
| EGP / EastGroup Properties, Inc. | 0.00 | 6.69 | 0.51 | 1.19 | 0.1642 | -0.0035 | |||
| DRI / Darden Restaurants, Inc. | 0.00 | -12.84 | 0.51 | -8.60 | 0.1639 | -0.0214 | |||
| REXR / Rexford Industrial Realty, Inc. | 0.01 | 7.42 | 0.49 | -2.58 | 0.1579 | -0.0093 | |||
| NNN / NNN REIT, Inc. | 0.01 | 1.88 | 0.48 | 3.02 | 0.1533 | -0.0003 | |||
| ADC / Agree Realty Corporation | 0.01 | 8.21 | 0.47 | 2.39 | 0.1518 | -0.0014 | |||
| BRX / Brixmor Property Group Inc. | 0.02 | 2.57 | 0.47 | 0.64 | 0.1506 | -0.0041 | |||
| NVR / NVR, Inc. | 0.00 | -13.04 | 0.44 | -11.22 | 0.1423 | -0.0236 | |||
| NWS / News Corporation | 0.01 | -7.20 | 0.44 | 4.74 | 0.1422 | 0.0020 | |||
| FRT / Federal Realty Investment Trust | 0.00 | 2.24 | 0.43 | -0.69 | 0.1389 | -0.0057 | |||
| PHM / PulteGroup, Inc. | 0.00 | -13.43 | 0.43 | -11.27 | 0.1366 | -0.0224 | |||
| ULTA / Ulta Beauty, Inc. | 0.00 | -16.82 | 0.42 | 6.31 | 0.1352 | 0.0036 | |||
| EXPE / Expedia Group, Inc. | 0.00 | -13.41 | 0.41 | -13.26 | 0.1326 | -0.0251 | |||
| WSM / Williams-Sonoma, Inc. | 0.00 | 0.40 | 0.1297 | 0.1297 | |||||
| STAG / STAG Industrial, Inc. | 0.01 | 3.84 | 0.40 | 4.21 | 0.1274 | 0.0011 | |||
| STWD / Starwood Property Trust, Inc. | 0.02 | 2.01 | 0.38 | 3.81 | 0.1223 | 0.0002 | |||
| VNO / Vornado Realty Trust | 0.01 | 1.50 | 0.38 | 5.04 | 0.1205 | 0.0018 | |||
| FR / First Industrial Realty Trust, Inc. | 0.01 | 1.29 | 0.37 | -9.69 | 0.1199 | -0.0173 | |||
| TPR / Tapestry, Inc. | 0.00 | -21.46 | 0.37 | -1.86 | 0.1188 | -0.0066 | |||
| RITM / Rithm Capital Corp. | 0.03 | 3.31 | 0.35 | 1.73 | 0.1132 | -0.0017 | |||
| GPC / Genuine Parts Company | 0.00 | -11.45 | 0.34 | -9.81 | 0.1093 | -0.0160 | |||
| HR / Healthcare Realty Trust Incorporated | 0.02 | 0.54 | 0.33 | -5.49 | 0.1051 | -0.0100 | |||
| DECK / Deckers Outdoor Corporation | 0.00 | -12.61 | 0.32 | -19.39 | 0.1016 | -0.0288 | |||
| DPZ / Domino's Pizza, Inc. | 0.00 | -13.67 | 0.31 | -15.19 | 0.0987 | -0.0218 | |||
| Aptiv plc / EC (JE00BTDN8H13) | 0.00 | -18.81 | 0.30 | -6.87 | 0.0958 | -0.0106 | |||
| CUZ / Cousins Properties Incorporated | 0.01 | 1.96 | 0.30 | 3.83 | 0.0957 | 0.0004 | |||
| LVS / Las Vegas Sands Corp. | 0.01 | -14.29 | 0.30 | -3.58 | 0.0952 | -0.0067 | |||
| SBRA / Sabra Health Care REIT, Inc. | 0.01 | 1.96 | 0.26 | 7.92 | 0.0832 | 0.0033 | |||
| BBY / Best Buy Co., Inc. | 0.00 | -13.98 | 0.26 | -21.58 | 0.0829 | -0.0263 | |||
| COLD / Americold Realty Trust, Inc. | 0.02 | 1.72 | 0.26 | -21.17 | 0.0825 | -0.0257 | |||
| RL / Ralph Lauren Corporation | 0.00 | -12.31 | 0.22 | 8.82 | 0.0715 | 0.0037 | |||
| POOL / Pool Corporation | 0.00 | -12.08 | 0.22 | -19.71 | 0.0708 | -0.0201 | |||
| KRC / Kilroy Realty Corporation | 0.01 | 0.60 | 0.21 | 5.42 | 0.0687 | 0.0013 | |||
| ZG / Zillow Group, Inc. | 0.00 | -3.10 | 0.21 | -0.95 | 0.0674 | -0.0028 | |||
| KMX / CarMax, Inc. | 0.00 | -13.39 | 0.21 | -25.36 | 0.0664 | -0.0255 | |||
| MRP / Millrose Properties, Inc. | 0.01 | -1.72 | 0.20 | 5.79 | 0.0648 | 0.0014 | |||
| HAS / Hasbro, Inc. | 0.00 | -12.20 | 0.19 | 5.43 | 0.0626 | 0.0012 | |||
| LKQ / LKQ Corporation | 0.01 | -12.10 | 0.19 | -23.81 | 0.0619 | -0.0218 | |||
| RYN / Rayonier Inc. | 0.01 | 5.70 | 0.18 | -16.13 | 0.0586 | -0.0134 | |||
| NCLH / Norwegian Cruise Line Holdings Ltd. | 0.01 | -11.34 | 0.18 | -4.71 | 0.0584 | -0.0053 | |||
| WYNN / Wynn Resorts, Limited | 0.00 | -16.16 | 0.17 | -6.21 | 0.0535 | -0.0053 | |||
| PCH / PotlatchDeltic Corporation | 0.00 | 1.27 | 0.16 | -13.90 | 0.0519 | -0.0104 | |||
| LINE / Lineage, Inc. | 0.00 | 1.07 | 0.15 | -25.12 | 0.0489 | -0.0185 | |||
| MGM / MGM Resorts International | 0.00 | -20.03 | 0.14 | -7.79 | 0.0459 | -0.0052 | |||
| HHH / Howard Hughes Holdings Inc. | 0.00 | 3.96 | 0.12 | -4.62 | 0.0398 | -0.0036 | |||
| CZR / Caesars Entertainment, Inc. | 0.00 | -15.09 | 0.12 | -3.28 | 0.0380 | -0.0027 | |||
| JPMorgan U.S. Government Money Market Fund - Class IM / STIV (N/A) | 0.11 | 0.11 | 0.0353 | 0.0353 | |||||
| Morgan Stanley Institutional Liquidity Funds Government Portfolio - Institutional Share Class / STIV (N/A) | 0.11 | 0.11 | 0.0353 | 0.0353 | |||||
| MHK / Mohawk Industries, Inc. | 0.00 | -12.14 | 0.11 | -19.85 | 0.0353 | -0.0099 | |||
| SEG / Seaport Entertainment Group Inc. | 0.00 | 0.83 | 0.01 | -10.00 | 0.0029 | -0.0005 |