Mga Batayang Estadistika
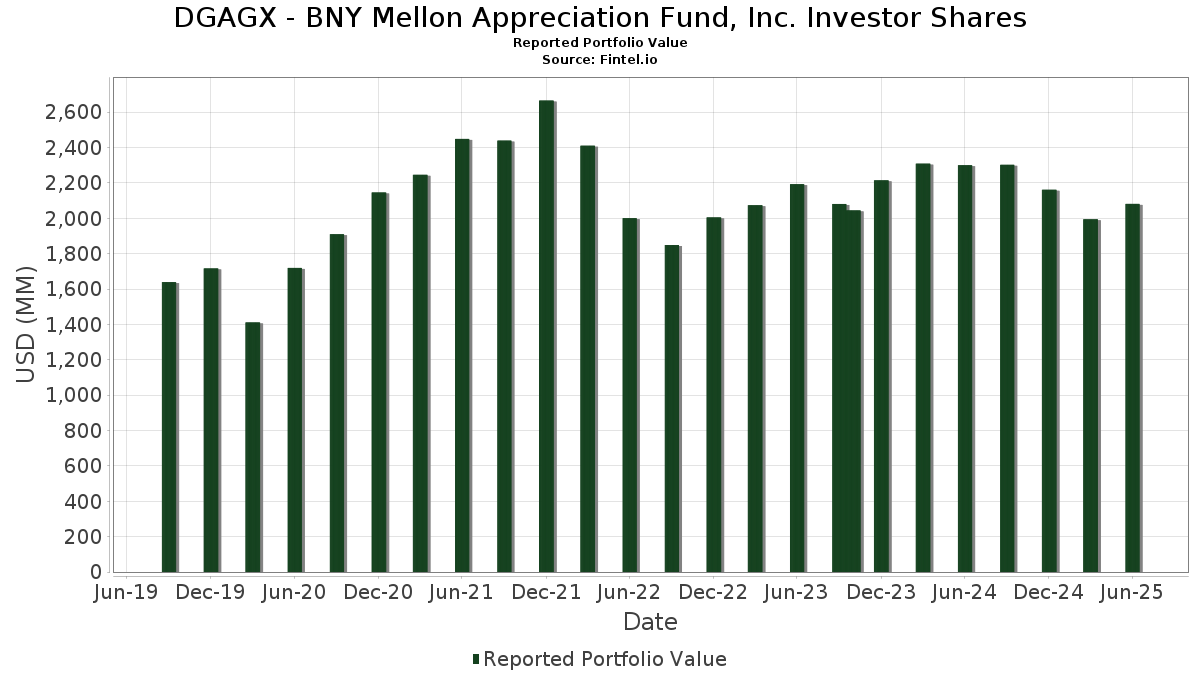
| Nilai Portofolio | $ 2,081,359,159 |
| Posisi Saat Ini | 51 |
Kepemilikan Terbaru, Kinerja, AUM (dari 13F, 13D)
DGAGX - BNY Mellon Appreciation Fund, Inc. Investor Shares telah mengungkapkan total kepemilikan 51 dalam pengajuan SEC terbaru mereka. Nilai portofolio terbaru dihitung sebesar $ 2,081,359,159 USD. Aset yang Dikelola (AUM) sebenarnya adalah nilai ini ditambah kas (yang tidak diungkapkan). Aset-aset utama DGAGX - BNY Mellon Appreciation Fund, Inc. Investor Shares adalah Microsoft Corporation (US:MSFT) , Apple Inc. (US:AAPL) , Amazon.com, Inc. (US:AMZN) , NVIDIA Corporation (US:NVDA) , and Alphabet Inc. (US:GOOG) .
Peningkatan Tertinggi Kuartal Ini
Kami menggunakan perubahan dalam alokasi portofolio karena ini adalah metrik yang paling bermakna. Perubahan dapat disebabkan oleh perdagangan atau perubahan harga saham.
| Keamanan | Saham (MM) |
Nilai (Juta Dolar AS) |
Portfolio % | ΔPorsyento ng Portfolio |
|---|---|---|---|---|
| 0.75 | 117.92 | 5.6732 | 1.4649 | |
| 0.35 | 172.48 | 8.2979 | 1.3595 | |
| 0.10 | 71.04 | 3.4178 | 0.7716 | |
| 0.20 | 44.33 | 2.1327 | 0.4274 | |
| 0.08 | 62.18 | 2.9917 | 0.4238 | |
| 0.11 | 37.95 | 1.8257 | 0.4091 | |
| 7.03 | 7.03 | 0.3381 | 0.3381 | |
| 0.04 | 43.49 | 2.0925 | 0.3250 | |
| 0.07 | 59.75 | 2.8747 | 0.2615 | |
| 0.58 | 128.07 | 6.1616 | 0.2368 |
Penurunan Tertinggi Kuartal Ini
Kami menggunakan perubahan dalam alokasi portofolio karena ini adalah metrik yang paling bermakna. Perubahan dapat disebabkan oleh perdagangan atau perubahan harga saham.
| Keamanan | Saham (MM) |
Nilai (Juta Dolar AS) |
Portfolio % | ΔPorsyento ng Portfolio |
|---|---|---|---|---|
| 0.65 | 133.68 | 6.4315 | -1.3793 | |
| 0.06 | 17.48 | 0.8412 | -0.7813 | |
| 1.57 | 40.53 | 1.9497 | -0.7568 | |
| 0.20 | 71.05 | 3.4184 | -0.7051 | |
| 0.33 | 46.68 | 2.2460 | -0.6596 | |
| 0.61 | 41.77 | 2.0095 | -0.5093 | |
| 0.16 | 41.59 | 2.0009 | -0.5039 | |
| 0.10 | 12.94 | 0.6226 | -0.4465 | |
| 0.06 | 28.90 | 1.3903 | -0.4113 | |
| 0.00 | 40.08 | 1.9285 | -0.3306 |
Pengajuan 13F dan Dana
Formulir ini diajukan pada 2025-08-26 untuk periode pelaporan 2025-06-30. Klik ikon tautan untuk melihat riwayat transaksi selengkapnya.
Tingkatkan ke versi premium untuk membuka data premium dan ekspor ke Excel. ![]() .
.
| Keamanan | Ketik | Harga Saham Rata-rata | Saham (MM) |
ΔSaham (%) |
ΔSaham (%) |
Nilai ($MM) |
Portpolyo (%) |
ΔPortofolio (%) |
|
|---|---|---|---|---|---|---|---|---|---|
| MSFT / Microsoft Corporation | 0.35 | -3.49 | 172.48 | 27.88 | 8.2979 | 1.3595 | |||
| AAPL / Apple Inc. | 0.65 | -4.68 | 133.68 | -11.96 | 6.4315 | -1.3793 | |||
| AMZN / Amazon.com, Inc. | 0.58 | -3.56 | 128.07 | 11.20 | 6.1616 | 0.2368 | |||
| NVDA / NVIDIA Corporation | 0.75 | -1.12 | 117.92 | 44.15 | 5.6732 | 1.4649 | |||
| GOOG / Alphabet Inc. | 0.49 | -3.66 | 87.21 | 9.39 | 4.1955 | 0.0946 | |||
| V / Visa Inc. | 0.20 | -12.50 | 71.05 | -11.36 | 3.4184 | -0.7051 | |||
| META / Meta Platforms, Inc. | 0.10 | 7.84 | 71.04 | 38.10 | 3.4178 | 0.7716 | |||
| INTU / Intuit Inc. | 0.08 | -2.89 | 62.18 | 24.57 | 2.9917 | 0.4238 | |||
| TXN / Texas Instruments Incorporated | 0.30 | -4.79 | 61.46 | 10.00 | 2.9571 | 0.0826 | |||
| ASML / ASML Holding N.V. - Depositary Receipt (Common Stock) | 0.07 | -2.74 | 59.75 | 17.63 | 2.8747 | 0.2615 | |||
| BLK / BlackRock, Inc. | 0.05 | -3.10 | 51.58 | 7.42 | 2.4813 | 0.0113 | |||
| SPGI / S&P Global Inc. | 0.09 | -3.37 | 49.97 | 0.28 | 2.4041 | -0.1592 | |||
| CVX / Chevron Corporation | 0.33 | -3.44 | 46.68 | -17.35 | 2.2460 | -0.6596 | |||
| ISRG / Intuitive Surgical, Inc. | 0.08 | -2.35 | 45.23 | 7.15 | 2.1758 | 0.0044 | |||
| TSM / Taiwan Semiconductor Manufacturing Company Limited - Depositary Receipt (Common Stock) | 0.20 | -1.99 | 44.33 | 33.72 | 2.1327 | 0.4274 | |||
| NOW / ServiceNow, Inc. | 0.04 | -1.97 | 43.49 | 26.59 | 2.0925 | 0.3250 | |||
| NVO / Novo Nordisk A/S - Depositary Receipt (Common Stock) | 0.61 | -14.17 | 41.77 | -14.69 | 2.0095 | -0.5093 | |||
| PGR / The Progressive Corporation | 0.16 | -9.42 | 41.59 | -14.58 | 2.0009 | -0.5039 | |||
| MA / Mastercard Incorporated | 0.07 | -3.02 | 41.08 | -0.57 | 1.9761 | -0.1491 | |||
| BA. / BAE Systems plc | 1.57 | -40.06 | 40.53 | -22.97 | 1.9497 | -0.7568 | |||
| BRK.A / Berkshire Hathaway Inc. | 0.00 | 0.00 | 40.08 | -8.72 | 1.9285 | -0.3306 | |||
| ETN / Eaton Corporation plc | 0.11 | 4.94 | 37.95 | 37.81 | 1.8257 | 0.4091 | |||
| MCD / McDonald's Corporation | 0.12 | -2.56 | 36.49 | -8.86 | 1.7557 | -0.3040 | |||
| ICE / Intercontinental Exchange, Inc. | 0.18 | -10.55 | 33.87 | -4.86 | 1.6296 | -0.2019 | |||
| ABT / Abbott Laboratories | 0.24 | -3.56 | 32.75 | -1.12 | 1.5755 | -0.1282 | |||
| XOM / Exxon Mobil Corporation | 0.28 | -3.41 | 30.17 | -12.45 | 1.4515 | -0.3212 | |||
| MC / LVMH Moët Hennessy - Louis Vuitton, Société Européenne | 0.06 | -2.74 | 28.90 | -17.48 | 1.3903 | -0.4113 | |||
| CP / Canadian Pacific Kansas City Limited | 0.33 | -3.32 | 26.20 | 9.16 | 1.2606 | 0.0257 | |||
| PM / Philip Morris International Inc. | 0.14 | -57.56 | 25.50 | -17.83 | 1.2267 | -0.1713 | |||
| ADBE / Adobe Inc. | 0.06 | -6.96 | 25.09 | -6.15 | 1.2073 | -0.1681 | |||
| CSGP / CoStar Group, Inc. | 0.29 | -3.03 | 23.59 | -1.60 | 1.1348 | -0.0983 | |||
| AZN / AstraZeneca PLC - Depositary Receipt (Common Stock) | 0.33 | -2.81 | 23.05 | -7.59 | 1.1091 | -0.1743 | |||
| KO / The Coca-Cola Company | 0.32 | -3.30 | 22.98 | -4.48 | 1.1055 | -0.1320 | |||
| SHW / The Sherwin-Williams Company | 0.07 | -3.28 | 22.49 | -4.90 | 1.0822 | -0.1346 | |||
| CME / CME Group Inc. | 0.08 | -2.59 | 20.72 | 1.20 | 0.9968 | -0.0564 | |||
| RMS / Hermès International Société en commandite par actions | 0.01 | -3.53 | 20.40 | 0.39 | 0.9815 | -0.0639 | |||
| MAR / Marriott International, Inc. | 0.07 | -3.48 | 19.90 | 10.71 | 0.9572 | 0.0327 | |||
| ZTS / Zoetis Inc. | 0.13 | -1.95 | 19.57 | -7.13 | 0.9417 | -0.1426 | |||
| LLY / Eli Lilly and Company | 0.02 | -1.00 | 19.29 | -6.56 | 0.9282 | -0.1340 | |||
| ADP / Automatic Data Processing, Inc. | 0.06 | -2.50 | 19.23 | -1.59 | 0.9252 | -0.0800 | |||
| UNH / UnitedHealth Group Incorporated | 0.06 | -6.93 | 17.48 | -44.57 | 0.8412 | -0.7813 | |||
| ODFL / Old Dominion Freight Line, Inc. | 0.10 | -0.81 | 16.81 | -2.70 | 0.8089 | -0.0801 | |||
| HD / The Home Depot, Inc. | 0.05 | 0.00 | 16.68 | 0.04 | 0.8026 | -0.0552 | |||
| NKE / NIKE, Inc. | 0.21 | -3.38 | 14.93 | 8.13 | 0.7183 | 0.0080 | |||
| VRSK / Verisk Analytics, Inc. | 0.05 | -3.38 | 14.04 | 1.13 | 0.6754 | -0.0387 | |||
| PEP / PepsiCo, Inc. | 0.10 | -29.29 | 12.94 | -37.73 | 0.6226 | -0.4465 | |||
| PG / The Procter & Gamble Company | 0.08 | -0.68 | 12.25 | -7.15 | 0.5896 | -0.0894 | |||
| IT / Gartner, Inc. | 0.03 | 0.00 | 11.80 | -3.70 | 0.5679 | -0.0626 | |||
| DE / Deere & Company | 0.02 | 0.00 | 9.28 | 8.34 | 0.4465 | 0.0058 | |||
| OTIS / Otis Worldwide Corporation | 0.09 | -2.61 | 8.78 | -6.55 | 0.4224 | -0.0609 | |||
| DREYFUS INSTITUTIONAL PREFERRED GOVERNMENT PLUS MONEY MARKET FUND / STIV (000000000) | 7.03 | 7.03 | 0.3381 | 0.3381 |