Mga Batayang Estadistika
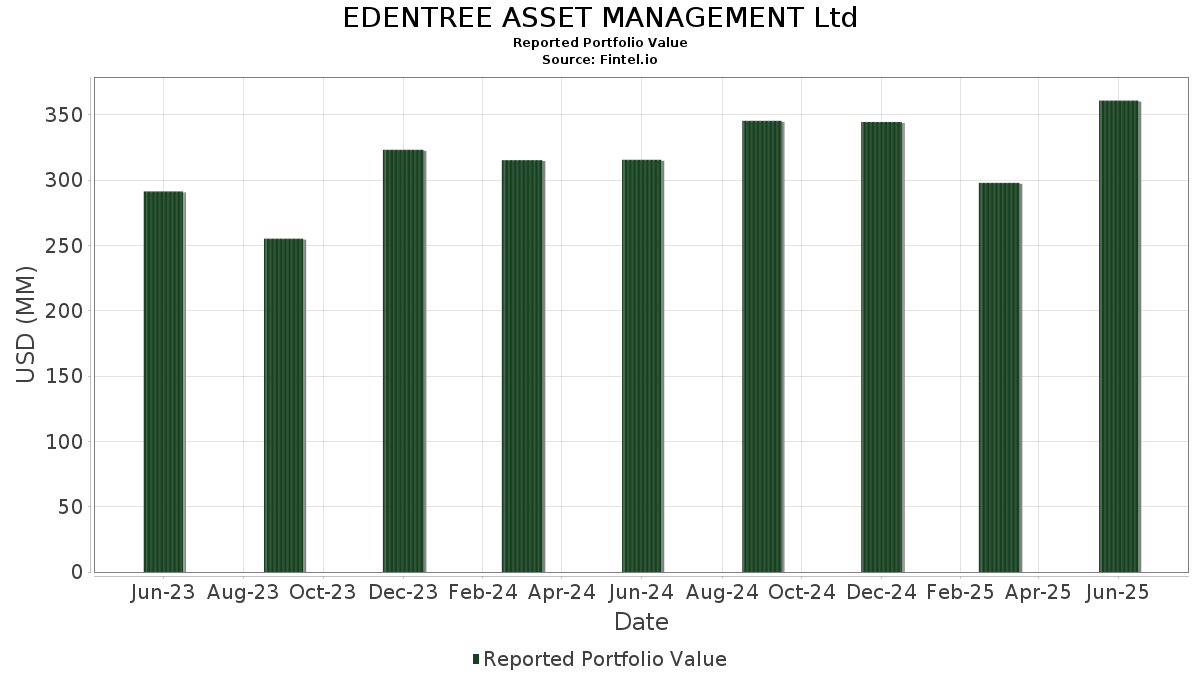
| Nilai Portofolio | $ 360,853,712 |
| Posisi Saat Ini | 62 |
Kepemilikan Terbaru, Kinerja, AUM (dari 13F, 13D)
EDENTREE ASSET MANAGEMENT Ltd telah mengungkapkan total kepemilikan 62 dalam pengajuan SEC terbaru mereka. Nilai portofolio terbaru dihitung sebesar $ 360,853,712 USD. Aset yang Dikelola (AUM) sebenarnya adalah nilai ini ditambah kas (yang tidak diungkapkan). Aset-aset utama EDENTREE ASSET MANAGEMENT Ltd adalah Microsoft Corporation (US:MSFT) , Alphabet Inc. (US:GOOGL) , Medtronic plc (US:MDT) , Xylem Inc. (US:XYL) , and Analog Devices, Inc. (US:ADI) . Posisi baru EDENTREE ASSET MANAGEMENT Ltd meliputi: TopBuild Corp. (US:BLD) , Builders FirstSource, Inc. (US:BLDR) , NVIDIA Corporation (US:NVDA) , .
Peningkatan Tertinggi Kuartal Ini
Kami menggunakan perubahan dalam alokasi portofolio karena ini adalah metrik yang paling bermakna. Perubahan dapat disebabkan oleh perdagangan atau perubahan harga saham.
| Keamanan | Saham (MM) |
Nilai (Juta Dolar AS) |
Portfolio % | ΔPorsyento ng Portfolio |
|---|---|---|---|---|
| 0.09 | 9.79 | 2.7133 | 2.2554 | |
| 0.08 | 38.83 | 10.7596 | 1.8488 | |
| 0.02 | 6.55 | 1.8160 | 1.8160 | |
| 0.05 | 6.39 | 1.7700 | 1.7700 | |
| 0.19 | 33.96 | 9.4112 | 1.5945 | |
| 0.26 | 10.75 | 2.9788 | 0.7739 | |
| 0.11 | 14.36 | 3.9782 | 0.6561 | |
| 0.08 | 5.77 | 1.5990 | 0.6273 | |
| 0.17 | 12.11 | 3.3563 | 0.4236 | |
| 0.01 | 6.52 | 1.8060 | 0.4208 |
Penurunan Tertinggi Kuartal Ini
Kami menggunakan perubahan dalam alokasi portofolio karena ini adalah metrik yang paling bermakna. Perubahan dapat disebabkan oleh perdagangan atau perubahan harga saham.
| Keamanan | Saham (MM) |
Nilai (Juta Dolar AS) |
Portfolio % | ΔPorsyento ng Portfolio |
|---|---|---|---|---|
| 0.21 | 18.51 | 5.1303 | -2.2192 | |
| 0.01 | 0.89 | 0.2458 | -2.0459 | |
| 0.03 | 8.02 | 2.2219 | -1.1475 | |
| 0.07 | 7.29 | 2.0207 | -0.7736 | |
| 0.12 | 9.56 | 2.6494 | -0.5384 | |
| 0.00 | 1.46 | 0.4032 | -0.4493 | |
| 0.01 | 4.29 | 1.1893 | -0.4453 | |
| 0.02 | 8.08 | 2.2381 | -0.4274 | |
| 0.02 | 5.65 | 1.5652 | -0.4170 | |
| 0.08 | 9.55 | 2.6474 | -0.3250 |
Pengajuan 13F dan Dana
Formulir ini diajukan pada 2025-08-14 untuk periode pelaporan 2025-06-30. Klik ikon tautan untuk melihat riwayat transaksi selengkapnya.
Tingkatkan ke versi premium untuk membuka data premium dan ekspor ke Excel. ![]() .
.
| Keamanan | Ketik | Harga Saham Rata-rata | Saham (MM) |
ΔSaham (%) |
ΔSaham (%) |
Nilai ($MM) |
Portpolyo (%) |
ΔPortofolio (%) |
|
|---|---|---|---|---|---|---|---|---|---|
| MSFT / Microsoft Corporation | 0.08 | 10.29 | 38.83 | 46.27 | 10.7596 | 1.8488 | |||
| GOOGL / Alphabet Inc. | 0.19 | 27.92 | 33.96 | 45.84 | 9.4112 | 1.5945 | |||
| MDT / Medtronic plc | 0.21 | -12.85 | 18.51 | -15.44 | 5.1303 | -2.2192 | |||
| XYL / Xylem Inc. | 0.11 | 33.97 | 14.36 | 45.06 | 3.9782 | 0.6561 | |||
| ADI / Analog Devices, Inc. | 0.05 | 13.09 | 13.01 | 33.48 | 3.6040 | 0.3331 | |||
| NKE / NIKE, Inc. | 0.17 | 23.99 | 12.11 | 38.63 | 3.3563 | 0.4236 | |||
| PFG / Principal Financial Group, Inc. | 0.15 | 37.59 | 11.80 | 29.60 | 3.2705 | 0.2135 | |||
| WCN / Waste Connections, Inc. | 0.06 | 29.91 | 11.56 | 24.32 | 3.2028 | 0.0822 | |||
| MSA / MSA Safety Incorporated | 0.07 | 13.16 | 11.27 | 29.21 | 3.1227 | 0.1949 | |||
| PANW / Palo Alto Networks, Inc. | 0.05 | 11.33 | 11.06 | 33.49 | 3.0644 | 0.2836 | |||
| BRKR / Bruker Corporation | 0.26 | 65.76 | 10.75 | 63.66 | 2.9788 | 0.7739 | |||
| CRM / Salesforce, Inc. | 0.04 | 9.92 | 9.82 | 11.70 | 2.7218 | -0.2296 | |||
| WMS / Advanced Drainage Systems, Inc. | 0.09 | 578.80 | 9.79 | 617.74 | 2.7133 | 2.2554 | |||
| MRK / Merck & Co., Inc. | 0.12 | 14.17 | 9.56 | 0.67 | 2.6494 | -0.5384 | |||
| HIG / The Hartford Insurance Group, Inc. | 0.08 | 5.27 | 9.55 | 7.89 | 2.6474 | -0.3250 | |||
| VMI / Valmont Industries, Inc. | 0.03 | 3.07 | 8.21 | 17.91 | 2.2751 | -0.0622 | |||
| AVNT / Avient Corporation | 0.25 | 48.34 | 8.16 | 28.91 | 2.2600 | 0.1361 | |||
| ADBE / Adobe Inc. | 0.02 | 0.85 | 8.08 | 1.71 | 2.2381 | -0.4274 | |||
| LSCC / Lattice Semiconductor Corporation | 0.16 | 16.90 | 8.03 | 9.05 | 2.2243 | -0.2464 | |||
| CME / CME Group Inc. | 0.03 | -23.11 | 8.02 | -20.13 | 2.2219 | -1.1475 | |||
| BSX / Boston Scientific Corporation | 0.07 | -17.73 | 7.29 | -12.40 | 2.0207 | -0.7736 | |||
| BLD / TopBuild Corp. | 0.02 | 6.55 | 1.8160 | 1.8160 | |||||
| SPOT / Spotify Technology S.A. | 0.01 | 13.33 | 6.52 | 57.95 | 1.8060 | 0.4208 | |||
| BLDR / Builders FirstSource, Inc. | 0.05 | 6.39 | 1.7700 | 1.7700 | |||||
| ATKR / Atkore Inc. | 0.08 | 69.80 | 5.77 | 99.38 | 1.5990 | 0.6273 | |||
| ACN / Accenture plc | 0.02 | 0.00 | 5.65 | -4.34 | 1.5652 | -0.4170 | |||
| V / Visa Inc. | 0.01 | -12.95 | 4.29 | -11.87 | 1.1893 | -0.4453 | |||
| TSM / Taiwan Semiconductor Manufacturing Company Limited - Depositary Receipt (Common Stock) | 0.02 | -1.28 | 3.50 | 34.67 | 0.9689 | 0.0973 | |||
| GOOG / Alphabet Inc. | 0.02 | -10.51 | 3.26 | 1.68 | 0.9040 | -0.1731 | |||
| CLH / Clean Harbors, Inc. | 0.01 | 0.00 | 2.54 | 17.31 | 0.7047 | -0.0230 | |||
| AAPL / Apple Inc. | 0.01 | -10.39 | 2.49 | -17.25 | 0.6888 | -0.3194 | |||
| ICE / Intercontinental Exchange, Inc. | 0.01 | 32.34 | 2.48 | 40.68 | 0.6864 | 0.0953 | |||
| FSS / Federal Signal Corporation | 0.02 | 2.92 | 2.31 | 49.06 | 0.6400 | 0.1199 | |||
| STN / Stantec Inc. | 0.02 | 0.00 | 2.15 | 30.94 | 0.5960 | 0.0447 | |||
| AMAT / Applied Materials, Inc. | 0.01 | 0.00 | 1.97 | 25.96 | 0.5462 | 0.0211 | |||
| CDNS / Cadence Design Systems, Inc. | 0.01 | 0.00 | 1.92 | 21.15 | 0.5319 | -0.0001 | |||
| FERG / Ferguson Enterprises Inc. | 0.01 | 0.00 | 1.87 | 35.97 | 0.5185 | 0.0565 | |||
| LIN / Linde plc | 0.00 | 0.00 | 1.80 | 0.67 | 0.4980 | -0.1010 | |||
| CSCO / Cisco Systems, Inc. | 0.03 | 0.00 | 1.79 | 12.34 | 0.4971 | -0.0387 | |||
| MWA / Mueller Water Products, Inc. | 0.07 | 12.30 | 1.76 | 6.17 | 0.4869 | -0.0685 | |||
| PNR / Pentair plc | 0.02 | 0.00 | 1.59 | 17.31 | 0.4396 | -0.0145 | |||
| TMUS / T-Mobile US, Inc. | 0.01 | 0.00 | 1.58 | -10.59 | 0.4374 | -0.1553 | |||
| AYI / Acuity Inc. | 0.00 | 0.00 | 1.46 | 13.23 | 0.4058 | -0.0283 | |||
| ADSK / Autodesk, Inc. | 0.00 | -51.53 | 1.46 | -42.69 | 0.4032 | -0.4493 | |||
| PG / The Procter & Gamble Company | 0.01 | 0.00 | 1.38 | -6.58 | 0.3821 | -0.1131 | |||
| JXN / Jackson Financial Inc. | 0.01 | 0.00 | 1.33 | 6.05 | 0.3691 | -0.0525 | |||
| EMR / Emerson Electric Co. | 0.01 | 0.00 | 1.29 | 21.62 | 0.3570 | 0.0012 | |||
| PFE / Pfizer Inc. | 0.05 | 0.00 | 1.21 | -4.34 | 0.3357 | -0.0894 | |||
| BMY / Bristol-Myers Squibb Company | 0.03 | 0.00 | 1.16 | -24.13 | 0.3207 | -0.1914 | |||
| RRX / Regal Rexnord Corporation | 0.01 | 15.61 | 1.10 | 47.26 | 0.3049 | 0.0542 | |||
| SW / Smurfit Westrock Plc | 0.03 | 0.00 | 1.08 | -4.26 | 0.2988 | -0.0792 | |||
| NXPI / NXP Semiconductors N.V. | 0.00 | 0.00 | 0.92 | 14.91 | 0.2541 | -0.0140 | |||
| IEX / IDEX Corporation | 0.01 | -86.62 | 0.89 | -87.02 | 0.2458 | -2.0459 | |||
| AOS / A. O. Smith Corporation | 0.01 | 0.00 | 0.86 | 0.35 | 0.2389 | -0.0495 | |||
| HASI / HA Sustainable Infrastructure Capital, Inc. | 0.03 | 21.78 | 0.85 | 11.99 | 0.2357 | -0.0194 | |||
| AVGO / Broadcom Inc. | 0.00 | -40.43 | 0.77 | -1.91 | 0.2139 | -0.0503 | |||
| RYN / Rayonier Inc. | 0.03 | 29.45 | 0.77 | 2.81 | 0.2133 | -0.0380 | |||
| AUTL / Autolus Therapeutics plc - Depositary Receipt (Common Stock) | 0.30 | 0.00 | 0.68 | 48.05 | 0.1896 | 0.0345 | |||
| NOW / ServiceNow, Inc. | 0.00 | -23.57 | 0.62 | -1.44 | 0.1708 | -0.0391 | |||
| PAYX / Paychex, Inc. | 0.00 | 0.00 | 0.58 | -5.68 | 0.1613 | -0.0457 | |||
| ABBV / AbbVie Inc. | 0.00 | 0.00 | 0.52 | -11.43 | 0.1440 | -0.0530 | |||
| NVDA / NVIDIA Corporation | 0.00 | 0.05 | 0.0149 | 0.0149 | |||||
| MRVL / Marvell Technology, Inc. | 0.00 | -100.00 | 0.00 | 0.0000 | |||||
| AMD / Advanced Micro Devices, Inc. | 0.00 | -100.00 | 0.00 | 0.0000 |